Assignments Office Hours Graded Work CPSC 314 Computer Graphics - - PowerPoint PPT Presentation

assignments office hours graded work
SMART_READER_LITE
LIVE PREVIEW

Assignments Office Hours Graded Work CPSC 314 Computer Graphics - - PowerPoint PPT Presentation

University of British Columbia Assignments Office Hours Graded Work CPSC 314 Computer Graphics project extra TA office hours in lab 005 for P4/H4 still have some marked work not picked up, Jan-Apr 2010 P4 due today 5pm (plus


slide-1
SLIDE 1

University of British Columbia CPSC 314 Computer Graphics Jan-Apr 2010 Tamara Munzner http://www.ugrad.cs.ubc.ca/~cs314/Vjan2010

Nonspatial/Information Visualization II Week 13, Wed Apr 14

2

Assignments

  • project
  • P4 due today 5pm (plus grace/late days)
  • project 4 demo signup sheet, for last time
  • I will scan and post so you can check your time
  • you must contact me by Fri to schedule if you weren't in class to

sign up

  • otherwise 2% huntdown penalty
  • email me in advance if you need to change
  • otherwise 2% noshow penalty
  • homework
  • H4 solutions released Friday
  • homeworks not accepted after Thu 5pm
  • again: if you hand in late, do include time/date at top
  • H4 will be graded before exam
  • stay tuned, I'll announce on discussion group when they're ready

to pick up

3

Office Hours

  • extra TA office hours in lab 005 for P4/H4
  • Wed 4/14 2-4, 5-7 (Shailen)
  • Thu 4/15 3-5 (Kai)
  • Fri 4/16 11-4 (Garrett)
  • my office hours for rest of term
  • Fri 4/16 4pm
  • by appointment - send me email to book
  • (I'm out of town 4/24-4/27, right after exam)
4

Graded Work

  • still have some marked work not picked up,

come grab it!

  • homeworks, midterms
  • some extra handouts in lab
  • or print out yourself, everything posted on

web site

  • don't forget to check ugrad account for

grading updates

  • find out what you got
  • also cross-check our records against yours
5

Final Exam

  • Apr 23 8:30-11:30am, location DMP 310
  • across the hall
  • exam will be 2.5 hrs
  • extra 30 min in case of fire alarms, etc
  • closed book
  • one page notes, 8.5"x11", handwritten
  • both sides allowed, fine to reuse one side from

midterm

  • calculator is a good idea
  • IDs out and face up
  • bags/coats in front - phones off!
6

Final Emphasis

  • covers entire course
  • includes material from

midterm

  • transformations
  • viewing
  • more than half of exam

will be on material not covered in midterm

  • color
  • rasterization
  • lighting/shading
  • advanced rendering
  • clipping
  • hidden surfaces
  • blending
  • textures
  • procedural

approaches

  • picking
  • collision
  • antialiasing
  • modern hardware
  • curves
  • visualization
7

Exam Prep

  • another sample final just posted
  • from Jan 2007
  • homeworks are good practice
  • especially old homeworks from when I taught

the course

8

Grading Reminder

  • Original grading scheme for course
  • 20% midterm and 25% final
  • New grading scheme for course
  • 12% midterm and 33% final
  • Your course grade will automatically be the

max of new and old schemes.

9

Correction: Premultiplying Colors

  • specify opacity with alpha channel: (r,g,b,α)
  • α=1: opaque, α=.5: translucent, α=0: transparent
  • A over B
  • C = αA + (1-α)B
  • but what if B is also partially transparent?
  • C = αA + (1-α) βB = βB + αA + βB - α βB
  • γ = β + (1-β)α = β + α – αβ
  • 3 multiplies, different equations for alpha vs. RGB
  • premultiplying by alpha
  • C’ = γ C, B’ = βB, A’ = αA
  • C’ = B’ + A’ - αB’
  • γ = β + α – αβ
  • 1 multiply to find C, same equations for alpha and RGB

week9.day3, slide 8

10

Clarification: Midpoint Check

  • f(x,y) = (y0- y1) x + (x1- x0) y + x0 y1+x1 y0
  • implicit equation: on line when f(x,y) = 0
  • above line when f(x,y) < 0
  • below line when f(x,y) > 0
  • check midpoint against line
  • midpoint to check is at x+1, y+.5
  • if f(x+1, y+5) < 0 then midpoint is below line

y=y0 for (x=x0; x <= x1; x++) { draw(x,y); if (f(x+1, y+.5) < 0) then { y = y + 1; } week6.day1, slide 29.5

11

Clarification: Making It Incremental

  • d: midpoint. build off previous computation
  • if we stayed at same level, midpoint above line (d<0)
  • new midpoint check to set up is f(x+1, y) = f(x,y) + (y0-y1)
  • if we moved up one level, midpoint below line (d>0)
  • new midpoint check set up is f(x+1, y+1) = f(x,y) + (y0- y1) + (x1- x0)

y=y0 d = f(x0+1, y0+.5) for (x=x0; x <= x1; x++) { draw(x,y); if (d<0) then { y = y + 1; d = d + (x1 - x0) + (y0 - y1) } else { d = d + (y0 - y1) } midpoint above: bottom pixel midpoint below: top pixel week6.day1, slide 30

12

y=y0 d = f(x0+1, y0+.5) for (x=x0; x <= x1; x++) { draw(x,y); if (d<0) then { y = y + 1; d = d + (x1 - x0) + (y0 - y1) } else { d = d + (y0 - y1) } y=y0 2 d = 2*(y0-y1)(x0+1) + (x1-x0)(2*y0+1) + 2*x0y1 - 2*x1y0 for (x=x0; x <= x1; x++) { draw(x,y); if (d<0) then { y = y + 1; d = d + 2(x1 - x0) + 2(y0 - y1) } else { d = d + 2(y0 - y1) }

Clarification/Correction: Integer Only

  • avoid dealing with non-integer values by doubling both sides
  • from f(x,y) = 0 to 2f(x,y) = 0
  • f(x,y) = (y0- y1) x + (x1- x0) y + x0 y1+x1 y0

week6.day1, slide 31

13

Evaluations - Right Now

  • official TA evaluations
  • still on paper, not online yet
  • unofficial course evaluations - my custom form
  • much more specific questions than the official ones
  • I do not look at these until after official ones returned, long

after grades are out

  • if you missed class, blanks will be in extra handouts container

in lab, can turn in anonymously to the front desk on 2nd floor

  • your feedback helps me improve the course in later years
  • please also fill out official teaching surveys for instructor

(me!) at the CoursEval website https://eval.olt.ubc.ca/science

14

Classify Shade Interpolate Composite

Review: Direct Volume Rendering

15 Semiology of Graphics. Jacques Bertin, Gauthier-Villars 1967, EHESS 1998

position size grey level texture color shape

  • rientation

points lines areas marks: geometric primitives attributes

Review: Visual Encoding

  • attributes
  • parameters

control mark appearance

  • separable

channels flowing from retina to brain
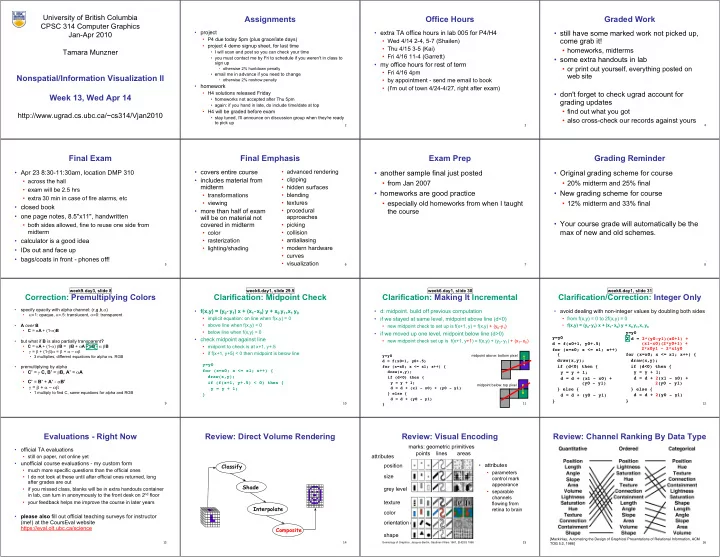
16

Review: Channel Ranking By Data Type

[Mackinlay, Automating the Design of Graphical Presentations of Relational Information, ACM TOG 5:2, 1986]
slide-2
SLIDE 2 17

Review: Integral vs. Separable Channels

  • not all channels separable
[Colin Ware, Information Visualization: Perception for Design. Morgan Kaufmann 1999.]

color location color motion color shape size

  • rientation

x-size y-size red-green yellow-blue

18

Review: Preattentive Visual Channels

  • color alone, shape alone: preattentive
  • combined color and shape: requires attention
  • search speed linear with distractor count
[Christopher Healey, [www.csc.ncsu.edu/faculty/healey/PP/PP.html] 19

Nonspatial/Information Visualization II

20

3D vs 2D Representations

  • curve comparison difficult: perspective distortion, occlusion
  • dataset is abstract, not inherently spatial
  • after data transformation to clusters, linked 2D views of

representative curves show more

[van Wijk and van Selow, Cluster and Calendar based Visualization of Time Series Data, InfoVis99 21

Space vs Time: Showing Change

  • animation: show time using temporal change
  • good: show process
  • good: flip between two things
  • bad: flip between between many things
  • interference between intermediate frames
[Outside In excerpt. www.geom.uiuc.edu/docs/outreach/oi/evert.mpg] [www.astroshow.com/ccdpho/pluto.gif] [Edward Tufte. The Visual Display of Quantitative Information, p 172] 22

Space vs Time: Showing Change

  • small multiples: show time using space
  • overview: show each time step in array
  • compare: side by side easier than temporal
  • external cognition vs internal memory
  • general technique, not just for temporal changes
[Edward Tufte. The Visual Display of Quantitative Information, p 172] 23

Composite Views

  • pixel-oriented views
  • overviews with high

information density

  • superimposing/layering
  • shared coordinate frame
  • redundant visual

encoding

[Jones, Harrold, and Stasko. Visualization of Test Information to Assist Fault Localization.
  • Proc. ICSE 2002, p 467-477.]
[Munzner. Interactive Visualization of Large Graphs and Networks. Stanford CS, 2000] 24

Composite Views: Glyphs

  • internal structure where subregions have different

visual channel encodings

[Ward. A Taxonomy of Glyph Placement Strategies for Multidimensional Data Visualization. Information Visualization Journal 1:3-4 (2002), 194--210.] [Smith, Grinstein, and Bergeron. Interactive data exploration with a
  • supercomputer. Proc. IEEE Visualization, p 248-254, 1991.]
25

Adjacent: Multiple Views

  • different visual encodings show different aspects of the data
  • linked highlighting to show where contiguous in one view

distributed within another

[Weaver. http://www.personal.psu.edu/cew15/improvise/examples/census] 26

Adjacent Views

  • overview and detail
  • same visual encoding, different resolutions
  • small multiples
  • same visual encoding, different data
27

Data Reduction

  • overviews as aggregation
  • focus+context
  • show details embedded within context
  • distortion: TreeJuxtaposer video
  • filtering: SpaceTree demo
[Munzner et al. TreeJuxtaposer: Scalable Tree Comparison using Focus+Context with Guaranteed Visibility. Proc SIGGRAPH 2003, p 453-462] [Plaisant, Grosjean, and Bederson. SpaceTree: Supporting Exploration in Large Node Link Tree, Design Evolution and Empirical Evaluation. Proc. InfoVis 2002 2828

Dimensionality Reduction

  • mapping from high-dimensional space into space of

fewer dimensions

  • generate new synthetic dimensions
  • why is lower-dimensional approximation useful?
  • assume true/intrinsic dimensionality of dataset is

(much) lower than measured dimensionality!

  • only indirect measurement possible?
  • fisheries: want spawn rates.

have water color, air temp, catch rates...

  • sparse data in verbose space?
  • documents: word occurrence vectors.

10K+ dimensions, want dozens of topic clusters

29

finger extension wrist rotation

[A Global Geometric Framework for Nonlinear Dimensionality Reduction. Tenenbaum, de Silva and Langford. Science 290 (5500): 2319-2323, 2000, isomap.stanford.edu]

DR Example: Image Database

  • 4096 D (pixels) to 2D (hand gesture)
  • no semantics of new synthetic dimensions from alg.
  • assigned by humans after inspecting results
30

DR Technique: MDS

  • multidimensional scaling
  • minimize differences between interpoint distances in

high and low dimensions

  • minimize objective function: stress

D: matrix of lowD distances Δ: matrix of hiD distances

  • Glimmer: MDS on the GPU
[Ingram, Munzner, Olano. Glimmer: Multiscale MDS on the GPU. IEEE TVCG 15(2):249-261, 2009. 31

Parallel Coordinates

  • only two orthogonal axes in the plane
  • instead, use parallel axes!
[Hyperdimensional Data Analysis Using Parallel Coordinates. Edward J. Wegman. Journal of the American Statistical Association, Vol. 85, No. 411. (Sep., 1990), pp. 664-675.] 32

Parallel Coordinates

  • point in Cartesian coords is line in par coords
  • point in par coords is line in Cartesian n-space
[Inselberg and Dimdale. Parallel Coordinates: A Tool for Visualizing Multi-Dimensional
  • Geometry. IEEE Visualization '90.]
slide-3
SLIDE 3 33

Par Coords: Correllation

[Hyperdimensional Data Analysis Using Parallel Coordinates. Wegman. Journal of the American Statistical Association, Vol. 85, No. 411. (Sep., 1990), pp. 664-675.] 34

Hierarchical Parallel Coords: LOD

[Hierarchical Parallel Coordinates for Visualizing Large Multivariate Data Sets. Fua, Ward, and Rundensteiner. IEEE Visualization '99.] 35

Node-Link Graph Layout

  • minimize
  • crossings, area, bends/curves
  • maximize
  • angular resolution, symmetry
  • most criteria individually NP-hard
  • cannot just compute optimal

answer

  • heuristics: try to find something

reasonable

  • criteria mutually incompatible
36

Force-Directed Placement

  • nodes: repel like magnets
  • edges: attract like springs
  • start from random positions,

run to convergence

  • very well studied area!
  • many people reinvent the

wheel

[www.csse.monash.edu.au/~berndm/CSE460/Lectures/cse460-7.pdf] 37

Interactive Graph Exploration

  • geometric and semantic fisheye
van Ham and van Wijk. Interactive Visualization of Small World Graphs. Proc. InfoVis 2005 38

Treemaps

  • containment rather than connection
  • emphasize node attributes, not topological

structure

[van Wijk and van de Wetering. Cushion Treemaps. Proc InfoVis 1999] [Fekete and Plaisant. Interactive Information Visualization of a Million Items. Proc InfoVis 2002. 39

Cushion Treemaps

  • show structure with shading
  • single parameter controls global vs local view
[van Wijk and van de Wetering. Cushion Treemaps. Proc InfoVis 1999] 40

Now What?

41

Beyond 314: Other Graphics Courses

  • 424: Geometric Modelling
  • will be offered next year
  • 426: Computer Animation
  • was offered this year
  • 514: Image-Based Rendering - Heidrich
  • 526: Algorithmic Animation - van de Panne
  • 533A: Digital Geometry - Sheffer
  • 533B: Animation Physics - Bridson
  • 533C: Information Visualization - Munzner
42

Beyond UBC CS

  • SIGGRAPH conference in Vancouver next

year!

  • August 7 - August 11 2011
  • ~20K people: incredible combination of

research, entertainment, art

  • Electronic Theater, Exhibit, ETech, ...
  • pricey: but student rate, student volunteer

program

  • local SIGGRAPH chapter
  • talk series, SPARK FX festival, ...
  • http://siggraph.ca