
SLIDE 1
9/28/2017 1
Assessment of the Estimated Non- Point Source Nitrogen and Phosphorus Loading from Agricultural Sources from Iowa During the 1980-96 Hypoxia Task Force Baseline Period
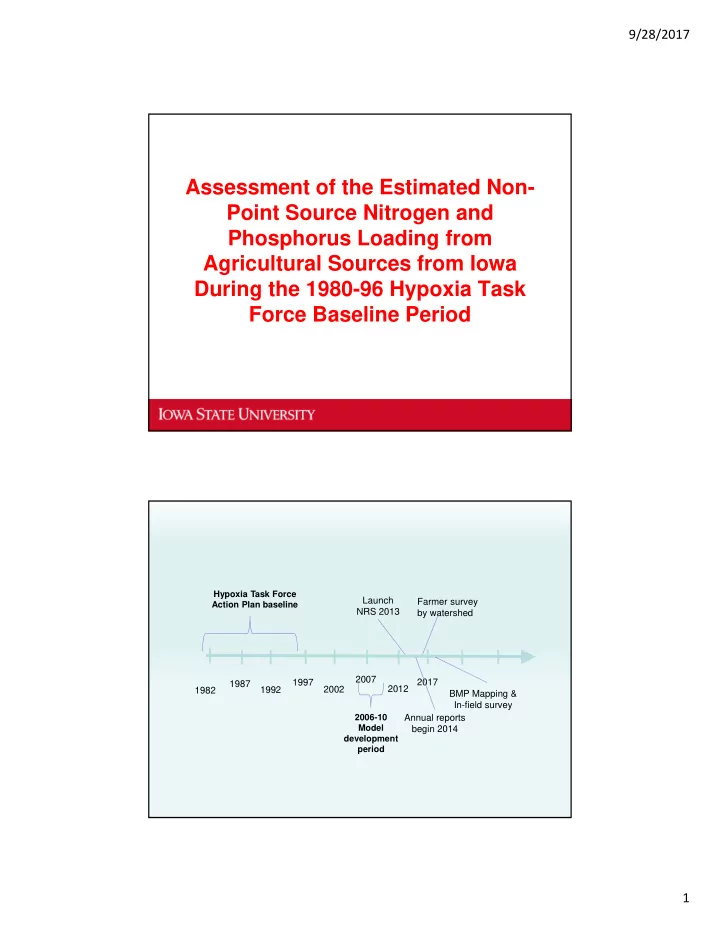
2006-10 Model development period 1982 1987 1992 1997 2002 Hypoxia Task Force Action Plan baseline 2012 2017 2007 Launch NRS 2013 Annual reports begin 2014 Farmer survey by watershed BMP Mapping & In-field survey