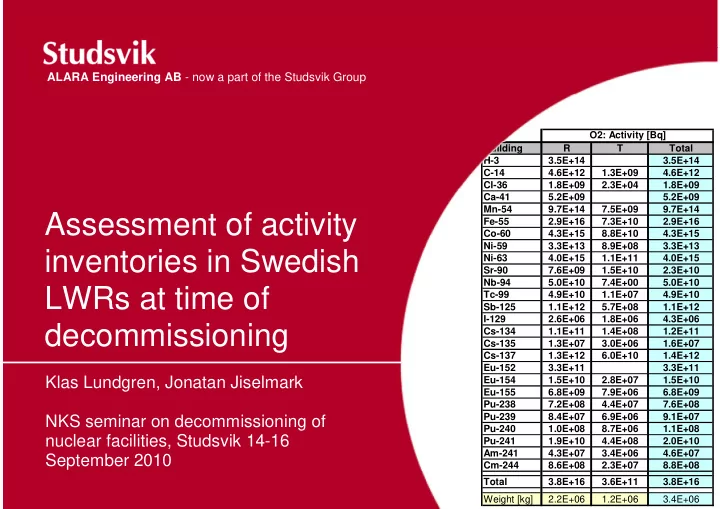

Building R T Total H-3 3.5E+14 3.5E+14 C-14 4.6E+12 1.3E+09 4.6E+12 Cl-36 1.8E+09 2.3E+04 1.8E+09 Ca-41 5.2E+09 5.2E+09 Mn-54 9.7E+14 7.5E+09 9.7E+14 Fe-55 2.9E+16 7.3E+10 2.9E+16 Co-60 4.3E+15 8.8E+10 4.3E+15 Ni-59 3.3E+13 8.9E+08 3.3E+13 Ni-63 4.0E+15 1.1E+11 4.0E+15 Sr-90 7.6E+09 1.5E+10 2.3E+10 Nb-94 5.0E+10 7.4E+00 5.0E+10 Tc-99 4.9E+10 1.1E+07 4.9E+10 Sb-125 1.1E+12 5.7E+08 1.1E+12 I-129 2.6E+06 1.8E+06 4.3E+06 Cs-134 1.1E+11 1.4E+08 1.2E+11 Cs-135 1.3E+07 3.0E+06 1.6E+07 Cs-137 1.3E+12 6.0E+10 1.4E+12 Eu-152 3.3E+11 3.3E+11 Eu-154 1.5E+10 2.8E+07 1.5E+10 Eu-155 6.8E+09 7.9E+06 6.8E+09 Pu-238 7.2E+08 4.4E+07 7.6E+08 Pu-239 8.4E+07 6.9E+06 9.1E+07 Pu-240 1.0E+08 8.7E+06 1.1E+08 Pu-241 1.9E+10 4.4E+08 2.0E+10 Am-241 4.3E+07 3.4E+06 4.6E+07 Cm-244 8.6E+08 2.3E+07 8.8E+08 Total 3.8E+16 3.6E+11 3.8E+16 Weight [kg] 2.2E+06 1.2E+06 3.4E+06 O2: Activity [Bq]
Assessment of activity inventories in Swedish LWRs at time of decommissioning
Klas Lundgren, Jonatan Jiselmark NKS seminar on decommissioning of nuclear facilities, Studsvik 14-16 September 2010
ALARA Engineering AB - now a part of the Studsvik Group