Assessing the contribution of the deinstitutionalization of the - - PDF document

assessing the contribution of the deinstitutionalization
SMART_READER_LITE
LIVE PREVIEW

Assessing the contribution of the deinstitutionalization of the - - PDF document

9/26/2016 Assessing the contribution of the deinstitutionalization of the mentally ill to growth in the U.S. incarceration rate Steven Raphael Goldman School of Public Policy UC Berkeley Michael A Stoll School of Public Affairs UCLA


slide-1
SLIDE 1

9/26/2016 1

Assessing the contribution of the deinstitutionalization of the mentally ill to growth in the U.S. incarceration rate

Steven Raphael Goldman School of Public Policy UC Berkeley Michael A Stoll School of Public Affairs UCLA

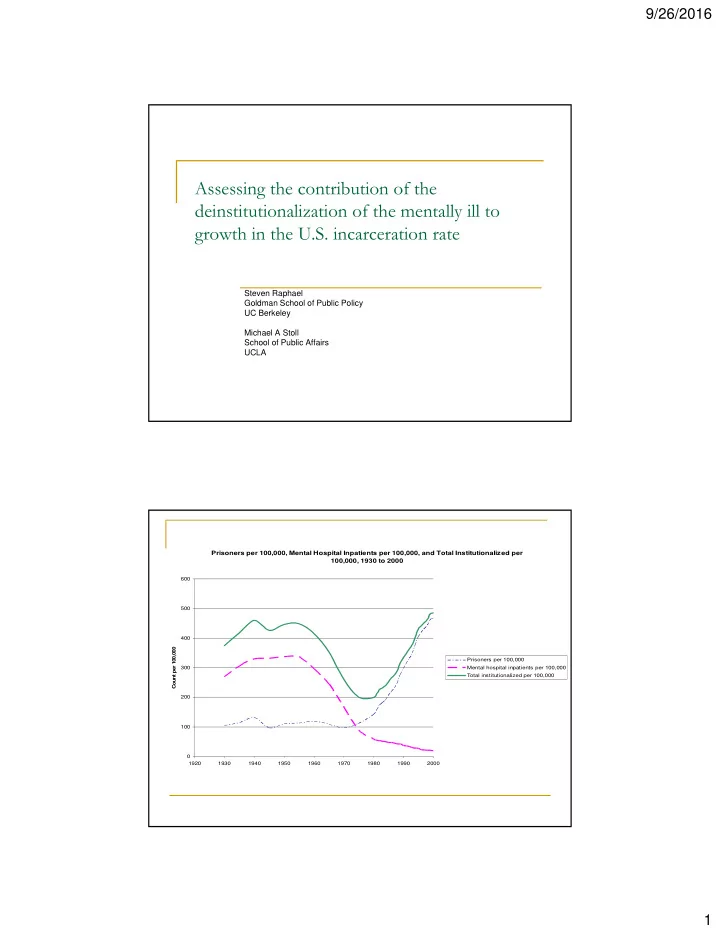
Prisoners per 100,000, Mental Hospital Inpatients per 100,000, and Total Institutionalized per 100,000, 1930 to 2000

100 200 300 400 500 600 1920 1930 1940 1950 1960 1970 1980 1990 2000 C

  • unt per 100,000

Prisoners per 100,000 Mental hospital inpatients per 100,000 Total institutionalized per 100,000

slide-2
SLIDE 2

9/26/2016 2

Putting an upper bound on the possible contribution of deinstitutionalization to prison and jail growth

 Characteristics of the mental hospital population at the

peak are quite different from those of the incarcerated population then and now.

 Deinstitutionalization appeared to follow a

chronologically selective path, suggesting larger potential impact of latter phases on incarceration

 Tabulating an upper bound accounting for differences in

demographic composition and the misalignment in timing

slide-3
SLIDE 3

9/26/2016 3

Two questions with answers that illustrate the compositional differences between the institutionalized populations in 1950 and 2000

 How has the overall institutionalization risk (mental

hospitals or jail/prison) for those institutionalized in 2000 changed since 1950?

 How did the overall institutionalization risk for those

institutionalized in 1950 change through the end of the century?

Institutionalization Rates for Adults 18 to 64 Years of Age Between 1950 and 2000, Actual Rates, Rates Weighted by the 1950 Distribution of Mental Hospital Patients, and Rates Weighted by the 2000 Distribution of Institutionalized Adults

500 1000 1500 2000 2500 3000 3500 4000 4500 5000 1950 1960 1970 1980 1990 2000 Institutionalized per 100,000 Overall institutionalization rate Weighted by 1950 mental hospital patients Weighted by 2000 institutionalized population

slide-4
SLIDE 4

9/26/2016 4

Comparing the demographics of deinstitutionalization and prison growth between 1980 and 2000

 92 % of incarceration growth between 1950 and 2000

  • ccurs after 1980

 Remaining 8 % occurs during the latter half of the 1970s  Measuring deinstitutionalization post-1980 with census

data

 Assume complete deinstitutionalization by 2000 Comparison of the Change in Institutionalization Rates (2000 Institutionalization Minus 1980 Incarceration) to the Mental Hospital Inpatient Rate as of 1980, Black Males

214 488 369 407 382 243 244 329 6794 7936 8776 7278 5790 4378 2795 2124 1000 2000 3000 4000 5000 6000 7000 8000 9000 10000 18 to 25 26 to 30 31 to 35 36 to 40 41 to 45 46 to 50 51 to 55 56 to 64 Rate of Change in Rate per 100,000 Inpatient rate 1980 Change in institutionalization rate

slide-5
SLIDE 5

9/26/2016 5

Bounding the contribution of deinstitutionalization to incarceration growth between 1980 and 2000

 Calculate what the incarceration what would have been

in 2000 for demographic subgroups (defined by race, gender, and age) assuming

 Complete deinstitutionalization between 1980 and 2000  Specific trans-institutionalization rates (one-for-one, one-for-one

half, one-for-one quarter)

 Use 2000 population shares to generate overall

counterfactual incarceration rate

Actual Incarceration and Institutionalization Rate in 1980 and 2000 and Hypothetical Institutionalization Rates for 2000 Assuming Alternative Trans-institutionalization Parameters

326 1309 1180 1244 1277 200 400 600 800 1000 1200 1400 1980 Incarceration Rate 2000 Institutionalization Rate 2000 hypothetical assuming transfer rate of 1 2000 hypothetical assuming transfer rate of 0.5 2000 hypothetical assuming transfer rate of 0.25 Institutionalized/Incarcerated per 100,000

slide-6
SLIDE 6

9/26/2016 6

Summary

 No more than 13 percent of incarceration growth since

1980 can be attributed to deinstitutionalization.

 Deinstitutionalization may be responsible for a relatively

large proportion of the severely mentally ill population in prisons and jails.

 For 2000, our prevalence estimates for severe mental illness

combined with correctional population totals for that year imply that there are 277,000 severely mentally ill inmates.

 The bounding exercise gives an upper bound contribution of

deinstitutionalization of 144,000.

Estimating the transfer rate from mental hospitalization to incarceration

 Impact of deinstitutionalization on prison growth likely to

be heterogeneous

 Deinstitutionalization has pursued a chronologically-selective

path

 Incarceration risk during the 1980s and 1990s is relatively high

due to changes in sentencing policy (Raphael and Stoll 2009)

 Causality may run in the opposite direction due to

 State budget constraints (Ellwood and Geutzkow 2009)  Policy changes increasing the competing risk of incarceration

may divert some from state mental health systems.

slide-7
SLIDE 7

9/26/2016 7

Estimates of trans-institutionalization rates for 1950 through 1980

Use data from the one percent PUMS files for 1950, 1960, 1970, and 1980

Construct a panel data set varying by year, state of residence, race, gender, and age.

Estimate the model

tsgra tsgra g sga sgr tsg tsgra

ation hospitaliz ion Incarcerat            

slide-8
SLIDE 8

9/26/2016 8

Estimates of trans-institutionalization rates for 1980 through 2000

Use data from the 5 percent PUMS files for 1980 and 2000

Cannot separately identify mental hospital inpatients from prison and jail inmates among those in institutionalized group quarters post 1980.

By 2000, mental hospital population is trivially small compared to the population of prison and jail inmates (60,000 vs. 2,000,000)

Use negative one times 1980 hospitalization rate as a proxy for deinstitutionalization over this period.

Use overall-institutionalization rate in 2000 minus 1980 incarceration rate as a proxy for the change in incarceration

gsra gsra g gsa gsr gsra

ation hospitaliz ion Incarcerat          1980 _

slide-9
SLIDE 9

9/26/2016 9

Bottom line

 Using trans-institutionalization estimates when data are

pooled by gender, our estimates suggest that roughly 4 percent of incarceration growth between 1980 and 2000 is of mentally ill individuals who in past years who have been hospitalized.

 Using race specific results raises this estimate to 7 percent.

 In terms of bodies, the estimates suggest a range of

40,000 to 72,000 additional inmates who would have been inpatients.

 14 to 26 percent of the incarcerated severely mentally ill

population.