
SLIDE 1
Arterial Lines Helping to prevent a stab in the dark Reasons for - - PowerPoint PPT Presentation
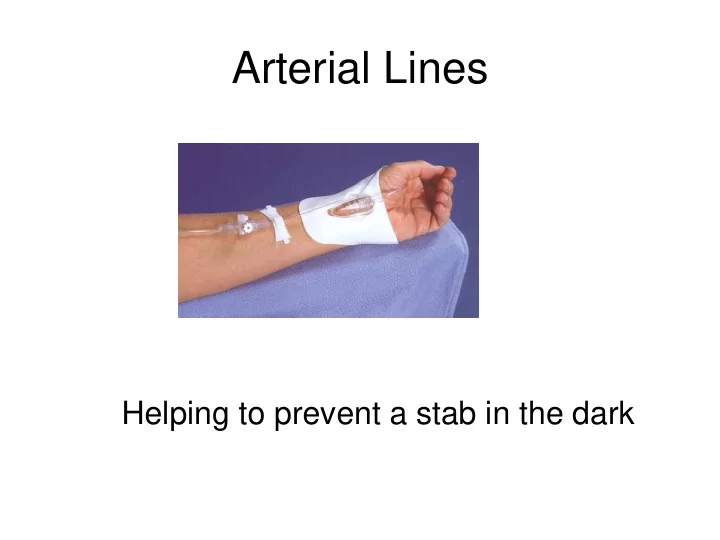
Arterial Lines Helping to prevent a stab in the dark Reasons for arterial line insertion Repeated blood gases required Ventilated patients Respiratory failure Recognised acid base imbalance Continuous blood pressure monitoring
– Advantages:
– Easy access – Easy to identify – Easy to insert catheter – Minimal immobilisation of site – More comfortable than other sites
– Disadvantages:
– Thin catheter causing predisposition to overshoot artifact – Peripheral access Increase risk of Harmonic amplification – Vaso-reactive
patient/person is asked to make a fist for about 30 seconds.
and the radial arteries so as to
(pallor can be observed at the finger nails).
colour should return in 7 seconds.
the Allen's test is considered to be "positive." If color fails to return, the test is considered "negative" and the ulnar artery supply to the hand is not
cannot be safely pricked/cannulated.
– Sterile dressing pack – Sterile gloves – Chlorhexidine swab – Local anaesthetic – Inco sheet – Catheter set – Pressure tubing – Pressure bag – IV solution
Phleobostatic point
Peak systolic pressure (PSP) Reflects maximum left ventricular pressure Sharp uprise = Ouflow of blood from the ventricle and into the arterial system Dicrotic Notch Pressure in Aorta > Pressure in left ventricle => Close of the aortic valve Marks the end of the systole and beginning
Diastolic Pressure (DP) Heart is at its relaxation phase. Filling of the left ventricle.
small overshoot
baseline
bounces
height of 1st
June 2002
June 2002
– Occluded line – Low pressure in bag – Innappropriate scale on monitor – Air in transducer tubing
– Hypovolaemia – Vasodilatation – Cardiogenic shock
June 2002
– Overly wide pipes
– Leaky pipes
– Sticky blocked pipes
– A sad pump
Alpha effects – Vessel tone (vasoactive pressors) Beta 1 effects – Cardiac contractility (inotropic) – Heart rate (chronotropic) Beta 2 effects – Broncho dilation – Vasodilation
Heart Rate/Stroke Volume Blood Pressure Pre Load
Afterload Contractility
Cardiac Output
36
38
39
40
2 types of acids produced
– CO2 -able to cross alveolar capillary membrane and can be regulated primarily by respiration
– are regulated by the kidneys because they can only be excreted in solution
41
* Rapid response * Delayed response
42
7.35 - 7.45
80 - 100 mmHg
35 - 45 mmHg
22 - 26 m Eq/litre
95 or greater
43
44
pH PaCO2 HCO3 Is the value normal Is it an acid or Is it a base Eg pH 7.2 PaCO2 50 HCO3 33
45
pH 7.2 acid PaCO2 50 acid HCO3 33 base
Look at pH to determine the nature of the imbalance acidosis or alkalosis pH 7.20 acid (acidosis) eg
pH 7.44 pH 7.18
46
determine imbalance - acidosis or alkalosis
pH 7.2 acid (acidosis) PaCO2 50 acid HCO3 33 base
now determine if the problem is respiratory or metabolic by looking at value with same status as pH
respiratory
metabolic
47
Step 1
Consider each value independently
Step 2
Look at pH to determine the nature of the imbalance – is it acidosis or alkalosis
Step 3
Determine if the problem respiratory or metabolic – which value matches the pH examples pH 7.18 pH 6.85 pH 7.56 PaCO2 65 PaCO2 26 PaCO2 22 HCO3 24 HCO3 8 HCO3 25
48
Determine level of compensation is compensation absent, partial or complete? pH
7.2 acid PaCO2 50 acid HCO3 33 base Do this by looking at the value that does not match the pH Is this within normal limits?
no compensation has occurred
49
now determine if compensation is partial or complete
pH 7.2 base PaCO2 50 acid HCO3 33 base Partial
pH is also outside normal limits then partial compensation has occurred
Complete
pH has returned to normal limits then complete compensation has
50
pH 7.18 acid PaCO2 65 acid HCO3 24 normal pH 6.85 acid PaCO2 29 base HCO3 8 acid pH 7.45 base PaCO2 50 acid HCO3 33 base
ABG result pH 7.3 PaCO2 26 mmHg PaO2 75 mmHg HCO3 18 mmol/L SaO2 92% Lactate 2.4 Your interpretation -
Heart Rate/Stroke Volume Blood Pressure Pre Load
Afterload Contractility
Cardiac Output
ABG result pH 7.2 PaCO2 26 mmHg PaO2 100 mmHg HCO3 16 mmol/L SaO2 97% Lactate 4.3 Your interpretation -
Heart Rate/Stroke Volume Blood Pressure Pre Load
Afterload Contractility
Cardiac Output
ABG result pH 7.15 PaCO2 80 mmHg PaO2 65 mmHg HCO3 30 mmol/L SaO2 86% Your interpretation – Ideal mangement
Heart Rate/Stroke Volume Blood Pressure Pre Load
Afterload Contractility
Cardiac Output
64
Case 1 A 10 year old boy arrives Hx increasing SOB over last week, now feverish and has moist unproductive cough Vital signs
Temp 39o C HR 120 BP 90/60 RR 46 SpO2 93% on 10 L oxygen via non-rebreather mask Impression – possible pneumonia
65
ABG result pH 7.47 PaCO2 26 mmHg PaO2 55 mmHg HCO3 20 mmol/L SaO2 90% Your interpretation -
66
A 12 year old girl is admitted with drowsiness and abdo pain
ABG on air pH 6.9 PaCO2 17 mmHg PaO2 92 mmHg HCO3 12 mmol/L SaO2 96% Interpretation -
67
An unconscious 30 year old with tricyclic OD responding
ABG 30 mins after intubation pH 7.1 PaCO2 47 mmHg PaO2 360 mmHg HCO3 18 mmol/L SaO2 100% your interpretation -
68
An unconscious 43 year old post head trauma and responding only to pain is admitted, intubated & ventilated in ED
ABG 30 mins after intubation pH 7.50 PaCO2 22 mmHg PaO2 560 mmHg HCO3 25 mmol/L SaO2 100% your interpretation -
69
A 6 year old girl involved in an MVA is brought in unconscious, she is intubated, her cardiac rhythm and absence of pulse indicates PEA and CPR is in progress. Initial ABG pH 7.1 PaCO2 10 mmHg PaO2 34 mmHg HCO3 18 mmol/L SaO2 67% Your interpretation -
70
A 75 year old woman wpost op from repair of a # left tib and fib requiring regular morphine has become increasingly drowsy
71
11 year old with paralytic ileus 3 days post appendectomy. Nasogastric tube insitu with large outputs.
ABG