SLIDE 1
Approach
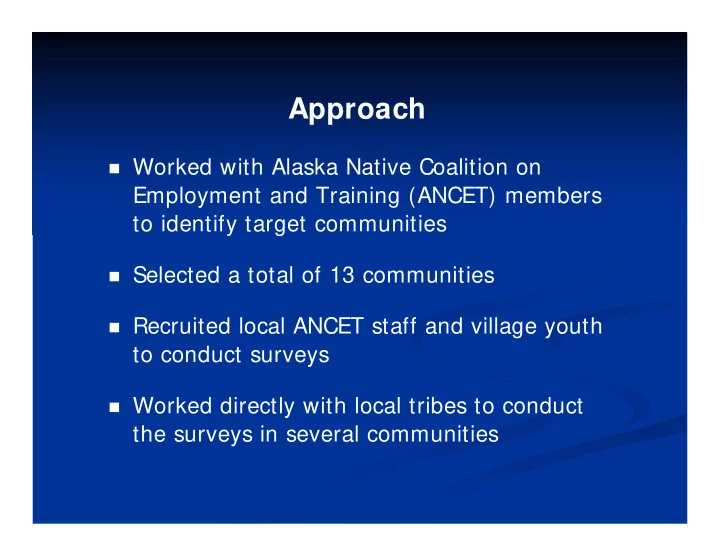
Worked with Alaska Native Coalition on
Employment and Training (ANCET) members to identify target communities
Selected a total of 13 communities Recruited local ANCET staff and village youth
to conduct surveys
Worked directly with local tribes to conduct
the surveys in several communities
SLIDE 2
Alaska Communities Participating in WRAP Survey
ARCTI C VI LLAGE NORTHWAY MI NTO HUSLI A BUCKLAND STEBBI NS KONGI GANAK DI LLI NGHAM BETHEL SI TKA KLAWOCK SAND POI NT PORT GRAHAM
SLIDE 3
Approach (continued)
Sent letter to tribal council explaining study Set up contracts with ANCET members Conducted residential surveys (home interviews) Conducted non-residential surveys Computed community specific emissions Report results to tribal councils Extrapolate results to rest of communities
SLIDE 4 Arctic Village Survey
Contracted with TCC to manage data collection;
Nena John was hired to conduct the surveys.
Collected data from 30-31 homes on summer
and winter activities, including:
- heating
- transportation
- equipment
- outdoor burning
Data was also collected for the following fuels:
- wood (cords)
- fuel oil (gallons)
- propane (gallons)
- other (please specify)
SLIDE 5 Arctic Village Survey (continued)
Nonresidential activity and fuel use data were
collected for the following facilities:
- Arctic Village Electric Company
- Arctic Village Health Clinic
- Fuel Supplier
- Landfill
Because responses to the non-residential
surveys were limited, activity and fuel use for the facilities were estimated using survey data from Port Graham and other sources for the following:
SLIDE 6 Arctic Village Survey (continued)
- Arctic Village Airport (ARC) emissions derived
from WRAP 2002 Alaska Aviation Emission Inventory.
- Arctic Village Electric Company fuel use was
estimated from Port Graham after adjusting for population.
- Amount of refuse generated and burned in landfill
was based on Port Graham estimate of 104.5 lbs per person per month.
- Nonroad equipment activity at landfill were
derived from equipment use for Port Graham landfill.
SLIDE 7
Summary
Wood burning and gasoline are responsible for
most of the air pollution in Arctic Village
Wood burning is of particular concern as it is
the dominant source of Particulates
Particulates are known to be a toxic air
pollutant
People should be educated to avoid wood
smoke when possible
Gasoline emissions can be minimized by
keeping vehicles and equipment in good repair
SLIDE 8 Bethel Survey
Contracted with ONC (Rose Kalistook) to
conduct the surveys
Collected data from 62-63 homes on summer
and winter activities, including:
- heating
- transportation
- equipment
- outdoor burning
Data was also collected for the following fuels:
- wood (cords)
- fuel oil (gallons)
- propane (gallons)
- other (please specify)
SLIDE 9 Bethel Survey (continued)
Non-residential emissions and fuel use were
derived as follows:
- Arthur Dale Lake Airport, Bethel Airport, Bethel
Seaplane Base, and Hangar Lake Seaplane Base emissions were derived from WRAP 2002 Alaska Aviation Emission Inventory.
- Bethel Utilities Corporation Diesel fuel use
(3,134,918 gal/year) was derived from the 2005 Power Cost Equalization (PCE) report and total annual emissions were derived from DEC Major Point Source data.
SLIDE 10 Bethel Survey (continued)
- Port commercial marine vessel emissions were
estimated from Kodiak vessel emissions from 2004 after adjusting for population, local fishing vessel registration data, and local seasonal activity.
- Emissions and fuel use for the following facilities
were based on facility-specific seasonal estimates for Dillingham adjusted using local population:
City Operations Landfill Wastewater Treatment Facility Bethel Schools Yukon-Kuskokwim Delta Regional Hospital
SLIDE 11
Summary
Wood burning and gasoline are responsible for
most of the air pollution in Bethel
Information on options to improve wood stove
efficiency and reduce smoke are available and should be presented to the public
Particulates are known to be a toxic air
pollutant
Gasoline emissions can be minimized by
keeping vehicles and equipment in good repair
SLIDE 12 Buckland Survey
Hired Natalie Hadley to conduct the surveys Collected data from 30 homes on summer and
winter activities, including:
- heating
- transportation
- equipment
- outdoor burning
Data was also collected for the following fuesl:
- wood (cords)
- fuel oil (gallons)
- propane (gallons)
- other (please specify)
SLIDE 13 Buckland Survey (continued)
Only responses to the non-residential survey were from
the City of Buckland and the IRA.
City of Buckland Diesel fuel use for power generation
(112,719 gal/year) was derived from the 2005 Power Cost Equalization (PCE) report and was assumed to be used uniformly throughout the year.
Buckland Airport (BVK) emissions were derived from
WRAP 2002 Alaska Aviation Emission Inventory.
SLIDE 14 I ssues To Be Considered
Questionnaires were often only partially completed, as a
result:
- When questions were left unanswered, activity and fuel
use was assumed to be zero
- Emission and fuel use estimates may understate
community totals
- Fuel use in electricity generation was assumed to be
uniform throughout the year (50% summer and 50% winter)
Responses to the non-residential surveys were only received
from the City of Buckland and the IRA.
The surveys indicated camp fuel use during the winter – is
this reasonable?
SLIDE 15
Summary
Wood burning and gasoline are responsible for
most of the air pollution in Buckland
Wood burning is of particular concern as it is
the dominant source of Particulates
Particulates are known to be a toxic air
pollutant
People should be educated to avoid wood
smoke when possible
Gasoline emissions can be minimized by
keeping vehicles and equipment in good repair
SLIDE 16 Dillingham Survey
Contracted with BBNC (Cathy Reamey) to
conduct the surveys
Collected data from 30-35 homes on summer
and winter activities, including:
- heating
- transportation
- equipment
- outdoor burning
Data was also collected for the following fuels:
- wood (cords)
- fuel oil (gallons)
- propane (gallons)
- other (please specify)
SLIDE 17 Dillingham Survey (continued)
Responses to non-residential surveys were only
received from the following facilities:
- City Operations
- Landfill
- Wastewater Treatment Facility
The responses for these facilities only addressed
summer operation. Estimates of winter activity were derived from seasonal trends in Port Graham.
Dillingham Airport, Nushagak Airport and Shannon’s
Pond Seaplane Base emissions were derived from WRAP 2002 Alaska Aviation Emission Inventory.
SLIDE 18
Dillingham Survey (continued)
Nushagak Electric Cooperative Diesel fuel use
was derived from the 2005 Power Cost Equalization (PCE) report.
Commercial marine vessel emissions were
estimated from Kodiak after adjusting community population, local fishing vessel registration data, and local seasonal activity.
Dillingham City Schools and Kanakanak Hospital
emissions and fuel use were estimated from similar facilities in Port Graham after adjusting population differences.
SLIDE 19
Summary
Wood burning and gasoline are responsible for
most of the air pollution in Dillingham
Information on options to improve wood stove
efficiency and reduce smoke are available and should be presented to the public
Particulates are known to be a toxic air
pollutant
Gasoline emissions can be minimized by
keeping vehicles and equipment in good repair
SLIDE 20 Huslia Survey
Contracted with TCC to manage data collection;
Sheila Esmailka was hired to conduct the surveys
Collected data from 26-30 homes on summer
and winter activities, including:
- heating
- transportation
- equipment
- outdoor burning
Data was also collected for the following fuels:
- wood (cords)
- fuel oil (gallons)
- propane (gallons)
- other (please specify)
SLIDE 21 Huslia Survey (continued)
Responses to the non-residential surveys were
received for the following facilities:
- Jimmy Huntington School
- Huslia Health Clinic
- Wastewater Treatment Facility
- Huslia City Operations
- Landfill
Responses provided information on both
summer and winter activities.
Huslia Airport (HLA) emissions derived from
WRAP 2002 Alaska Aviation Emission Inventory.
SLIDE 22
Huslia Survey (continued)
Electric Utility (Alaska Village Electric Cooperative)
fuel use estimates derived from 2005 Power Cost Equalization (PCE) data.
Commercial operations in the river are limited to
the twice a year barge service and only during the summer months.
According to the Alaska Commercial Fisheries
Entry Commission (CFEC), no commercial fishing vessels are registered in Huslia in 2005.
SLIDE 23
Summary
Wood burning and gasoline are responsible for
most of the air pollution in Huslia
Information on options to improve wood stove
efficiency and reduce smoke are available and should be presented to the public
Particulates are known to be a toxic air
pollutant
Gasoline emissions can be minimized by
keeping vehicles and equipment in good repair
SLIDE 24 Klawock Survey
Contracted with Ann Wyatt of Klawock Cooperative
Association to manage data collection; James Rowan was hired to conduct the surveys.
Collected data from 50-51 homes on summer and
winter activities, including:
- heating
- transportation
- equipment
- outdoor burning
Data was also collected for the following fuels:
- wood (cords)
- fuel oil (gallons)
- propane (gallons)
- other (please specify)
SLIDE 25 Klawock Survey (continued)
Nonresidential activity and fuel use data
collected from the following facilities
- Klawock Island Fuels
- Klawock Heenya Corporation
- Alicia Roberts Medical Center
- Klawock City School
- Boat Harbor
- City Landfill
- Wastewater Treatment Facility
- Village Council Operations
- Viking Lumber Company
- Klawock Electric
SLIDE 26
Klawock Survey (continued)
Boat harbor survey did not include enough
information for estimating fuel use or emissions.
Harbor commercial marine vessel emissions
were estimated from Kodiak port after adjusting community population, local fishing vessel registration data, and local seasonal activity.
Klawock Airport (AKW) emissions derived from
WRAP 2002 Alaska Aviation Emission Inventory.
Emissions from Klawock Seaplane Base (AQC)
are assumed to be negligible based on discussions with Ann Wyatt.
SLIDE 27 Kongiganak Survey
Betty Phillip was hired to conduct the surveys. Collected data from 29 homes on summer and
winter activities, including:
- heating
- transportation
- equipment
- outdoor burning
Data was also collected for the following fuels:
- wood (cords)
- fuel oil (gallons)
- propane (gallons)
- other (please specify)
SLIDE 28 Kongiganak Survey (continued)
Responses to the non-residential surveys did not
provide facility specific data. Therefore, information from Port Graham was used after adjusting for population.
Non-residential emissions and fuel use were
derived as follows:
- Kongiganak Airport emissions were derived from
WRAP 2002 Alaska Aviation Emission Inventory.
SLIDE 29 Kongiganak Survey (continued)
- Puvurnaq Power Company Diesel fuel use
(81,967 gal/year) was derived from the 2005 Power Cost Equalization (PCE) report.
- Harbor commercial marine vessel emissions
were estimated from Kodiak tug and fishing vessel emissions in 2004 after adjusting local barge schedule, fishing vessel registration data, and local seasonal activity.
SLIDE 30 Kongiganak Survey (continued)
- Emissions and fuel use for the following facilities
were estimated using facility-specific seasonal data from Port Graham adjusted for local population:
Landfill Dick R. Kiunya Memorial School and Library Wastewater Treatment Facility Village Operations Lillian E. Jimmy Memorial Health Clinic Qemirtalek Coast Corporation
SLIDE 31 Minto Survey
Contracted with TCC to manage data collection;
Jordan Baker was hired to conduct the surveys
Collected data from 27-29 homes on summer
and winter activities, including:
- heating
- transportation
- equipment
- outdoor burning
Data was also collected for the following fuels:
- wood (cords)
- fuel oil (gallons)
- propane (gallons)
- other (please specify)
SLIDE 32 Minto Survey (continued)
Partially completed responses to non-residential
surveys were only received for the following facilities:
- Minto Health Clinic
- Minto School
Responses provided information on summer
and winter activities.
Because data from the non-residential surveys
were limited, activity and fuel use for other facilities were estimated using survey data from Huslia and other sources.
SLIDE 33 Minto Survey (continued)
Non-residential emissions and fuel use were
derived as follows:
- Minto Airport emissions were derived from
WRAP 2002 Alaska Aviation Emission Inventory.
- Alaska Village Electric Cooperative Diesel fuel
use for power generation was derived from the 2005 Power Cost Equalization (PCE) report.
SLIDE 34 Minto Survey (continued)
- Emissions and fuel use for the following
facilities were estimated from Huslia after adjusting for population differences.
Washeteria and Water Treatment Plant City Operations Landfill
SLIDE 35 Northway Village Survey
Contracted with TCC to manage data collection;
Glen Marunde was hired to conduct the surveys
Collected data from 30 homes on summer and
winter activities, including:
- heating
- transportation
- equipment
- outdoor burning
Data was also collected for the following fuels:
- wood (cords)
- fuel oil (gallons)
- propane (gallons)
- other (please specify)
SLIDE 36
Northway Village Survey (continued)
Non-residential surveys were sent for all
significant facilities with fuel and motorized equipment use.
Only one response, a partially completed survey
for the Northway Airport was received.
Survey data from Huslia and other sources
were used to fill in data gaps in non-residential fuel use and emissions.
SLIDE 37 Northway Village Survey (continued)
Non-residential emissions and fuel use were
derived as follows:
- Northway Airport emissions were derived
from WRAP 2002 Alaska Aviation Emission Inventory.
- Alaska Power Company Diesel fuel use for
power generation was derived from the 2005 Power Cost Equalization (PCE) report.
SLIDE 38 Northway Village Survey (continued)
Emissions and fuel use for the following
facilities were estimated after adjusting Huslia population data:
- Walter Northway School
- Northway Village Clinic
- Washeteria and Water Treatment Plant
- City Operations
- Northway Landfill
SLIDE 39 Port Graham Survey
Contacted with Port Graham Village Council to
manage data collection; Wes Breedlove was hired to conduct the surveys.
Collected data from 29-32 homes on summer
and winter activities, including:
- heating
- transportation
- equipment
- outdoor burning
Data was also collected for the following fuels:
- wood (cords)
- fuel oil (gallons)
- propane (gallons)
- other (please specify)
SLIDE 40 Port Graham Survey (continued)
Responses for the non-residential surveys were
received for the following facilities:
- Homer Electric Association
- Village Operations
- Port Graham School
- Fuel Supplier Survey
- Port Graham Clinic
- City Landfill
- Marine Operations
- Port Graham Airport
- Wastewater Treatment Facility
- Port Graham Development Corporation
Responses provided information on summer and winter
activities.
SLIDE 41
Port Graham Survey (continued)
Port Graham aircraft and ground support emissions
were derived from WRAP 2002 Alaska Aviation Emission Inventory. Survey of airport was used as supplement.
Commercial marine vessel emissions were
estimated from Kodiak after adjusting for community population, local fishing vessel registration data, and local seasonal activity (summer port only).
SLIDE 42 Sand Point Survey
Contracted with APIA (Connie Fredenbert) to
manage data collection; John Cochran was hired to conduct the surveys.
Collected data from 18 homes on summer and
winter activities, including:
- heating
- transportation
- equipment
- outdoor burning
Data was also collected for the following fuels:
- wood (cords)
- fuel oil (gallons)
- propane (gallons)
- other (please specify)
SLIDE 43 Sand Point Survey (continued)
Non-residential surveys were sent to significant
facilities with fuel and motorized equipment
- use. Responses were received for the following
facilities (some only partially completed):
- TDX Power Corporation
- Fuel Supplier
- City Landfill
- City Operations
- Russian Town Sewer Plant
- Kelly Avenue Sewer Plant
- Peter Pan Seafood
SLIDE 44
Sand Point Survey (continued)
The surveys showed that fuel use and activities
at the non-residential facilities did not vary by season.
Sand Point Airport emissions were derived from
the WRAP 2002 Alaska Aviation Emission Inventory.
Total annual emissions for Trident Seafood’s
point sources were derived from DEC Major Point Source data.
SLIDE 45
Sand Point Survey (continued)
Commercial marine vessel emissions were
estimated from Kodiak after adjusting community population, local fishing vessel registration data, and local seasonal activity (80% in summer and 20% in winter).