approach for inspections of fishery products
play

Approach for Inspections of Fishery Products Products Inspections - PowerPoint PPT Presentation

Fishery Approach for Inspections of Fishery Products Products Inspections were strengthened by increasing the fish species to be inspected and the inspection frequencies. The fish species in which radioactive cesium exceeding 50 Bq/kg has


  1. Fishery Approach for Inspections of Fishery Products Products 
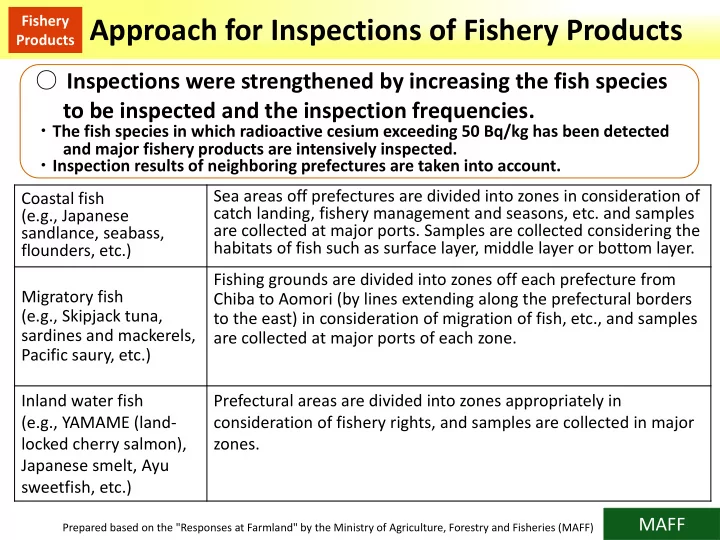
○ Inspections were strengthened by increasing the fish species to be inspected and the inspection frequencies. ・ The fish species in which radioactive cesium exceeding 50 Bq/kg has been detected and major fishery products are intensively inspected. ・ Inspection results of neighboring prefectures are taken into account. Sea areas off prefectures are divided into zones in consideration of Coastal fish catch landing, fishery management and seasons, etc. and samples (e.g., Japanese are collected at major ports. Samples are collected considering the sandlance, seabass, habitats of fish such as surface layer, middle layer or bottom layer. flounders, etc.) Fishing grounds are divided into zones off each prefecture from Migratory fish Chiba to Aomori (by lines extending along the prefectural borders (e.g., Skipjack tuna, to the east) in consideration of migration of fish, etc., and samples sardines and mackerels, are collected at major ports of each zone. Pacific saury, etc.) Inland water fish Prefectural areas are divided into zones appropriately in (e.g., YAMAME (land‐ consideration of fishery rights, and samples are collected in major locked cherry salmon), zones. Japanese smelt, Ayu sweetfish, etc.) MAFF Prepared based on the "Responses at Farmland" by the Ministry of Agriculture, Forestry and Fisheries (MAFF)

  2. Inspection Results for Fishery Products (Marine Fish Species Caught off the Coast of Fishery Products Fukushima Prefecture and Freshwater Fish Species Caught in Fukushima Prefecture) (Percentage of samples (Samples) exceeding the standard limit) Marine fish species Exceeding 100 Bq/kg Freshwater fish species 100 Bq/kg or lower Percentage Apr.‐ Jul.‐ Oct.‐ Jan.‐ Apr.‐ Jul.‐ Oct.‐ Jan.‐ Apr.‐ Jul.‐ Oct.‐ Jan.‐ Apr.‐ Jul.‐ Oct.‐ Jan.‐ Apr.‐ Jul.‐ Oct.‐ Jan.‐ Apr.‐ Jul.‐ Oct.‐ Jan.‐ Apr.‐ Jul.‐ Oct.‐ Jun. Sep. Dec. Mar. Jun. Sep. Dec. Mar. Jun. Sep. Dec. Mar. Jun. Sep. Dec. Mar. Jun. Sep. Dec. Mar. Jun. Sep. Dec. Mar. Jun. Sep. Dec. 2011 2012 2013 2014 2015 2016 2017 As of November 28, 2017 "Inspections of Fishery Products for Radioactive Materials" (November 2017) by the Fisheries Agency

  3. Inspection Results for Fishery Products (Marine Fish Species Caught off the Fishery Coast of Prefectures Other than Fukushima Prefecture and Freshwater Fish Products Species Caught in Prefectures Other than Fukushima Prefecture) (Percentage of samples Marine fish species (Samples) exceeding the standard limit) Freshwater fish species Exceeding 100 Bq/kg 100 Bq/kg or lower Percentage Mar.‐ Jul.‐ Oct.‐ Jan.‐ Apr.‐ Jul.‐ Oct.‐ Jan.‐ Apr.‐ Jul.‐ Oct.‐ Jan.‐ Apr.‐ Jul.‐ Oct.‐ Jan.‐ Apr.‐ Jul.‐ Oct.‐ Jan.‐ Apr.‐ Jul.‐ Oct.‐ Jan.‐ Apr.‐ Jul.‐ Oct.‐ Jun. Sep. Dec. Mar. Jun. Sep. Dec. Mar. Jun. Sep. Dec. Mar. Jun. Sep. Dec. Mar. Jun. Sep. Dec. Mar. Jun. Sep. Dec. Mar. Jun. Sep. Dec. 2011 2012 2013 2014 2015 2016 2017 As of November 28, 2017 "Inspections of Fishery Products for Radioactive Materials" (November 2017) by the Fisheries Agency

  4. Trends of Radioactive Cesium Concentrations by Fishery Fish Species (1/2) Products ○ At present, all samples of surface‐layer fish, such as Japanese sandlance and whitebait, migratory fish such as bonito and tunas, chum salmon and Pacific saury, bottom fish such as flounders, flatfishes and cods, as well as squids and octopuses, shrimps and crabs, shellfish and seaweeds, show radioactive cesium concentrations below the standard limit in all prefectures. ○ The environment of habitats and feeding habits correlate to changes in radioactive cesium concentrations in the respective groups of fish. Surface‐layer fish Migratory fish Squids and octopuses Nationwide Nationwide Nationwide Japanese sadlance Pacific saury Spear squid Juvenile anchovy (whitebait) Chum salmon Giant Pacific octopus Results of inspections from March 24, 2011, to December 26, 2017, compiled by the Fisheries Agency MAFF

  5. Trends of Radioactive Cesium Concentrations by Fishery Fish Species (2/2) Products Nationwide Seaweeds Nationwide Nationwide Shellfish Shrimps and crabs Wakame seaweed (raw, Japanese littleneck clam, salted, dried) Horsehair crab, snow crab (crabs) common orient clam Laver (dried) North Pacific krill (shrimp) Surf clam Sea tangle (raw, salted) Oysters Fukushima Fukushima Fukushima Freshwater fish (wild) Prefecture Bottom fish Bottom fish Prefecture Prefecture IWANA (white spotted char) (wild) Olive Marbled flounder flounder YAMAME (land‐locked cherry salmon) Stone flounder (wild) MAFF

  6. Fishery Chronological Changes in Inspection Results for Fishery Products Products Number of samples Percentage of Number of Inspection period exceeding the samples exceeding samples standard limit the standard limit After the accident to the end of FY2011 After the accident to the end of 3,074 1,077 35.0% FY2012 6,270 791 12.6% In FY2013 7,847 181 2.3% Fukushima FY2014 8,753 48 0.5% Prefecture: FY2015 8,633 0 0% Marine fish FY2016 8,842 0 0% FY2017 (up to November 28) ) FY2017 (up to November 28) 5,510 0 0% 100% Percentage of samples exceeding the standard limit After the accident to the end of FY2011 After the accident to the end of 545 173 31.7% In FY2012 655 88 13.4% In Fukushima Prefecture: Marine fish Fukushima FY2013 683 57 8.3% In Fukushima Prefecture: Freshwater fish Prefecture: FY2014 938 27 2.9% 80% Freshwater FY2015 635 7 1.1% Outside Fukushima Prefecture: Marine fish fish FY2016 701 4 0.6% FY2017 (up to November 28) ) FY2017 (up to November 28) 662 8 1.2% Outside Fukushima Prefecture: Freshwater fish After the accident to the end of After the accident to the end of FY2011 4,361 112 2.6% FY2012 9,917 51 0.5% 60% Outside FY2013 9,540 12 0.1% Fukushima FY2014 8,994 2 0.02% Prefecture: FY2015 7,745 0 0% Marine fish FY2016 7,086 0 0% 40% FY2017 (up to November 28) ) FY2017 (up to November 28) 4,213 0 0% After the accident to the end of After the accident to the end of FY2011 596 114 19.1% Outside FY2012 2,723 163 6.0% Fukushima FY2013 2,625 52 2.0% 20% Prefecture: FY2014 2,237 23 1.0% Freshwater FY2015 1,788 7 0.4% fish FY2016 1,537 7 0.5% FY2017 (up to November 28) ) FY2017 (up to November 28) 1,053 3 0.3% 0% After the FY2012 FY2013 FY2014 FY2015 FY2016 FY2017 (up to accident to the November 28) end of FY2011 * Coverage: 17 prefectures including the Tokyo Metropolis designated as inspection targets in the "Concepts of Inspection Planning and Establishment and Cancellation of Items and Areas to which Restriction of Distribution and/or Consumption of Foods Concerned Applies," which compiles basic approaches concerning radioactive materials in foods Prepared based on the "Inspections of Fishery Products for Radioactive Materials" (November 2017) by the Fisheries Agency

  7. Provision of Information on Place of Product Origin to Fishery Products Consumers ○ Since October 2011, it has been recommended to display places of origin of fresh fishery products, mainly those caught on the Pacific side of eastern Japan, by dividing the sea areas into 7 zones and clarifying these zone names. Display example Zones for migratory fish [Migratory fish species] Salmon shark, blue shark, shortfin mako shark, sardines, Indicate the water zone salmon and trout, Pacific saury, Japanese amberjack, Japanese jack mackerel, marlins, mackerels, bonito and tunas, Japanese of catch on a label flying squid, spear squid, and neon flying squid Line of 200 nautical miles off the coast of Honshu (i) Pacific Ocean off the coast of Due east line extending from the border between Aomori Hokkaido and Aomori and Iwate Prefectures (ii) Off the coast of Sanriku Due east line extending from (northern part) the border between Iwate and Miyagi Prefectures (iii) Off the coast of Sanriku Due east line extending from Indicate the water zone (southern part) the border between Miyagi and of catch on a label Fukushima Prefectures (iv) Off the coast of Fukushima Due east line extending from the border between Fukushima (v) Off the coast of and Ibaraki Prefectures Hitachi and Kashima Due east line extending from (vi) Off the coast of Boso the border between Ibaraki and Due east line Chiba Prefectures extending to the east from Nojimazaki, Chiba Prepared based on the "Responses at Farmland" by the MAFF Ministry of Agriculture, Forestry and Fisheries (MAFF)

Download Presentation
Download Policy: The content available on the website is offered to you 'AS IS' for your personal information and use only. It cannot be commercialized, licensed, or distributed on other websites without prior consent from the author. To download a presentation, simply click this link. If you encounter any difficulties during the download process, it's possible that the publisher has removed the file from their server.

Recommend


More recommend