
SLIDE 1
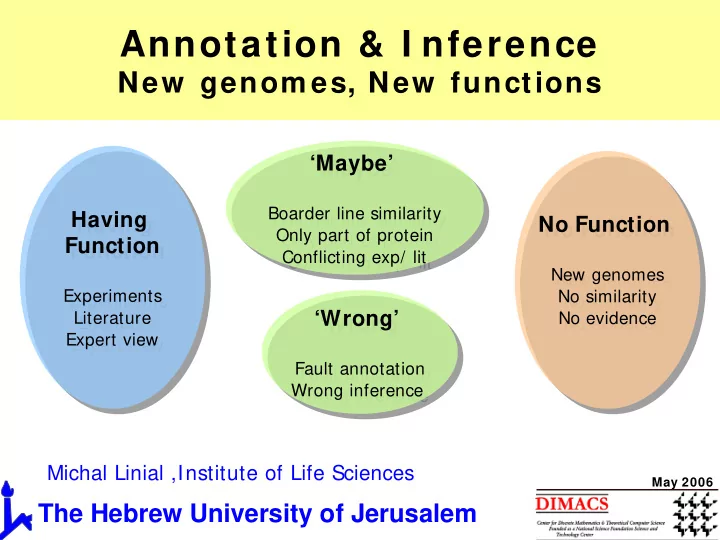
Annotation & I nference
New genom es, New functions
‘Maybe’
Boarder line similarity Only part of protein Conflicting exp/ lit
‘Maybe’
Boarder line similarity Only part of protein Conflicting exp/ lit
Having Function
Experiments Literature Expert view
Having Function
Experiments Literature Expert view
No Function
New genomes No similarity No evidence
No Function
New genomes No similarity No evidence
‘Wrong’
Fault annotation Wrong inference
‘Wrong’
Fault annotation Wrong inference
The Hebrew University of Jerusalem
Michal Linial ,Institute of Life Sciences
May 2006