SLIDE 1 Trends in health and inequality in Glasgow and West Dunbartonshire
Bruce Whyte, Glasgow Centre for Population Health Community-led Approaches to Reducing Poverty: A review of evidence and practice Clydebank Town Hall, Thursday 22nd September 2016
SLIDE 2
Population - Glasgow
SLIDE 3
Population – West Dunbartonshire
SLIDE 4
Population trends
SLIDE 5
Deprivation
SLIDE 6
Child poverty – West Dunbartonshire
SLIDE 7
Glasgow Neighbourhoods
SLIDE 8
Child poverty – Glasgow
SLIDE 9
Fuel Poverty – Glasgow and Clyde Valley
SLIDE 10
Food Poverty
SLIDE 11
In work Poverty – Scotland
SLIDE 12
Private renting - Glasgow
SLIDE 13
People out of work – West Dunbartonshire
SLIDE 14
Proximity to vacant and derelict land – West Dunbartonshire
SLIDE 15
Life expectancy – West Dunbartonshire
SLIDE 16
Male life expectancy by deprivation
SLIDE 17
Female life expectancy by deprivation
SLIDE 18
Healthy life expectancy in West Dunbartonshire
SLIDE 19
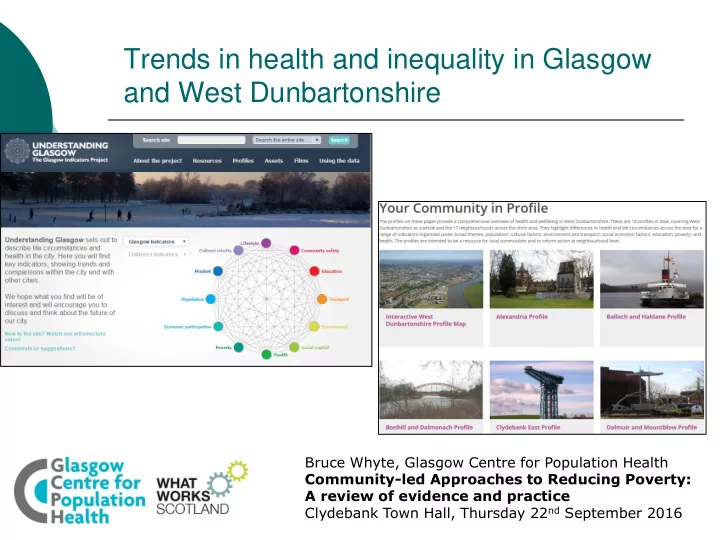
http://www.wdcpp.org.uk/your-community/your-community-in-profile/
SLIDE 20 Profiles…
Male Life Expectancy at birth in Greater Glasgow and Clyde CH(C)Ps, 2001-2005
Source: Compiled by GCPH using GROS population estimates and death registrations 73.9 68.2 70.1 70.8 70.9 71.1 71.4 72.5 76.5 77.4 68.1 62.0 64.0 66.0 68.0 70.0 72.0 74.0 76.0 78.0 80.0 Scotland East Glasgow CHCP North Glasgow CHCP South West Glasgow CHCP West Glasgow CHCP Inverclyde CHP West Dunbartonshire CHP South East Glasgow CHCP Renfrewshire CHP East Renfrewshire CHCP East Dunbartonshire CHP
CHP/CHCP Estimated life expectancy in years at birth A boy born today in East Dunbartonshire might live
years than one born in East Glasgow
Breast Feeding at 6/8 weeks
45.5 35.2
10 20 30 40 50 60
97-99 98-00 99-01 00-02 01-03 02-04 03-05 04-06
% of mothers breastfeeding
Scotland SE Glasgow
Provide communities and planners with up- to-date and locally- relevant public health intelligence Highlight health and social inequalities Show trends in key indicators Provide local level information to aid priority-setting and the targeting of resource Developing knowledge and understanding of the complexities around health and health inequalities
SLIDE 21 A plug for Tableau….
Clear and intuitive interaction allows a large range of users to access the information they want to access
User can select a variety of indicators
The user can compare different community councils easily with West Dunbartonshire or Scotland
Information is displayed in a variety of visual formats, complementing the PDF profiles
Can be tailored for desktop and mobile devises
SLIDE 22
Map Comparisons
SLIDE 23
Spine Chart
SLIDE 24 Key points
Demographic trends important Different aspects of poverty some are difficult to quantify locally levels of deprivation in West Dunbartonshire
similar to Glasgow
clear differences in experience of poverty
within council areas
Life expectancy trends significant in Glasgow
and West Dunbartonshire
Gender differences and local variations in life
spent in poor health