
SLIDE 1
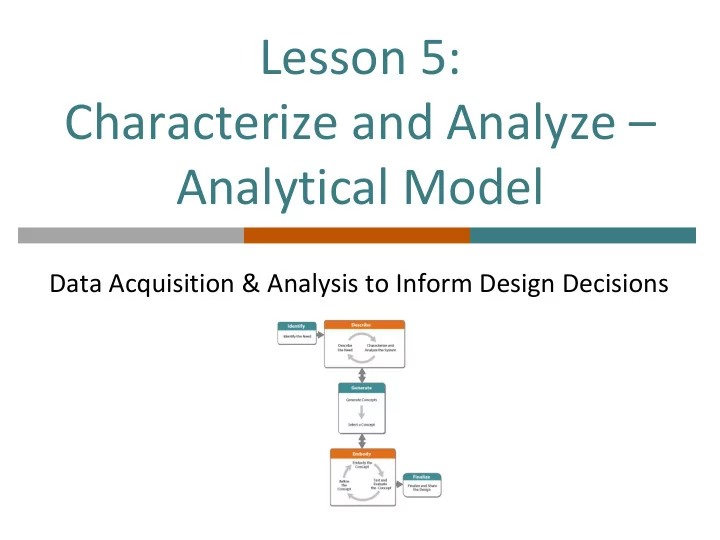
Lesson 5: Characterize and Analyze – Analytical Model
Data Acquisition & Analysis to Inform Design Decisions
Analytical Model Data Acquisition & Analysis to Inform Design - - PowerPoint PPT Presentation
Lesson 5: Characterize and Analyze Analytical Model Data Acquisition & Analysis to Inform Design Decisions What have we done? Whats next? We are concerned about acceleration and displacement. High acceleration high High
Data Acquisition & Analysis to Inform Design Decisions
High displacement high forces on the building, especially at the base. High acceleration high forces on the building, and on people and objects inside.
Each team has collected data about peak
accelerations for at least two cases.
Would you report results to the client with
confidence?
Data can be distributed, or spread out, in many ways
Data are distributed to the right, but skewed to the left Data are distributed to the left, but skewed to the right Data are distributed randomly
10 20 30
Left-Skewed
10 20 30
Right-Skewed
5 10 15 20
Random Distribution
In many cases, the data tend to be around a central
value and have a “normal distribution" like this:
5 10 15 20 25
Normal Distribution
Bell curve = normal distribution of data
1 21 41 61 81 Frequency Sample Values
68% 95% 34% 34% 14% 14% 2% 2%
High displacement high forces on the building, especially at the base. High acceleration high forces on the building, and on people and objects inside.
High displacement high forces on the building, especially at the base. High acceleration high forces on the building, and on people and objects inside.
See video on my youtube channel
A building with a high center of mass shaking back
and forth is like a tall stick with a mass on the end shaking back and forth.
M
This is a beam anchored only on one end – in this case, the bottom. A structure like this is called a cantilever, with a mass load
What are some advantages and disadvantages
Assessment 5: Standard Deviation Assessment 6: Resonance