
https://www.cs.ubc.ca/~tmm/courses/436V-20
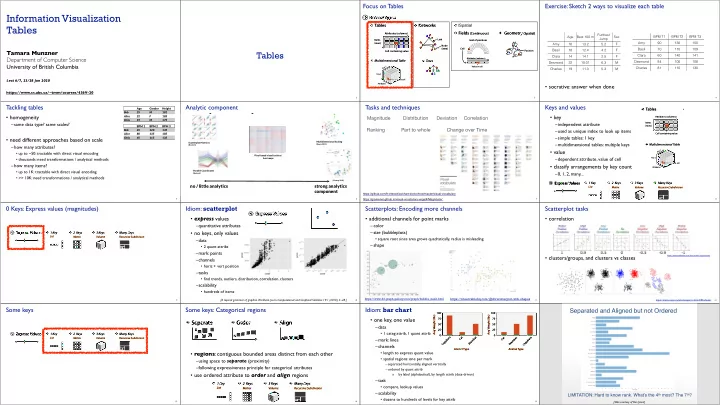
Information Visualization Tables
Tamara Munzner Department of Computer Science University of British Columbia
Lect 6/7, 23/28 Jan 2020
Tables
2
Focus on Tables
3
Node em)
Fields (Continuous)
Attributes (columns) Value in cell
Cell Grid of positions
Geometry (Spatial)
Position
Spatial Net Tables
Attributes (columns) Items (rows) Cell containing value
Dataset Types
Multidimensional Table
Value in cell
Networks
Link Node (item)
Trees
Exercise: Sketch 2 ways to visualize each table
- socrative: answer when done
4
BPM T1 BPM T2 BPM T3 Amy 90 130 150 Basil 70 110 109 Clara 60 140 141 Desmond 84 100 108 Charles 81 110 130 Age Best 100 m Furthest Jump Sex Amy 16 13.2 5.2 F Basil 18 12.4 4.2 F Clara 14 14.1 2.5 F Desmond 22 10.01 6.3 M Charles 19 11.3 5.3 M
Tackling tables
- homogeneity
–same data type? same scales?
- need different approaches based on scale
–how many attributes?
- up to ~50: tractable with direct visual encoding
- thousands: need transformations / analytical methods
–how many items?
- up to 1K: tractable with direct visual encoding
- >> 10K: need transformations / analytical methods
5
Age Gender Height Bob 25 M 181 Alice 22 F 185 Chris 19 M 175 BPM 1 BPM 2 BPM 3 Bob 65 120 145 Alice 80 135 185 Chris 45 115 135
Analytic component
6
Analytic Component
no / little analytics strong analytics component
Scatterplot Matrices
[Bostock]
Parallel Coordinates
[Bostock]
Pixel-based visualizations / heat maps Multidimensional Scaling
[Doerk 2011] [Chuang 2012]
Tasks and techniques
7
Deviation Correlation Change over Time Ranking Distribution Part to whole Magnitude
https://github.com/ft-interactive/chart-doctor/tree/master/visual-vocabulary https://gramener.github.io/visual-vocabulary-vega/#/Magnitude/
8
Keys and values
- key
–independent attribute –used as unique index to look up items –simple tables: 1 key –multidimensional tables: multiple keys
- value
–dependent attribute, value of cell
- classify arrangements by key count
–0, 1, 2, many...
1 Key 2 Keys 3 Keys Many Keys
List Recursive Subdivision Volume Matrix
Express Values Tables
Attributes (columns) Items (rows) Cell containing value
Multidimensional Table
Value in cell 9
0 Keys: Express values (magnitudes)
1 Key 2 Keys 3 Keys Many Keys
List Recursive Subdivision Volume Matrix
Express Values
Idiom: scatterplot
- express values
–quantitative attributes
- no keys, only values
–data
- 2 quant attribs
–mark: points –channels
- horiz + vert position
–tasks
- find trends, outliers, distribution, correlation, clusters
–scalability
- hundreds of items
10
[A layered grammar of graphics.
- Wickham. Journ. Computational and Graphical Statistics 19:1 (2010), 3–28.]
Express Values
Scatterplots: Encoding more channels
- additional channels for point marks
–color –size (bubbleplots)
- square root since area grows quadratically, radius is misleading
–shape
11
https://observablehq.com/@d3/scatterplot-with-shapes https://www.d3-graph-gallery.com/graph/bubble_basic.html
Scatterplot tasks
- correlation
- clusters/groups, and clusters vs classes
12 https://www.mathsisfun.com/data/scatter-xy-plots.html https://www.cs.ubc.ca/labs/imager/tr/2014/DRVisTasks/ 13
Some keys
1 Key 2 Keys 3 Keys Many Keys
List Recursive Subdivision Volume Matrix
Express Values
Some keys: Categorical regions
- regions: contiguous bounded areas distinct from each other
–using space to separate (proximity) –following expressiveness principle for categorical attributes
- use ordered attribute to order and align regions
14
1 Key 2 Keys 3 Keys Many Keys
List Recursive Subdivision Volume Matrix
Separate Order Align
Idiom: bar chart
- one key, one value
–data
- 1 categ attrib, 1 quant attrib
–mark: lines –channels
- length to express quant value
- spatial regions: one per mark
– separated horizontally, aligned vertically – ordered by quant attrib » by label (alphabetical), by length attrib (data-driven)
–task
- compare, lookup values
–scalability
- dozens to hundreds of levels for key attrib
15
100 75 50 25 Animal Type 100 75 50 25 Animal Type
Separated and Aligned but not Ordered
LIMITATION: Hard to know rank. What’s the 4th most? The 7th?
[Slide courtesy of Ben Jones]