
Analysis of multistate data with realistic rate models and multiple time scales: A dogmatic approach
Bendix Carstensen Steno Diabetes Center Gentofte, Denmark http://BendixCarstensen.com IARC, Lyon, France, 11 April 2018
1/ 51
The dogma [1]
◮ do not condition on the future — indisputable ◮ do not count people after they are dead — disputable ◮ stick to this world — expandable
2/ 51
do not condition on the future
◮ commonly seen in connection with“immortal time bias” ◮ allocation of follow-up (risk time) to a covariate value only
assumed in the future
◮ all follow-up among persons ever on insulin allocated to the
insulin group — including the time prior to insulin use (when not on insulin)
◮ events always with the correct covariate values ◮ ⇒ too much PY in insulin group; rates too small ◮ ⇒ too little PY in non-insulin group; rates too large ◮ ⇒ insulin vs. non-insulin rates underestimated
3/ 51
do not count people after they are dead
◮ Reference to Fine & Gray’s paper on models for the
subdistribution hazard [2]
◮ Recall: hazard and cumulative risk for all cause death:
F(t) = 1−exp
- −Λ(t)
- ⇔
λ(t) = Λ′(t) =
- log
- 1−F(t)
′
◮ Subdistribution hazard — with more causes of death
(compting risks), for cumulative risk of cause c, Fc(t): ˜ λc(t) =
- log
- 1 − Fc(t)
′
◮ Note: Fc depends on all cause-specific hazards
4/ 51
do not count people after they are dead
◮ The estimation of the subdistribution hazard boils down to:
˜ h(t) = P {X (t + dt) = j|X (t) = j} / dt that is, the instantaneous rate of failure per time unit from cause j among those who are either alive or have died from causes other than j at time t
◮ . . . sounds crazy, but. . . ◮ when modeling the cumulative risk you must refer back to
the size of the original population, which include those dead from other causes.
◮ The debate is rather if the subdistribution hazard is a useful
scale for modeling and reporting from competing risk settings
5/ 51
stick to this world
◮ the“net”survival or“cause specific survival”
: Sc(t) = exp t λc(s) ds
- ◮ not a proper probability
◮ the probability of survival if
◮ all other causes of death than c were absent ◮ c-specific mortality rate were still the same
◮ so it is just a transformation of the cause-specific rate with no
real world interpretation
◮ . . . do not label quantities“survival”or“probability”when they
are not (of this world)
6/ 51
(further) dogma for “sticking to this world”
◮ rates are continuous in time (and“smooth”
)
◮ rates may depend on more than one time scale ◮ which, is an empirical question
7/ 51
A look at the Cox model
λ(t, x) = λ0(t) × exp(x ′β) A model for the rate as a function of t and x. Covariates:
◮ x ◮ t ◮ . . . often the effect of t is ignored (forgotten?) ◮ i.e. left unreported
8/ 51
The Cox-likelihood as profile likelihood
◮ One parameter per death time to describe the effect of time
(i.e. the chosen timescale). log
- λ(t, xi)
- = log
- λ0(t)
- + β1x1i + · · · + βpxpi
- ηi
= αt + ηi
◮ Profile likelihood:
◮ Derive estimates of αt as function of data and βs
— assuming constant rate between death/censoring times
◮ Insert in likelihood, now only a function of data and βs ◮ This turns out to be Cox’s partial likelihood
◮ Cumulative intensity (Λ0(t)) obtained via the
Breslow-estimator
9/ 51
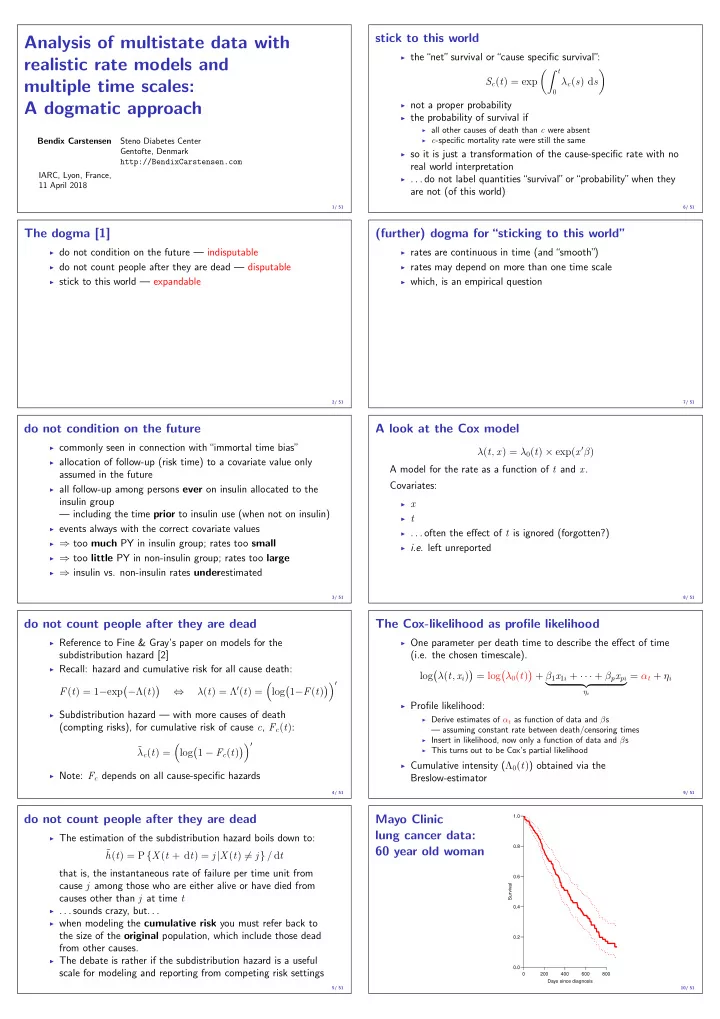
Mayo Clinic lung cancer data: 60 year old woman
200 400 600 800 0.0 0.2 0.4 0.6 0.8 1.0 Days since diagnosis Survival 10/ 51