analyses of the geomagnetic variations and gps
play

Analyses of the geomagnetic variations and GPS scintillation over - PowerPoint PPT Presentation

Analyses of the geomagnetic variations and GPS scintillation over the Canadian auroral zone Lidia Nikitina 1 , D.W. Danskin 1 , R. Ghoddousi-Fard 2 , P. Prikryl 1 1 Geomagnetic Laboratory, Natural Resources Canada 2 Geodetic Survey, Natural


  1. Analyses of the geomagnetic variations and GPS scintillation over the Canadian auroral zone Lidia Nikitina 1 , D.W. Danskin 1 , R. Ghoddousi-Fard 2 , P. Prikryl 1 1 Geomagnetic Laboratory, Natural Resources Canada 2 Geodetic Survey, Natural Resources Canada I ES 2015, May 12-14, Old Town Alexandria

  2. Motivation  
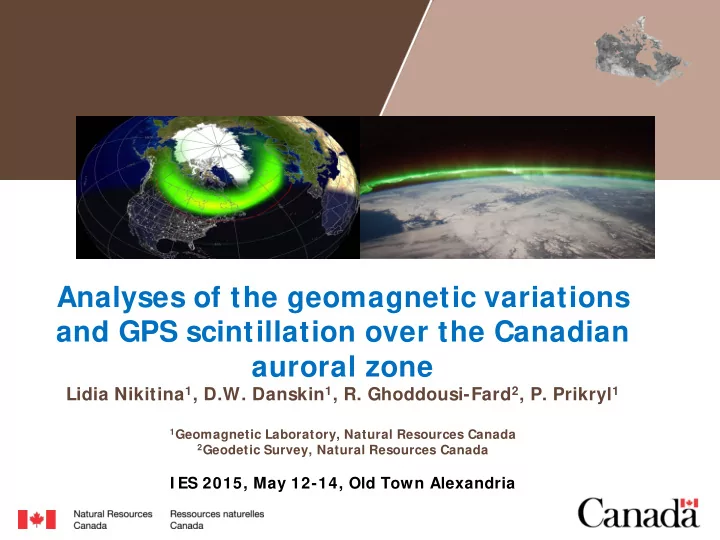
Canada has a special location which is dominated by the auroral zone  The ionosphere and geomagnetic activity are strongly affected by space weather  Geomagnetic activity has been forecasted by NRCan since 1970’s and is based on hourly ranges of geomagnetic field  Structures in the ionosphere causes scintillation of GPS signals  Need to assess if there is a way to forecast of GPS scintillation based on magnetic activity GPS Latitude Longitude Magnetic Latitude Longitude  The magnetic data and GPS receiver station observatory data are available in 2013 at three yell 62.481 -114.481 Yellowknife 62.48 -114.482 locations in auroral zone YKC chur 58.759 -94.089 Churchill 58.75 -94.082 FCC kuuj 55.278 -77.745 Sanikiluaq 56.5 -79.2 SNK

  3. Magnetic and scintillation indices Ionosphere index Geomagnetic index  Delta phase rate (DPR) is  Hourly range of the magnetic the rate of change for the variations is used as indicator GPS dual frequency phase of the geomagnetic activity based on 1s measurements  Hourly range = Max(per hour)- Min(per hour)  DPR is averaged for 30 s to determine mDPR  Hourly range can be computed for each of the three magnetic  To be comparable with components geomagnetic index, a HRX, HRY, HRZ hourly index is needed  In this study the maximum of mDPR in each hour (mDPRmax) is used http://wdc.kugi.kyoto-u.ac.jp/element/elefig.gif

  4. Geomagnetic indices Zone Quiet Unsettled Active Stormy Major Storm Auroral 0 – 90 nT 90 – 170 nT 170 – 300 nT 300 – 1000 1000+ (Fort Churchill) nT HRX

  5. Space Weather Event October 2013 Solar Source and solar wind response 29 September 2013/2337 UT: CME produced by filament eruption Origin: N15W40 02 October ~01:20 UT: ACE Solar wind speed increased from ~ 400 km/s just before the shock to ~ 636 km/s. 02 October ~0425 UT: IMF Bz decreases to ~ -30 nT

  6. Space Weather Event October 2013 Solar Source and solar wind response 29 September 2013/2337 UT: CME produced by filament eruption Origin: N15W40 02 October ~01:20 UT: ACE Solar wind speed increased from ~ 400 km/s just before the shock to ~ 636 km/s. 02 October ~0425 UT: IMF Bz decreases to ~ -30 nT

  7. Space Weather Event October 2013 Solar Source and solar wind response 29 September 2013/2337 UT: CME produced by filament eruption Origin: N15W40 02 October ~01:20 UT: ACE Solar wind speed increased from ~ 400 km/s just before the shock to ~ 636 km/s. 02 October ~0425 UT: IMF Bz decreases to ~ -30 nT

  8. Space Weather Event October 2013 Solar Source and solar wind response 29 September 2013/2337 UT: CME produced by filament eruption Origin: N15W40 02 October ~01:20 UT: ACE Solar wind speed increased from ~ 400 km/s just before the shock to ~ 636 km/s. 02 October ~0425 UT: IMF Bz decreases to ~ -30 nT

  9. Space Weather Event October 2013 Solar Source and solar wind response 29 September 2013/2337 UT: CME produced by filament eruption Origin: N15W40 02 October ~01:20 UT: ACE Solar wind speed increased from ~ 400 km/s just before the shock to ~ 636 km/s. 02 October ~0425 UT: IMF Bz decreases to ~ -30 nT

  10. Space Weather Event October 2013 Solar Source and solar wind response 29 September 2013/2337 UT: CME produced by filament eruption Origin: N15W40 02 October ~01:20 UT: ACE Solar wind speed increased from ~ 400 km/s just before the shock to ~ 636 km/s. 02 October ~0425 UT: IMF Bz decreases to ~ -30 nT

  11. Space Weather Event October 2013 Solar Source and solar wind response 29 September 2013/2337 UT: CME produced by filament eruption Origin: N15W40 02 October ~01:20 UT: ACE Solar wind speed increased from ~ 400 km/s just before the shock to ~ 636 km/s. 02 October ~0425 UT: IMF Bz decreases to ~ -30 nT

  12. Geomagnetic and ionospheric response at two locations due to event of October 2013 Fort Churchill (FCC) Sanikiluaq (SNK) Scintillation 3 Oct 4 Oct 1 Oct 2 Oct 3 Oct 4 Oct 1 Oct 2 Oct Magnetic variation night day

  13. geomagnetic and scintillation comparison for first 85 days in 2013 Fort Churchill (FCC) Sanikiluaq (SNK) Scintillation Magnetic variation

  14. geomagnetic and scintillation indices for 2013 Fort Churchill (FCC) Sanikiluaq (SNK) FCC SNK HRX r=0.694 r=0.688 k=0.540 k=0.434 HRY r=0.680 r=0.671 k=0.547 k=0.485 HRZ r=0.726 r=0.764 k=0.544 k=0.41

  15. geomagnetic and scintillation indices for 2013 Fort Churchill (FCC) Sanikiluaq (SNK) FCC SNK HRX r=0.694 r=0.688 k=0.540 k=0.434 HRY r=0.680 r=0.671 k=0.547 k=0.485 HRZ r=0.726 r=0.764 k=0.544 k=0.41

  16. Distributions Scintillation Magnetic variation Histogram for night time data look similar for the ionosphere index and magnetic variations

  17. Variation of the correlation coefficient between magnetic and scintillation indices Fort Churchill night time day time day night Daytime drop in correlation between mDPRmax index and geomagnetic activity

  18. Variation of the correlation coefficient between magnetic and scintillation indices. Sanikiluaq. night time day time night day Daytime drop in correlation between mDPR index and geomagnetic activity

  19. Variation of the slope between magnetic and scintillation indices. Fort Churchill (FCC) Sanikiluaq (SNK) Slope of the fitting line between mDPR index and geomagnetic activity is ∼ 0.5-0.6 during night time and drops during day time

  20. Correlation between magnetic and scintillation indices excluding hours 13-23 FCC Correlation All data Night time Of mDPRmax with HRX 0.69 0.75 with HRY 0.68 0.78 with HRZ 0.76 0.80 Model log(mDPRmax)= a*log(HR)+b To a first approximation, mDPRmax index is proportional to the square root of HR The best correlation is with HRZ. mDPRmax ≈ 0.429*HRZ 0.554

  21. Correlation between magnetic and scintillation indices excluding hours 12-22 Sanikiluaq Correlation All data Night time Of mDPRmax with HRX 0.69 0.77 with HRY 0.67 0.78 with HRZ 0.72 0.80 Model Log(mDPRmax)= a*log(HR)+b To a first approximation, mDPRmax index is proportional to the square root of HR The best correlation is with HRZ. mDPRmax ≈ 0.388*HRZ 0.461

  22. Conclusion  As an attempt to forecast scintillation, one year of data in 2013 from auroral magnetic observatories and co- located GPS stations was analysed  To a first approximation, mDPRmax index is proportional to the square root of HR  The nighttime correlation coefficient is much greater than during the day  The correlation is strongest with the HRZ of the magnetic field  hourly indices of geomagnetic field variations could be a representative measure for the maximum GPS scintillation proxy index (mDPRmax) for the auroral zone

Download Presentation
Download Policy: The content available on the website is offered to you 'AS IS' for your personal information and use only. It cannot be commercialized, licensed, or distributed on other websites without prior consent from the author. To download a presentation, simply click this link. If you encounter any difficulties during the download process, it's possible that the publisher has removed the file from their server.

Recommend


More recommend