SLIDE 1
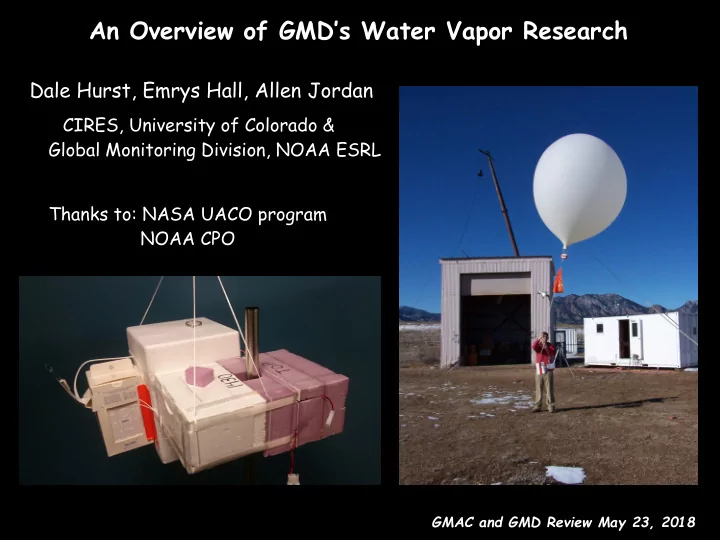
An Overview of GMD’s Water Vapor Research
Dale Hurst, Emrys Hall, Allen Jordan
GMAC and GMD Review May 23, 2018
CIRES, University of Colorado & Global Monitoring Division, NOAA ESRL Thanks to: NASA UACO program NOAA CPO
SLIDE 2
Scientific Goal
Monitor and understand the inter-annual and longer-term variability of water vapor in the upper troposphere and stratosphere
Why?
Water vapor is a very powerful greenhouse gas, especially in the very cold region near the tropopause
How?
Balloon-borne NOAA Frost Point Hygrometers (FPHs)
Where?
Boulder, Colorado; Hilo, Hawaii; Lauder, New Zealand
When?
1-2 soundings per month at each site SWV influences stratospheric O3 - polar (PSCs) and global (HOx)
GMAC and GMD Review May 23, 2018
2/12
SLIDE 3 Water Vapor in the Stratosphere
How is it removed?
- Recirculation (Brewer-Dobson Circulation)
- Photo-dissociation by Lyman-α radiation (Mesosphere)
- Dehydration within Antarctic vortex during winter/spring
What controls its distribution?
- Strengths and Phases of BDC, QBO, ENSO (Seasonal, Inter-annual)
- > influences on tropical coldpoint (minimum) temperatures
- Amounts of CH4 and H2 that have been oxidized (Height-dependent)
- Strengths of deep convection, Antarctic dehydration, Asian monsoon
How does it get there?
- Slow vertical transport (Brewer-Dobson Circulation)
- Fast cross-tropopause transport (Deep Convective Ice Lofting)
- Isentropic transport through tropopause breaks
- In situ oxidation of CH4 and H2 in the stratosphere
GMAC and GMD Review May 23, 2018
3/12
SLIDE 4 Water Vapor–Climate Feedback
Stratospheric Water Vapor (<0.1% of atmospheric burden)
- Strong IR absorber of OLR, weak thermal emission to space
- Climate change to warm the tropical tropopause and increase SWV
- Additional SWV absorbs more OLR
Changes in SWV have a significant impact on surface temperatures Tropospheric Water Vapor (>99.9% of atmospheric burden)
- Strong IR absorber of outgoing long-wave radiation (OLR)
- Increased surface and tropospheric temperatures adds WV
- Additional WV absorbs more OLR
The ~1 ppm (~25%) increase in SWV between 1980 and 2000 would have enhanced the rate of surface warming in the 1990s by ~30%
GMAC and GMD Review May 23, 2018
4/12
Solomon et al. (2010)
SLIDE 5 How GMD Measures Water Vapor
Balloon-Borne Frost Point Hygrometers (FPH)
- 1854: First dew point hygrometer developed in Germany
- 1947: First FPH capable of measuring SWV (<10 ppm)
- 1960-70s: Mastenbrook and Oltmans developed balloon-borne FPH at NRL
- 1980: Oltmans begins routine FPH soundings in Boulder
- 1989->: FPH performance improved: digital logic, stable frost control
- Every NOAA FPH is built and bench-tested at GMD. 40-50 per year
FPH Air Flow Tube (also on bottom) Ozonesonde Radiosonde FPH Cryogen Dewar FPH Mirror Assembly (internal)
GMAC and GMD Review May 23, 2018
PID Logic Tube
5/12
SLIDE 6
Lauder Hilo Boulder Where GMD Measures Water Vapor NOAA FPH sites Boulder 40°N since 1980
(~monthly profiles)
Hilo 20°N since 2010 Lauder 45°S since 2004 Lauder Hilo Boulder
Sodankylä San José Lindenberg
Other sites (using CFH) Sodankylä 67°N since 2002
(with >5 years of monthly profiles)
Lindenberg 52°N since 2008 San José 10°N since 2005
GMAC and GMD Review May 23, 2018
6/12
38
SLIDE 7
Water Vapor Vertical Profiles
GMAC and GMD Review May 23, 2018
Altitude (km) Water Vapor (ppmv)
7/12
SLIDE 8
FPH Measurement Accuracy and Uncertainties
Near-global coverage from 1984 onward
from Hall et al. (2016) Systematic Random
Laboratory Comparison AQUAVIT-2 (2013)
GMAC and GMD Review May 23, 2018 from Hall et al. (2016)
FPH Measurement Accuracy
8/12
SLIDE 9
Trends of 0.20 – 0.25 ppm decade-1
Scientific Findings
GMAC and GMD Review May 23, 2018 updated from Hurst et al. (2011)
9/12
SLIDE 10
FPH and CFH vs MLS, 68 hPa
GMAC and GMD Review May 23, 2018 from Hurst et al. (2016)
Spatial Coincidence Criteria ∆lat < 2° ∆lon < 8° Temporal Matching ∆t < 18h 10/12
SLIDE 11
GMAC and GMD Review May 23, 2018
FPs vs MLS: Post-2010 Drifts
adapted from Hurst et al. (2016)
Full-Record Biases
11/12
SLIDE 12
Summary Photo by Patrick Cullis, GMD Boulder record: SWV increase of ~20% since 1980 Measurement uncertainties <6% (2σ) in the stratosphere Only 6 FP sites world-wide with records >5 years GMD: 1-2 FPH launches/month at 3 sites. 38 years at BLD FPs and MLS began diverging ~2010 (1-2% yr-1) WV near the tropopause is a powerful GHG (+feedback) FPs–MLS biases up to 0.4 ppm (10%) below 23 km
SLIDE 13
GMAC and GMD Review May 23, 2018
Extra Slides
SLIDE 14 PC
PC
40-channel multiplexer
1234 2459 3456 4675 6857
EtOH & Dry Ice & LN2
Motorized Mixer Thermistors 35 New 4 Archived 1 NIST-calibrated
Calibration Range: -100 to +20° C (takes ~36 hours)
Ensuring Long-Term FPH Measurement Accuracy
Calibration of mirror thermistors
GMAC and GMD Review May 23, 2018
SLIDE 15
FP vs Satellite Drifts
adapted from Hurst et al. (2016)
Statistical Breakpoints FPH – MLS
GMAC and GMD Review May 23, 2018