
SLIDE 1
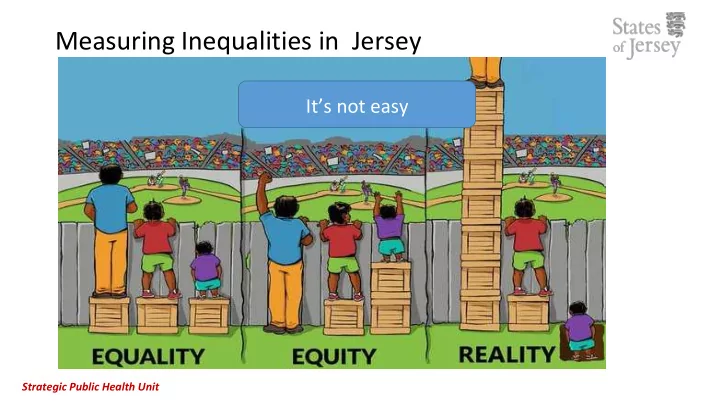
Measuring Inequalities in Jersey
It’s not easy
Strategic Public Health Unit
an ongoing and ever changing process 1907 2015 Life Expectancy for - - PowerPoint PPT Presentation
Measuring Inequalities in Jersey Its not easy Strategic Public Health Unit an ongoing and ever changing process 1907 2015 Life Expectancy for males and females in Jersey, 1907 and 2015 90 80 70 60 50 40 30 20 10 0 Males
Strategic Public Health Unit
10 20 30 40 50 60 70 80 90
Males Females
Life Expectancy for males and females in Jersey, 1907 and 2015
1907 2015
1907
Strategic Public Health Unit
2015
Neoplasms (cancer), 7%
Circulato ry diseases, 25% Infectiou s & Parasitic , 40%
Respiratory diseases, 2% Digestive diseases, 6% External causes- accidents, suicides etc, 7% All other causes, 13%
1907 main causes of death Strategic Public Health Unit [CATEGO RY NAME], [VALUE] Circulato ry diseases, 25%
Respiratory diseases, 13% Digestive diseases, 5% External causes- accidents, suicides etc, 3% Mental & behavioural, 8% All other causes, 12%
2015 main causes of death
Strategic Public Health Unit
Variation in tooth decay in Jersey Primary schools 2006
14% 11% 14% 20%
0% 5% 10% 15% 20% 25% Sub-urban Private Parish Tow n
% of children requiring dental treatment
0% 10% 20% 30% 40% 50% 60% 70% 80% 90% 100% Town catchment Parishes Private schools
Require Treatment Children w ith a dentist
Children with a dentist had less active decay
Strategic Public Health Unit
7% of the Jersey population in 2006 thought their housing conditions made their health worse 29% of those in ‘unsatisfactory’ accommodation reported higher anxiety & depression levels
Strategic Public Health Unit
Strategic Public Health Unit
0% 5% 10% 15% 20% 25% S c h
F S c h
C S c h
D S c h
E S c h
A J e r s e y a v e r a g e S c h
H S c h
B S c h
G 0% 5% 10% 15% 20% 25% School G School F School C School B Jersey average School E School H School D School A
Prevalence of 14-15 year olds drinking alcohol in Jersey schools, 2005 Prevalence of 14-15 year olds smoking regularly in Jersey schools , 2005
Strategic Public Health Unit
The percentage of young people reporting drinking alcohol is similar across schools and has continued to decrease. It is lower than Guernsey and the UK. 52% of 12-13 year olds report never drinking. Up from 30% in 2010 Evidence of more risky drinking in some schools when compared with others
Percentage of young people drinking alcohol in the 7 days prior to the survey
Strategic Public Health Unit
~12% 14/15 yr olds smoke – schools showed no sig differences from this average Are some diffs between schools - range 2% to 16% - but not significant More children smoking in schools which also reported higher levels of parents/carers smoking and someone smoking in a car or indoors.
Strategic Public Health Unit
Strategic Public Health Unit
Strategic Public Health Unit
Inequalities in health risks and in turn health outcomes are worse for men in Jersey compared with women.