An Introduction to Quality Improvement - JAMIE WOOLDRIDGE, MD - - PDF document

an introduction to quality improvement
SMART_READER_LITE
LIVE PREVIEW

An Introduction to Quality Improvement - JAMIE WOOLDRIDGE, MD - - PDF document

6/7/19 An Introduction to Quality Improvement - JAMIE WOOLDRIDGE, MD CHIEF, PEDIATRIC PULMONARY 1 Objectives 1. Describe the components included in the Model for Improvement - 2. Describe how to apply the Plan, Do, Study, Act (PDSA)


slide-1
SLIDE 1

6/7/19 1

‘-

1

An Introduction to Quality Improvement

JAMIE WOOLDRIDGE, MD CHIEF, PEDIATRIC PULMONARY

‘-

2

Objectives

  • 1. Describe the components included in the Model for

Improvement

  • 2. Describe how to apply the Plan, Do, Study, Act (PDSA) cycle

to test, implement, and spread change

‘-

3

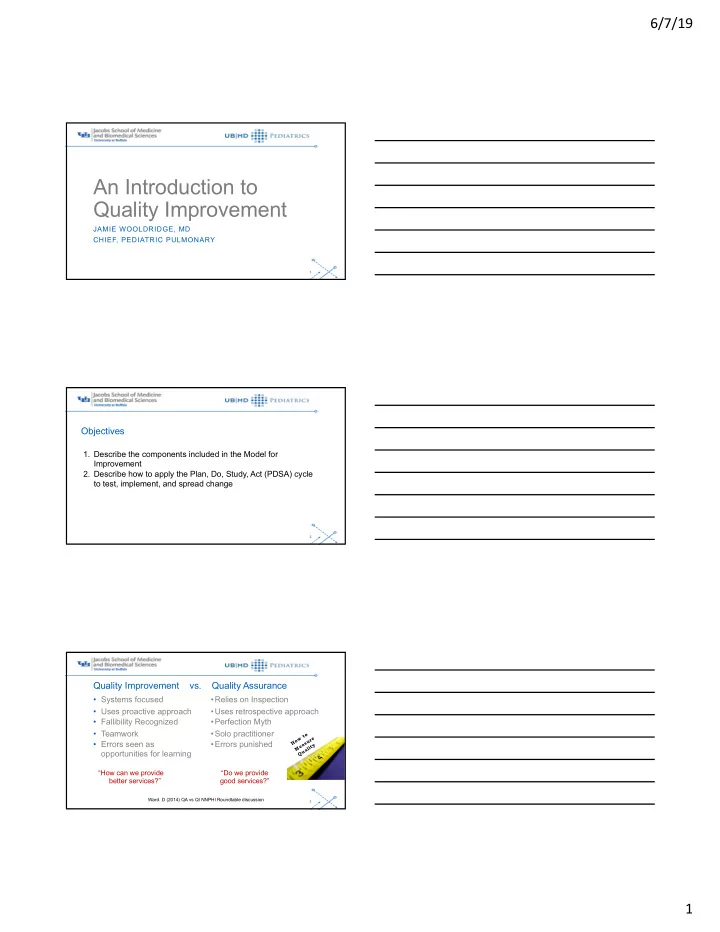
Quality Improvement vs. Quality Assurance

  • Systems focused
  • Uses proactive approach
  • Fallibility Recognized
  • Teamwork
  • Errors seen as
  • pportunities for learning
  • Relies on Inspection
  • Uses retrospective approach
  • Perfection Myth
  • Solo practitioner
  • Errors punished

“How can we provide better services?” “Do we provide good services?”

  • Ward. D (2014) QA vs QI NNPHI Roundtable discussion

H

  • w

t

  • M

e a s u r e Q u a l i t y

slide-2
SLIDE 2

6/7/19 2

‘-

4

Central Law of Improvement

“Every system is perfectly designed to get the results it gets.”

Paul Batalden, MD

‘-

5

Approaches

The Typical Approach: CONFERENCE ROOMS REAL WORLD Design Design Design Design Approved Implement

‘-

6 Approved

CONFERENCE ROOMS REAL WORLD

Applied Science Approach:

Design

Test & Modify Test & Modify Test & Modify Approved

Implement

Approaches

slide-3
SLIDE 3

6/7/19 3

‘-

7

“This model is not magic, but it is probably the most useful single framework I have encountered in twenty years of my own work

  • n quality improvement.”

Dr Donald M. Berwick

Former Administrator of the Centres for Medicare & Medicaid Services | Professor of Paediatrics and Health Care Policy at the Harvard Medical School

The Improvement Guide, API, 2009

What are we trying to accomplish? How will we know a change is an improvement? What changes can we make that will result in improvement?

The Model for Improvement

Plan Do Study Act

‘-

8

What are we trying to accomplish?

‘-

9

SMART Goal

What exactly is it you want to achieve? How can you measure and track the progress of the goal? Is it actually attainable in the given time frame? Is it something that you really want to do? Will it directly benefit you? When do you want to achieve this goal by?

slide-4
SLIDE 4

6/7/19 4

‘-

10

Aim Statement Review

  • June 2018 through July 2019, teams participating in the NYS AQIC will

utilize the “National Asthma Education and Prevention Program Expert Panel Report 3: Guidelines for the Diagnosis and Management of Asthma” (2007) to improve the diagnosis, management and outcomes for children with asthma. Teams will:

  • Reduce the average number of hospitalizations for asthma patients in the

previous 6 months by 20%

  • Improve the percent of asthma patients classified as “well controlled” by

40%

‘-

11

Aim Statement Review

  • By June 2020, our aim is to increase the percentage of our patients with

persistent asthma with appropriately assessed level of current asthma control from 20% to 80% and to improve the percentage of patients with currently up to date and documented asthma action plans from 40% to 80%.

‘-

12

How will we know a change is an improvement?

slide-5
SLIDE 5

6/7/19 5

‘-

13

A Model for Learning and Change

The Improvement Guide, API, 2009

What are we trying to accomplish? How will we know a change is an improvement? What changes can we make that will result in improvement?

Model for Improvement

Plan Do Study Act

‘-

14

  • Quality Improvement is about changing

and improving care provided to patients

  • It is not about measurement.
  • However ……

How Do We Know That a Change is an Improvement?

‘-

15

Measurement Assumptions

  • LEARNING not judgement
  • LIMITATIONS do not negate value
  • FREQUENCY matters
  • VOICE of the systems
  • STORY of your work
slide-6
SLIDE 6

6/7/19 6

‘-

16

Performance Measurement in 3 Worlds

Aspect Improvement Accountability Research Aim Improve care Compare, reassure, spur change New knowledge Methods Test Observable Yes N/A. Evaluate current performance Test blind or controlled Bias Accept stable bias Adjust data to reduce bias Design to eliminate Sample Size Just enough data, small sequential samples N/A. Report 100% Just in case data Hypothesis Flexible

  • Yes. Revised as learn and test

No hypothesis Fixed hypothesis How to determine improvement Run or Shewhart charts No focus on change Hypothesis, Statistical tests: F- test, t-test, chi square, p value Testing Strategy Small sequential tests No tests 1 large test Data confidential Data used only by those involved in improvement No subjects. Data is for public Subjects protected ‘-

17

Measures

  • Outcome
  • Process
  • Balancing

‘-

18

A Closer Look

PROCESS MEASURES

  • Data collection may be time

limited

  • Are within your control
  • Are linked to your ideas

(changes)

  • Are a means to the ends – not

the ends

OUTCOME MEASURES

  • Are patient focused
  • Reflect how care is experienced

differently by a family

  • Sometimes take time to move

the marker

  • Are in your aim!
slide-7
SLIDE 7

6/7/19 7

‘-

19

Using your Data

  • Once you have collected data it is important to show it off!
  • How you graph your data has a major impact on what you can

do with it.

‘-

20

Run Charts

Run charts are graphs of data over time and are one of the single most important tools in performance improvement.

‘-

21

40% 45% 50% 55% 60% 65% J- 18 F- 18 M - 18 A

  • 18

M - 18 J- 18 J- 18 A

  • 18

S

  • 18

O - 1 8 N - 1 8 D - 1 8 J- 19 F- 19 M - 19 A

  • 19

M - 19 J- 19 J- 19 A

  • 19

S

  • 19

O - 1 9 N - 1 9

Observe a System

M easu r e 1 M edi an 40% 50% 60% 70% 80% 90% 100 % J- 18 F- 18 M - 18 A

  • 18

M - 18 J- 18 J- 18 A

  • 18

S

  • 18

O - 1 8 N - 1 8 D - 1 8 J- 19 F- 19 M - 19 A

  • 19

M - 19 J- 19 J- 19 A

  • 19

S

  • 19

O - 1 9 N - 1 9

Identify Improvement

M easu r e 1 M edi an 40% 50% 60% 70% 80% 90% 100 % J- 18 F- 18 M - 18 A

  • 18

M - 18 J- 18 J- 18 A

  • 18

S

  • 18

O - 1 8 N - 1 8 D - 1 8 J- 19 F- 19 M - 19 A

  • 19

M - 19 J- 19 J- 19 A

  • 19

S

  • 19

O - 1 9 N - 1 9

Sustained Improvement

M easu r e 1 M edi an 40% 50% 60% 70% 80% 90% 100 % J- 18 F- 18 M - 18 A

  • 18

M - 18 J- 18 J- 18 A

  • 18

S

  • 18

O - 1 8 N - 1 8 D - 1 8 J- 19 F- 19 M - 19 A

  • 19

M - 19 J- 19 J- 19 A

  • 19

S

  • 19

O - 1 9 N - 1 9

Identify Lost Gains

M easu r e 1 M edi an

slide-8
SLIDE 8

6/7/19 8

‘-

22

Key Elements of Data Collection

  • Research and Quality Improvement data are different
  • If you aren’t using it dont collect it
  • Look at your data often – use it to make decisions
  • Give data back to those who give it to you

‘-

23

“You can’t fatten a cow by weighing it Palestinian Proverb

‘-

24

What changes can we make?

slide-9
SLIDE 9

6/7/19 9

‘-

25

A Model for Learning and Change

The Improvement Guide, API, 2009

What are we trying to accomplish? How will we know a change is an improvement? What changes can we make that will result in improvement?

Model for Improvement

Plan Do Study Act

‘-

26

PDSA CYCLES

‘-

27

But there is more than one way to…

Bake a cake Drive to work Make a bed

slide-10
SLIDE 10

6/7/19 10

‘-

28

Plan Do Study Act

DO Carry out the plan Document observations – successes/unexpected issues Begin analysis of data

ACT

Select an action based on the results of the test:

  • Adopt
  • Adapt
  • Abandon

PLAN Prediction If ____ Then____ Plan to carry out the test (who, what, when?) Plan for data collection STUDY Compare to prediction What did you learn What was unexpected What about the data ‘-

29

Planning for change: PDSA cycles

  • SMALL (VERY SMALL) tests of change
  • 1 provider, 1 nurse, 1 patient, 1 intervention
  • Over and over (and over) again – same

scenarios, different scenarios

  • Reflect on each one – adapt / adopt, real time

change

‘-

30

Use of the PDSA Cycle

Proposals, Theories, Ideas Changes That Result in Improvement A P S D A P S D A P S D D S P A Learning from Data

PDSA’s will grow each time

slide-11
SLIDE 11

6/7/19 11

‘-

31

Common Hang Ups

  • Starting too big
  • Decision by committee
  • Implementing too quickly
  • Decisions without data
  • Spreading too quickly
  • Tasking not testing
  • Talking not doing

‘-

32

Resources

  • IHI -

http://www.ihi.org/education/IHIOpenSchool/resources/_layouts/ihi/pages/videos/ViewAll.aspx?tc=14 896aaa-7504-4ba1-88f6- 647b6a096de9&tcOp=Or&ttl=Improvement+Capability&TargetWebPath=/education/ihiopenschool/re sources&sort=ModifiedDate%7CDescending&xchildtags=1

  • NICHQ - http://www.nichq.org/QI_101/story_html5.html?lms=1
  • Books:

‘-

33

Thank You!

slide-12
SLIDE 12

6/7/19 12

‘-

34

Questions