SLIDE 1
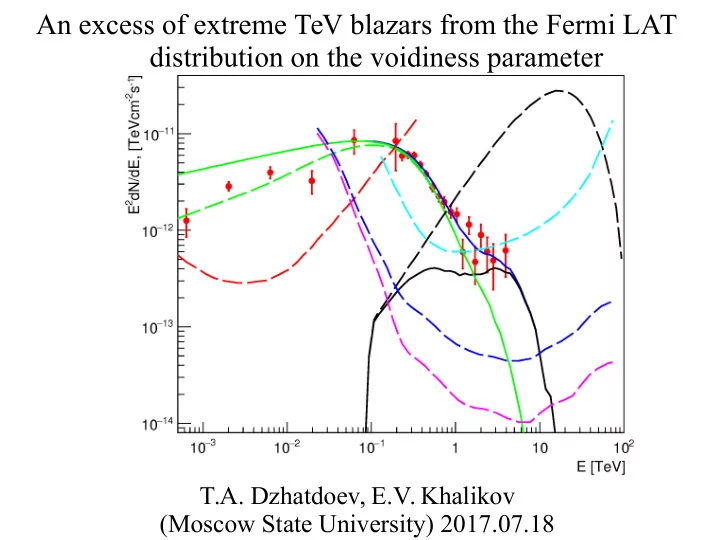
An excess of extreme TeV blazars from the Fermi LAT distribution on the voidiness parameter
T.A. Dzhatdoev, E.V. Khalikov (Moscow State University) 2017.07.18
SLIDE 2
E0 ― primary energy of a γ-ray (source restframe) Ep0 ― primary energy of a proton (source restframe) z ― redshift; τ ― γγ pair production optical depth; γ ― spectral power-law index (when γ is a number) HE ― high-energy (E>100 MeV); VHE ― very high energy (E>100 GeV) EBL ― extragalactic background light; EGMF ― extragalactic magnetic field CMB ― cosmic microwave background PP ― pair production γγ→e+e- IC ― inverse Compton e-γ→e-'γ' or e+γ→e+'γ' SED ― spectral energy distribution K12 ― Kachielriess et al., Comp. Phys. Comm., 183, 1036 (2012) BK16 ― Berezinsky & Kalashev, Phys. Rev. D, 94, 023007 (2016) BW15 ― Biteau & Williams, ApJ, 200, 58 (2015) KD10 ― Kneiske & Dole, A&A, 515, A19 (2010) G12 ― Gilmore et al., MNRAS, 422, 3189 (2012) H16 ― Horns, astro-ph/1602.07499 (2016) HM12 ― Horns & Meyer, JCAP, 033 (2012) NV10 ― Neronov & Vovk, Science, 328, 73 (2010)
Some abbreviations and definitions
SLIDE 3 Typical AGN geometry (left, 1) and SED of blazar (right, 2); SED of EBL for several models (bottom, 3)
1 C.M. Urry, P. Padovani, PASP, 107,
803 (1995); more details in: R. Antonucci, ARA&A, 31, 473 (1993)
2 M. Boettcher et al., ApJ, 768, 54 (2013) 3 EBL model KD10 is shown by red dashed
line
Extreme TeV blazars: high-energy peak in the SED at E>1 TeV, usually slow variability
SLIDE 4
The technique of calculations: Dzhatdoev et al., A&A, 603, A59 (2017) (astro-ph/1609.01013) (hereafter D17) We are grateful to A. Kircheva and A. Lyukshin who participated in D17. D17 includes 6 extreme TeV blazars, 10 spectra (see Table 1 for journal references), (24 pages, ~70 plots) Cascade calculations: ELMAG (K12) E-mail for question and/or comments: timur1606@gmail.com
SLIDE 5
Some Fermi LAT blazars tend to be located towards the voids in the large scale structure (Furniss. et al., MNRAS, 446, 2267 (2015) (F15), significance ~2.5 σ)
SLIDE 6
In these cases, observed flux is usually much higher (Furniss. et al., MNRAS, 446, 2267 (2015), significance ~2.5 σ); x: voidiness runs from 0 to 1 EGMF-dependent effects? (for current state of EGMF constraints see NV10 and many citing papers)
SLIDE 7
A model of 1ES 1218+304 spectrum. B= 0.1 fG, L= 5 Mpc Magnetic suppression factor: from Alves Batista, astro-ph/1704.05137 (z=0.13 instead of 0.182).
SLIDE 8
HESS 100 hours Fermi LAT 10 years CTA 100 hours CTA 1000 hours
Prediction: CTA will discover a new population of blazars with very hard spectra for the case of lines-of-sight with small voidiness
SLIDE 9
Another model of 1ES 1218+304 spectrum. B= 1 fG, L= 1 Mpc. Why an order of magnitude difference with the previous result?
SLIDE 10
Why an order of magnitude difference with the previous result? The estimate below is from Neronov & Semikoz, Phys. Rev. D, 80, 123012 (2009); Alves Batista et al., Phys. Rev. D, 94, 083005 (2016)) The factor 5 comes from different assumed z, primary energy and D; other factor of ~2 – the result of different assumed EGMF structure and other issues
SLIDE 11
But maybe the model is far too speculative and is not supported by other studies?
SLIDE 12 Arsioli & Chang A&A 598, A134 (2017) found a plenty of blazars with hard primary spectra in Fermi LAT data (of course, TS is usually lower than in the
- fficial Fermi LAT catalogues)
SLIDE 13
Other effects? Yes(!) The combined statistical significance of the following “anomalies” (deviations from the absorption-only model) is 6-7 σ
Electromagnetic cascade model of extragalactic -ray γ propagation applied to blazars
Aharonian et al., A&A, 349, 11 (1999) Aharonian et al., A&A, 384, 834 (2002) d’Avezac et al., A&A, 469, 857 (2007) Murase et al., ApJ, 749, 63 (2012) Takami et al., ApJ Lett., 771, L32 (2013) D17
SLIDE 14
The high-energy anomaly (HM12, H16) ― colored symbols denote absorption-corrected data (significance: originally 4.2 σ). A similar effect: Rubtsov & Troitsky, JETP. Lett., 100, 355 (2014)
SLIDE 15
SLIDE 16
SLIDE 17
SLIDE 18
The ratio of best-fit model spectra for electromagnetic cascade model and the absorption-only model. Electromagnetic cascade model predicts up to 3 times more flux at E=8 TeV
SLIDE 19 Indication for a magnetically broadened cascade (Chen et al., Phys.
- Rev. Lett., 115, 211103 (2015), p-value~0.01), EGMF: B= 0.01-1 fG
A likelihood ratio map is shown
SLIDE 20
Hadronic cascade model of blazar emission Uryson, JETP, 86, 213 (1998) Essey & Kusenko, APh, 33, 81 (2010) Essey et al., Phys. Rev. Lett., 104, 141102 (2010) Essey et al., ApJ, 731, 51 (2011) Murase et al., ApJ, 749, 63 (2012) Takami et al., ApJ Lett., 771, L32 (2013) Essey & Kusenko, APh, 57, 30 (2014) Zheng et al., A&A, 585, A8 (2016) D17, our version: Blazar emits >1 EeV protons (luminosity and spectrum: Tavecchio 2014). The source is embedded in galaxy cluster (Meyer et al., 2013, central magnetic field B0). The proton beam may encounter another cluster at z0
SLIDE 21
SLIDE 22
Constraints on hadronic cascade models. B0= magnetic field strength in the center of the cluster, zc= the termination redshift of the proton beam, in color: significance of exclusion
SLIDE 23
SLIDE 24
SLIDE 25
The Cherenkov Telescope Array (CTA): low threshold (20 GeV), improved sensitivity and angular resolution Our work may be interesting for astrophysicists working with space-based telescopes such as Fermi LAT, GAMMA-400, and the emulsion gamma-ray telescope GRAINE
SLIDE 26 Conclusions
- I. There are several indications that the absorption-
- nly model is incomplete
- II. Electromagnetic cascade model may, in principle,
explain all these effects
- III. If the effect of F15 is not a statistical fluctuation,
there should be a new, still not discovered population
- f blazars with very hard spectra (“flood-effect”).
- IV. Extragalactic magnetic field strength and structure
is unknown; the values (in voids!) of 1 aG – 1 fG on the 1 Mpc scale are still viable
SLIDE 27
Additional slides
SLIDE 28
Angle distribution of the MBC pattern (computed with the code of Fitoussi et al., MNRAS, 466, 3472 (2017)). E0= 10 TeV, observable energy 9-11 GeV, pencil- beam; B= 0.1 fG, L= 1 Mpc. Black – max. positional polar angle 0.01 rad, red – 0.03 rad, green – 0.1 rad, blue – 0.3 rad
SLIDE 29
Smeared and integral angle distributions of the MBC pattern. B= 0.1 fG, L= 1 Mpc
SLIDE 30
Integral angle distribution of the MBC pattern. B= 0.1 fG, L= 1 Mpc
SLIDE 31
“Delta-plot”, cascade spectra for primary monoenergetic emission (ELMAG (K12) and ECS)
SLIDE 32
Inoue et al., ApJ, 768, 197 (2013)
SLIDE 33
Gamma-ray horizon (from HM12, EBL model: KD10)
SLIDE 34 aa 34
The ratio of the optical depth (blue ― KD10 as implemented in ELMAG 2.02, black ― G12 model) to the one for the original KD10 model. Solid ― z= 0.186, dashed ― z= 0.287.
SLIDE 35
SLIDE 36
For further classification of hadronic cascade models see D16, Section 4
SLIDE 37
SLIDE 38
Impact of voidiness (K= 1.0, 0.6, 0.4, 0.3, 0.2).The source is 1ES 0229+200 (z= 0.188). The high-energy part is better fitted for K<0.6, the low-energy part ― for K from 0.3 to 0.6.
SLIDE 39
The ratio of best-fit model spectra for electromagnetic cascade model and the absorption-only model
SLIDE 40 Constraints on the EGMF (the first such paper Neronov & Vovk, Science, 328, 73 (2010) obtained B>0.3 fG, later this bound was relaxed by several orders
- f magnitude (variability!), e.g. Dermer et al., ApJ Lett., 733, L21 (2011))
No MBC, but it is still possible to
(PH) Magnetically broadened cascade (MBC) solution
SLIDE 41
Spectral signatures of the electromagnetic cascade model: 1) high-energy cutoff, 2) “ankle” 3) “magnetic cutoff” 4) second ankle.
B= 0
SLIDE 42 Signatures of the intergalactic electromagnetic cascade model (summary)
- I. Spectral signatures:
- 1. High-energy cutoff
- 2. Ankle
- 3. Magnetic cutoff
- 4. Second ankle
- II. Angular signatures:
- 5. Magnetically broadened cascade (MBC) and/or
- 6. Pair halo (PH)
- III. Timing signatures. Example: energy-dependent delay
- IV. Signatures in a sample of objects. Example:
voidiness-dependent effect of F15