
SLIDE 1
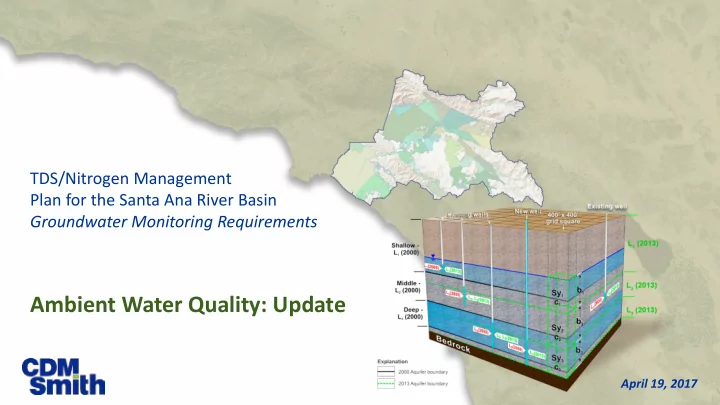
TDS/Nitrogen Management Plan for the Santa Ana River Basin Groundwater Monitoring Requirements
Ambient Water Quality: Update
April 19, 2017
Ambient Water Quality: Update April 19, 2017 Point Statics for - - PowerPoint PPT Presentation
TDS/Nitrogen Management Plan for the Santa Ana River Basin Groundwater Monitoring Requirements Ambient Water Quality: Update April 19, 2017 Point Statics for 20-Year Moving Average 1. Annualized Averages 2. At least 3 years of water quality (TDS
April 19, 2017
2
3
4
5
0.0 0.5 1.0 1.5 2.0 5 10 15 20 25
Normal Quantile NO3-N
1003134
0.0 0.5 1.0 1.5 2.0 5 10 15 20 25
Normal Quantile NO3-N
1003134
6
0.0 0.5 1.0 1.5 2.0 2.5 5 10 15 20 25
Normal Quantile NO3-N
1003134
0.0 0.5 1.0 1.5 2.0 5 10 15 20 25
Normal Quantile NO3-N
1003134
7
0.0 0.5 1.0 1.5 2.0 2 4 6 8 10 12 14 16
Normal Quantile NO3-N
1003134
0.0 0.5 1.0 1.5 2.0 5 10 15 20 25
Normal Quantile NO3-N
1003134
8
0.0 0.5 1.0 1.5 2.0 2.5 2 4 6 8 10 12
Normal Quantile NO3-N
1003134
0.0 0.5 1.0 1.5 2.0 5 10 15 20 25
Normal Quantile NO3-N
1003134
9
0.0 0.5 1.0 1.5 2.0 0.5 1 1.5 2 2.5 3 3.5
Normal Quantile NO3-N
1003134
0.0 0.5 1.0 1.5 2.0 5 10 15 20 25
Normal Quantile NO3-N
1003134
10
0.0 0.5 1.0 1.5 2.0 5 10 15 20 25
Normal Quantile NO3-N
1003134
0.0 0.5 1.0 1.5 2.0 5 10 15 20 25
Normal Quantile NO3-N
1003134
11
12
14
1996 – 2015 AWQ Data
Fail
Pass Shapiro- Wilks Test
MDV 5x (NO3-N) /10x (TDS)
Remove MDV Mean +SE UCL84 Fail
S-W Log Transform
No Pass GM + GSE UCL84 Mean Median
n < 3 or Detects = 0
Yes No Yes No Yes
Remove MTV <2 & Max C >1
16
5000 10000 15000 20000 25000 30000 35000 40000 Period 1 2000 2003 2006 2009 2012 [CELLRANGE] [CELLRANGE] [CELLRANGE] [CELLRANGE] [CELLRANGE] [CELLRANGE]
Annualized Nitrate Samples and Outliers Removed
Nitrate Nitrate Outliers 5000 10000 15000 20000 25000 30000 35000 40000 Period 1 2000 2003 2006 2009 2012 [CELLRANGE] [CELLRANGE] [CELLRANGE] [CELLRANGE] [CELLRANGE] [CELLRANGE]
Annualized TDS Samples and Outliers Removed
TDS TDS Outliers