
SLIDE 1
ALTIUM FULL YEAR INVESTOR PRESENTATION
Aram Mirkazemi CEO Joe Bedewi CFO Kim Besharati VP IR 21-24 August 2018 Sydney
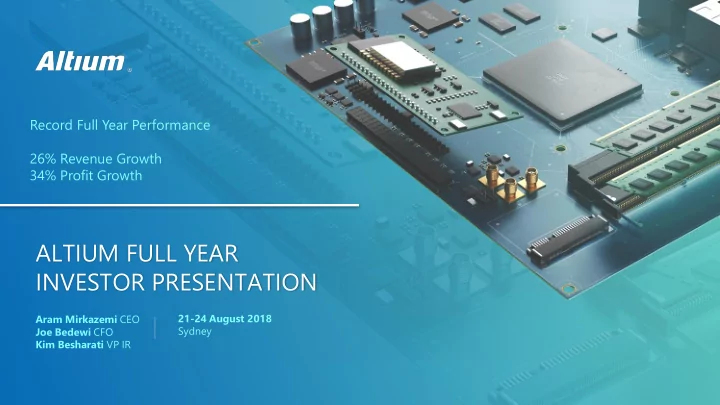
Record Full Year Performance 26% Revenue Growth 34% Profit Growth
ALTIUM FULL YEAR INVESTOR PRESENTATION 21-24 August 2018 Aram - - PowerPoint PPT Presentation
Record Full Year Performance 26% Revenue Growth 34% Profit Growth ALTIUM FULL YEAR INVESTOR PRESENTATION 21-24 August 2018 Aram Mirkazemi CEO Sydney Joe Bedewi CFO Kim Besharati VP IR Disclaimer Future performance - Forward looking
Aram Mirkazemi CEO Joe Bedewi CFO Kim Besharati VP IR 21-24 August 2018 Sydney
Record Full Year Performance 26% Revenue Growth 34% Profit Growth
2 Future performance - Forward looking statements, opinions and estimates provided in this presentation are based on assumptions and contingencies which are subject to change without notice, as are statements about market and industry trends, which are based on interpretations of current market conditions. Forward looking statements including projections, guidance on future earnings and estimates are provided as a general guide only and should not be relied upon as an indication or guarantee of future
and unknown risks, some of which are beyond the control of Altium Limited. No representation or warranty, express or implied, is made as to the fairness, accuracy, completeness or correctness of the information, opinions and conclusions contained in this presentation. To the maximum extent permitted by law, none of Altium employees, its directors, employees or agents, nor any other person accepts any liability, including, without limitation, any liability arising out of fault or negligence, for any loss arising from the use of the information contained in this presentation. In particular, no representation
likelihood of achievement or reasonableness of any forecasts, prospects or returns contained in this Presentation nor is any obligation assumed to update such information. Such forecasts, prospects or returns are by their nature subject to significant uncertainties and contingencies. Before making an investment decision, you should consider, with or without the assistance of a financial adviser, whether an investment is appropriate in light
Financial data All dollar values are in US dollars (US$) unless as otherwise presented. This presentation has been prepared by Altium Limited (ACN 009 568 772) and is for information purposes only. It does not constitute financial product or investment advice or a recommendation to acquire Altium shares and has been prepared without taking into account the objectives, financial situation or needs
Before making an investment decision prospective investors should consider the appropriateness of the information having regard to their
appropriate to their jurisdiction. Altium is not licensed to provide financial product advice in respect of Altium shares. Altium, Altium Designer, Altium Vault, Ciiva, Circuitmaker, Circuistudio, Octopart, SolidWorks, Protel and Tasking, and their respective logos, are trademarks or registered trademarks of Altium Limited, or its subsidiaries. All
the property of their respective owners, and no trademark rights to the same are claimed
2018 Full Year Financial Performance & Metrics
4
Dominating the PCB Market - The Century Strategy Appendix: Company Overview Company Highlights & Significant Achievements
2 1 5 3
Market Opportunity and Driving Forces
$100M $60M $40M $20M
Revenue Revenue growth 2014
15% $71m
2015
13% $80.2m
2016
17% $93.6m
2018
$80M
18%
$0M
EBITDA/ EBITDA Margin 2017
$110.9m 26% $140.2m
$120M $140M
$44.9m 32.0% 12% $61.9m 14% $55m
р
2013 2012 Record EBITDA Margin of 32.0% (35.5% underlying) Record revenue growth of 26% 10% increase in subscriber seats to 37,917 15% increase in Altium Designer seats with 6,321 new licenses sold Strong net profit growth of 34%
4 $33.3m 30.0% $27.4m 29.3% $22.7m 28.3% $18.3m 25.9% $5.9m 9.5% $0.3m 0.5%
5
6,321
Altium Designer Seats Sold
(Up 15%)
$140.2m Revenue
(Up 26%)
$52.5m
Cash (Up 18%)
$37.5m
NPAT (Up 34%)
Debt Free A$2.93b
Market Cap
32.0%
EBITDA Margin
(Up from 30%)
(Up 10%) $44.9m EBITDA
(Up 35%)
$144.6m Sales
(Up 27%)
28.86c EPS
(Up 33%)
56%
Recurring Revenue A27c Dividend
(Up 17%)
18%
5 Year Revenue CAGR
$39.6m EBIT
(Up 34%)
$48.5m
Op Cash Flow
(Up 35%)
627 Employees
6
20% 10% 0% 10% 40% Last Twelve Months (LTM) Revenue Growth Rate Last Twelve Months (LTM) EBITDA Margin 20% 30%
LTM(1)
Revenue Growth % EBITDA Margin %
Altium Ansys Cadence Synopsys Dassault PTC Zuken Siemens Autodesk 26.0 10.7 8.1 13.0 2.9 7.8 6.2 3.2 6.3 32.0 46.8 30.1 25.0 32.6 19.4 12.1 12.0
58.0 57.5 38.2 37.9 35.5 27.2 18.3 15.1 1.9
Growth + Margin Company
EBITDA Margin Revenue Growth Rate
30% 45%
7
Core PCB business delivered 24% revenue growth - Altium Designer 18 accelerating adoption with all regions contributing double-digit growth Scaling China operations – opening a new sales office in Shenzhen and delivering 29% revenue growth with strong forward momentum NEXUS first large win – wholesale displacement of Mentor installation (approx. 150 seats) within a tier one automotive supplier Octopart continued to outperform - delivering 56% revenue growth with increased traffic and improved search experience TASKING closed largest ever deal - winning a US$7.3 million multi-year contract and delivering 23% revenue growth Acquired Smart Manufacturer Start-Up PCB:NG – bringing Altium a step closer to connecting the design space to manufacturing floor
BSD - EMEA
8
2015 2017
2020
2025 Strong Strategy, Leading Technology & Revenue Momentum $100 + Million Revenue & Expansion of Market Opportunity PCB Market Leadership & Emerging Leader in Systems Design
BSD - Americas Octopart TASKING NEXUS
30 - 32%
9 -10% 9 -10% 8 -10%
Transforming Electronic Design and its Realization 25 - 27%
BSD – Board and Systems Division (accounts for all PCB products excluding NEXUS)
2020 Target Revenue Breakdown
$200M
Revenue
35% +
EBITDA Margin
BSD – China
10 -12%
BSD – Rest of World
8 -10%
2018 Full Year Financial Performance & Metrics
4
Dominating the PCB Market - The Century Strategy Appendix: Company Overview Company Highlights & Significant Achievements
2 1 5 3
Market Opportunity and Driving Forces
Altium Designer Subscription Octopart TASKING Maintenance Altium Designer Term-based Licenses TASKING Term-based Licenses Other Recurring
40 20 60 80 100 120
$51.5 (36.8%)
US Millions
$49.1 (35.0%) $12.0 (8.5%) $5.3 (3.8%) $2.2 (1.6%) $1.5 (1.1%) $1.1 (0.8%) $5.0 (3.6%) $7.4 (5.3%) $0.9 (0.6%)
Total Revenue $140.2 (100%) Recurring Revenue $77.8 (55.5%) Non-recurring Revenue $62.3 (44.5%)
Nexus
$4.1 (2.9%)
140
10
Altium Designer New Perpetual Licenses * Services TASKING New Perpetual Licenses Other Non-recurring
* Altium Designer Perpetual Licenses drive future recurring revenue captured through Altium Designer Subscription.
BSD - Americas
5 Yr Revenue CAGR: 15% 5 Yr Recurring CAGR: 15% $5m $15m FY14 FY15 FY16 FY18 FY18 Revenue growth : 13% $25m $35m
BSD – EMEA USD
5 Yr Revenue CAGR: 17% 5 Yr Recurring CAGR: 17% FY18 Revenue growth: 38% $10m $20m $30m $40m
BSD – China
5 Yr Revenue CAGR: 14% 5 Yr Recurring CAGR: 16% $5m $10m $15m FY18 Revenue growth: 29%
Revenue Recurring
FY17
$45m FY13 FY12
10.4m 13.1m 15.4m 17.9m 19.7m 21.1m 26.2m 19.4m 22.1m 24.3m 32.3m 36.6m 39.6m 44.8m
FY14 FY15 FY16 FY18 FY17 FY13 FY12
7.6m 9.3m 12.2m 13.2m 12.9m 14.8m 20.7m 16.2m 17.8m 22.2m 22.5m 24.3m 28.1m 38.8m
FY14 FY15 FY16 FY18 FY17 FY13 FY12
0.7m 1.5m 2.1m 2.7m 2.2m 2.5m 3.1m 5.6m 7.4m 8.6m 9.3m 8.9m 11.2m 14.4m
11
BSD – Rest of World
5 Yr Revenue CAGR: 8% 5 Yr Recurring CAGR: 7% $8m $10m FY18 Revenue growth: 25% FY14 FY15 FY16 FY18 FY17 FY13 FY12
3.3m 3.5m 3.3m 3.6m 3.0m 3.8m 5.0m 7.6m 7.5m 7.2m 7.5m 7.9m 8.7m 10.9m
$4m $6m $2m
12
BSD – Total
5 Yr Revenue CAGR: 15% 5 Yr Recurring CAGR: 15% FY18 Revenue growth: 24% $20m $40m $60m $80m $100m FY14 FY15 FY16 FY18 FY17 FY13 FY12
22.0m 27.4m 33.1m 37.4m 37.8m 42.2m 54.9m 48.8m 54.8m 62.3m 71.7m 77.8m 87.6m 108.8m
Revenue Recurring
NEXUS *
5 Yr Revenue CAGR: 108% $2m FY18 Revenue growth: 29% $1m $4m $3m $5m FY14 FY15 FY16 FY18 FY17 FY13
0.1m 0.6m 0.9m 3.8m 4.8m 0.1m 0.5m 0.8m
5 Yr Recurring CAGR: 108%
4.1m 3.3m 2.0m 1.8m
* NEXUS was launched in FY18 and is the evolution of Altium’s Vault product. Revenue prior to FY18 represents Vault revenue.
13
TASKING
5 Yr Revenue CAGR: 19% 5 Yr Recurring CAGR: 19% $2m $4m $8m FY18 Revenue growth: 23% $6m $12m $10m
Revenue Recurring
$14m FY14 FY15 FY16 FY18 FY17 FY13 FY12
2.4m 2.8m 3.2m 3.4m 3.5m 4.3m 6.2m 6.0m 7.8m 7.7m 9.9m 11.8m 14.5m 6.9m
Octopart
$3m $6m $9m $12m 5 Yr Revenue CAGR: 48% FY18 Revenue growth: 56% FY14 FY15 FY16 FY18 FY17 FY13 FY12
1.5m 1.7m 2.5m 3.8m 5.1m 7.7m 12.0m
14
Subscription Pool
Americas EMEA
37,917 (+3,395) 15,828 (+1,026) 4,394 (+154) 25,000 15,000 10,000 5,000 20,000
14,329 (+1,634)
Jun-14 Jun-15 Jun-16 Jun-18
28,006 (+1,923)
Jun-17
Americas EMEA China
Altium Designer New Seats Sold
1,000 2,000 3,000
1,860 (+94) 1,896 (+215) 831 (+199)
FY14 FY15 FY16 FY18 FY17
5,520 (+339) 5,181 (+863) 4,318 (-337) 4,655 (-56) 35,000 34,522 (+3,388) 31,134 (+3,128) 4,000 5,000 6,000 6,321 (+801)
FY13
4,711 25,043
Jun-13
26,083 (+1,040)
1,734 (+293) Rest of World
3,366 (+581)
ч
China Rest of World
20,000 10,000 5,000 15,000 25,000 30,000 35,000 40,000
+4,510 +1,784
34,522 37,917
June 2017
New
June 2018
Rejoins & Upgrades Lapsed
Subscription Pool Size
45,000
15 +2,710 +971
New Rejoins & Upgrades Lapsed 5,274 29,248 5,897 32,020 Growth pool (Developed Countries) 88% renewal rate (FY17 - 86.6%) Constant pool (Developing Countries) 34% renewal rate (FY17 – 35.8%)
16
Margin One off Costs incl Acquisitions General & Administration
Operating Expenses as a Percentage of Revenue
20% 40% 60%
FY14 FY15 FY16 FY18 FY17
25.9% 80% 100%
Sales & Marketing
15.5% 41.6% 16.8% 28.3% 18.1% 35.7% 17.1% 29.3% 19.8% 33.9% 15.4% 30.0% 17.5% 32.1% 18.2% 2.3%
Research & Development
32.0% 18.2% 30.7% 15.5% 3.5%
R&D is driven by a high product release rate No Waste Culture – Every Dollar Counts We support a Value-Based Market but, we service this market with a commodity selling model
What Drives Altium’s Unique Operating Leverage?
1.6% 0.8% 0.2%
17
FY14 FY15 FY18 FY16 $10M $20M $30M $40M $50M $60M $70M $0 $22.0M $61.9M $38.1M $44.3M
Jun-18 Jun-17 Jun-16 Jun-15 $ '000 $ '000 $ '000 $ '000 Cash and cash equivalents 52,459 44,273 38,139 61,906 Trade and other receivables 38,799 32,672 30,406 20,704 Other current assets 4,171 2,861 1,548 1,955 Total current assets 95,429 79,806 70,093 84,565 Trade and other receivables 1,662 2,531 5,379 1,499 Property, plant and equipment 5,712 5,054 5,091 3,886 Intangible assets 49,068 40,459 33,508 Other non-current assets 82,120 82,946 82,301 81,622 Total non-current assets 138,562 130,990 126,279 87,007 Total assets 233,991 210,796 196,372 171,572 Trade and other payables 12,147 10,179 7,188 6,048 Tax liabilities 772 1,008 2,713 4,989 Provisions 6,784 7,600 3,568 1,908 Deferred revenue 43,989 38,436 32,234 28,773 Total current liabilities 63,692 57,223 45,703 41,718 Deferred tax liability 5,566 5,276 4,793 Provisions 3,974 703 4,230 1,202 Deferred revenue 6,035 6,958 9,038 6,091 Other liabilities 2,098 674 1,813 959 Total non-current liabilities 17,673 13,611 19,874 8,252 Total liabilities 81,365 70,834 65,577 49,970 Net assets 152,626 139,962 130,795 121,602 Contributed equity and reserves 138,260 137,452 135,571 131,767 Accumulated profits (losses) 14,366 2,510 (4,776) (10,165) Total equity 152,626 139,962 130,795 121,602
FY17 $52.5M FY13 $14.8M FY12 $13.2M
Cash and cash equivalents
18
Dividends paid/declared
FY14 FY15 FY16 5AUD¢ 10AUD¢ 15AUD¢ 20AUD¢ 25AUD¢
8 4 8 8 10 10 14
Final Interim
FY18 FY17 FY16 FY15 $ '000 $ '000 $ '000 $ '000 Operating Cash Flow 48,482 35,861 14,082 21,345 Capital Expenditure Payments for property, plant and equipment (2,824) (4,343) (2,720) (2,338) Payments for intangibles (748) (515) (250)
44,910 31,003 11,112 19,007 Cash flows from investing activities Payments for purchase of subsidiary, net of cash acquired (3,681) (603) (17,039) (947) Payments on contingent and deferred considerations (7,455) (3,580)
Proceeds from issue of shares
Dividends paid (25,633) (20,791) (17,631) (15,886) Repayment of borrowings (9) (51) (43) (66) Increase/(decrease) in cash and cash equivalents 8,132 5,978 (23,601) 42,074 Effects of exchange rate changes 54 156 (166) (2,217) Total increase/(decrease) in cash and cash equivalents 8,186 6,134 (23,767) 39,857
FY17 FY18
12 11 13
FY12 FY13
5 8 3
30AUD¢
19
USD millions
FY18 FY17 +/- % FY16 FY15 Revenue (excl. interest) 140.2 110.9 26% 93.6 80.2 Reported expenses 95.3 77.6 23% 66.2 57.5
90.3 75.1 20% 64.7 56.9
5.0 2.5 96% 1.5 0.6 EBITDA 44.9 33.3 35% 27.4 22.7 Depreciation and amortization 5.3 3.8 40% 2.7 1.3 EBIT 39.6 29.5 34% 24.7 21.4 Net interest 0.1
(0.1) 0.2 Profit before income tax 39.7 29.5 35% 24.6 21.6 Income tax expense 2.2 1.4 58% 1.6 (70.8) Profit after income tax 37.5 28.1 34% 23.0 92.4 FY18 FY17 FY16 FY15 EPS 28.86 21.70 17.89 74.84 Dividends (AU cents) 27 23 20 16 Key Margin Analysis EBITDA margin Underlying EBITDA margin Net profit before tax margin Net profit after tax margin Effective tax rate 32.0% 35.5% 28% 27% 5.6% 30.0% 32.3% 27% 25% 4.7% 29.3% 30.9% 26% 25% 6.5% 28.3% 29% 27% 115% N/A Balance Sheet (USD millions) Cash and equivalents Net assets 52.5 152.6 44.3 140.0 38.1 130.8 61.9 121.6 Operating cash flows 48.5 35.9 14.1 21.3
2018 Full Year Financial Performance & Metrics
4
Dominating the PCB Market - The Century Strategy Appendix: Company Overview Company Highlights & Significant Achievements
2 1 5 3
Market Opportunity and Driving Forces
21
22
23
Existing tools do not adequately address the needs of high-tech products Electronics is critical to speeding up cycles
24
CAM CAE PLM
MCAD - Mechanical Computer Aided Design ECAD - Electronic Computer Aided Design CAE - Computer Aided Engineering - Analysis and Simulation CAM - Computer Aided Manufacturing PLM - Product Lifecycle Management
25
Cloud System Embedded Software
Electronic CAD Mechanical CAD
Electrical CAD
26
PCB Design Space PCB Manufacturing Line
ADWS
Global Printed Circuit Board Market Estimated size: $80 - $100Bn Electronic Design Automation Tools Estimated size: $2 - $5Bn Electronic Design & Manufacturing Services Estimated size: $1,000 - $1,500Bn Global Semiconductor and Electronic Parts Manufacturing & Distribution Estimated size: $600 - $800Bn
Electronic Components
System Design
Board & Circuit Design Board Fabrication & Assembly Product Assembly
Requirements Validation
Estimated Industry Size
27
IoT requires the “Uberization” of the Electronics Industry - transforming electronic design and its realization
2018 Full Year Financial Performance & Metrics
4
Dominating the PCB Market - The Century Strategy Appendix: Company Overview Company Highlights & Significant Achievements
2 1 5 3
Market Opportunity and Driving Forces
29
similar to Desktop Publishing & Microsoft Office tools
WIN
TRANSFORM
2018
2010
2025
30
31
New Seats / Customers
6321 new licenses sold in FY18 New license growth estimated to be low or negligible
Subscription Pool
38,000 - the largest and the fastest growing in the industry Generally static or declining
Direct Sales Capability
90% + and growing direct sales No significant transactional sales force (only through resellers)
Approach to Partnership
Strategic Tactical
Revenue Growth
2-3X the average growth for the industry Below market growth
Software Technology
The only PCB design tool with unified design data model Separate design tools between layout and schematic
Software Release Frequency
Major Annual Updates Irregular and infrequent updates
32
Apple’s (Macintosh commercial 1984) style advertising to claim leadership and drive deep adoption across all segments of the market Introduce the next generation Atlassian-style (man-out-of-the-loop) transactional selling to expand capacity and reduce cost of sales Add capacity to Altium’s transactional sales to aggressively pursue competitive displacement Refocus Altium’s technical support and customer success to drive and facilitate customers transitioning from legacy CAD systems to Altium’s platform Make Altium software more accessible by reducing the upfront cost of ownership
33
Market Share by Revenue
This chart is produced using market data from Gary Smith EDA and Altium’s internal competitive model.
34
PLM CAE M-CAD E-CAD A Complete Suite of Engineering Software Tools
35
The proliferation of electronics through the rise of smart connected devices continues to drive growth for our business in the foreseeable future Altium will continue to drive top line growth and expand operating margin Altium is confident of achieving its 2020 targets of US$200 million revenue and EBITDA margin
Altium commits to the achievement of 100,000 Altium Designer subscribers before 2025 for market dominance Altium will continue to pursue partnership and M&A opportunities to support its long-term vision of creating a product design and realization platform that is centered around electronics
2018 Full Year Financial Performance & Metrics
4
Dominating the PCB Market - The Century Strategy Appendix: Company Overview Company Highlights & Significant Achievements
2 1 5 3
Market opportunity and Driving Forces
1985
1991
1999
37
2006
The company was founded by creating the first version of Altium Designer, Protel PCB Altium Launches Protel for Windows - World's first Microsoft Windows-based PCB design system Altium Successfully completes an IPO on Australian Stock Exchange Altium launches Altium Designer 6, the world’s first Native 3D PCB design software Altium launches Altium Designer 13 introducing DXP 2.0, its next generation integration platform
third-party developers 2- Altium relocated its HQ to California USA 1- Successful capital raising
1- Altium acquires Octopart, the #1 electronic parts search engine in the world 2- Altium acquires Ciiva, a cloud based electronic components management system Altium partners with Dassault Systemes SOLIDWORKS to deliver a specialized version of its PCB design software for SolidWorks users 1- Altium surpasses $US100 million revenue target and delivers $US110 million for financial year 2017 2- Altium acquires Upverter, the developer of the world’s first fully cloud, fully collaborative electronics design systems 3- Altium releases Altium Designer 18 and launches NEXUS 1- Altium creates a seamless online and offline design experience for a new breed of designers with Upverter 2.0 2- Altium acquires board manufacturing company PCB-NG, combining it with Ciiva to create the world’s first fully integrated design-to-realization channel
38
Bare Board Layout Film Assembled Board Circuit Diagram
Design Capture Layout Fabrication Assembly
39
Uncomplicated Value Proposition Direct Sales Force Free Technical Support Easy to Get Up and Running Easy to Learn, Easy to Use Easy to Maintain with No Hidden Costs
Altium’s DNA
40
41
42
43
Automotive Electronics & High-Tech Life Sciences Aerospace & Defence Consumer- Electronics Semiconductors Industrial Controls Research & Education Mobile Devices Computers
44
44
7.82 21.63 5.09 13.26 2.37 4.52 2.81 6.34 1.9 4.6
2014 2022 10 20 30 40 50 60
Total Revenue (Billions) CAD CAE CAM AEC EDA
13.9% 13.0% 8.3% 10.6% 11.8%
45
Computer Aided Design (CAD) Electronic Design Automation (EDA) Computer Aided Engineering (CAE) Computer Aided Manufacturing (CAM) Architecture Engineering & Construction (AEC)
Segments CAGR Revenue
Source: Transparency Market Research
46
Transformational Leadership Established Global Business User-Centric DNA
Building Strong Strategic Partnership Transforming Electronic Design & Its Realization Disciplined Execution to Achieve Market Leadership Building a Strong Partnership with Leading Engineering Software Companies to Connect ECAD with MCAD & PLM Maintaining Disciplined Execution and Remaining Single-Minded About PCB Market Leadership Being True to Our Deep Conviction that Altium’s Journey Will Bring About Transformation of the Electronics Industry
47
“Growing Revenue Strongly” and “Expanding Profit Margin” “Regular Product Releases” and “Delivering Next Generation Products” “High Volume Selling” and “Sophisticated Value Proposition”
Sales
People Finance
Product
“the Genius of AND”
“Diversity in Thinking” and “Aligned in Action and Purpose”
Diversity in Thoughts Perseverance Adaptability Agility Ingenuity Transparency
48
growth for our business in the foreseeable future
market dominance
vision of creating a product design and realization platform that is centered around electronics