
Algae Biomonitoring and Organic Pollution Septic Summit March 30,2017 Winooski Natural Resources Conservation District District Manager/ Staff Scientist Corrina Parnapy
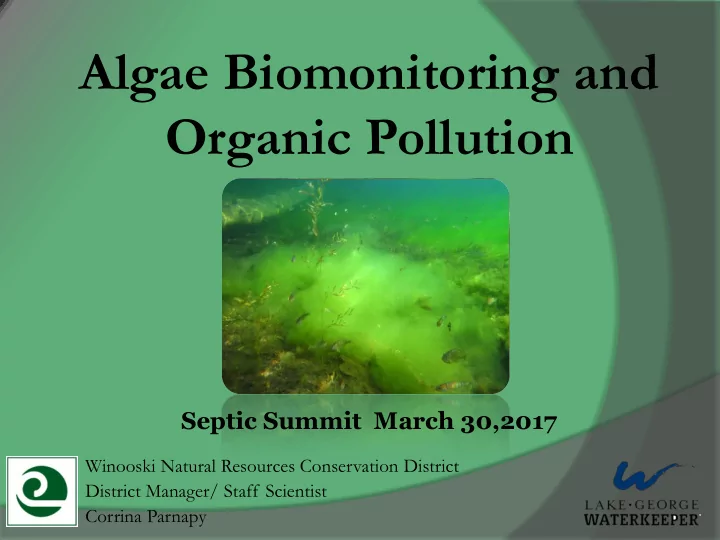
Algae • Base of the aquatic food web • Don’t have roots and draw nutrients directly from the water column as well as can draw from the substrate • Can be attached or floating • Can cause HAB’s……… • Used in wastewater treatment
Algae • Used reliably to determine water quality impact in monitoring efforts worldwide • Easily sampled and readily identified • Respond rapidly to nutrients • Have known requirements and tolerance levels
Algae in Biomonitoring • Biomonitoring- measuring biological responses to impacts • Used Worldwide in monitoring lakes, ponds and rivers • Metrics and protocols have been created and confirmed by Federal and State agencies worldwide.
Algae in Biomonitoring • Can pinpoint pollutants (organic pollution, chloride, heavy metals, sediment.) While sampling Chlorophyll a only estimates biomass of algae. (Chl-a has a poor relationship to algae in littoral zones of lower nutrient lakes ) • Can indicate organic pollution from septic spills even when coliform testing does not. (Coliform testing in moving waters, or the littoral zone with waves is not representative and can include non-human sources.)
Algae in Biomonitoring • Indicates excessive nutrients, even when water quality monitoring can’t detect phosphorus or nitrogen. (Chemical analysis only shows a snap shot in time of chemicals in the water, not sources or impacts.) Algae utilize any nutrients rapidly, removing them from the water column.
Algae in Biomonitoring • Periphyton rapidly utilize any additional nutrients before they can move offshore and be sampled through chemical analysis. • Even after any nutrients or pollutants have been diluted or utilized by plants and algae, the impact to the algae population remains. • You can tell water quality impacts by dominant forms, shifts in populations etc. Not just by biomass!
Algae and Organic Pollution Organic pollution influences algae populations more than any other factor! Organic pollution: biodegradable compounds that can be utilized by algae and plants. • Shifts dominate forms of algae to those less nutritious for fish and macroinverts and could potentially cause toxic conditions. • Algal abundance can be traced to ammonia
Palmer Algae Pollution Index (PPI) Verified, peer reviewed and utilized by Scientists worldwide. The Palmer Index assesses a specific group of algae associated with municipal sewage treatment plants and organic pollution, focusing on organic pollution levels. The Palmer algae pollution index was compiled from reports by 165 authors and ranks the species/ genera most often encountered in the waters with high rates of organic pollution. “Using this metric in combination with other metrics and data can assist in pinpointing sources of contamination to water bodies.”
Metrics to Narrow Down The Source Relative abundance and taxa richness • Forms of cyanobacteria within sample • • Percent Sensitive Diatoms • Pollution Tolerance Index (PTI) • Trophic Index (TRI) Salinity Index (SI) • Acidity Index (AI) • • Siltation Index (SI) • Similarity
Lake George Algal Studies Algal Biomonitoring has been used successfully in Lake George • and other bodies of water within the Adirondacks to identify organic pollution (septic issues), excessive nutrients, and chloride. • Since 2008 the Palmer Pollution Index has been used to identify Organic “waste” issues on Assembly Point, within Onieda Bay, Silver Bay, Diamond Point, and Dunham’s Bay, that have lead to the creation of a Wastewater Management District.
Lake George Algal Studies . Littoral algal monitoring in 2014 (79 samples) • 15% of the samples indicated organic pollution present, ranging from moderate to severe. (Palmer Index) • 73% of the samples indicated trophic impaction, indicating excessive nutrients present from fertilizers or stormwater runoff. • 83% of the samples contained forms of Cyanobacteria. Forms that could potentially cause a toxic condition. 6% of samples were dominated by forms of Cyanobacteria.
Lake George Algal Studies Dunham’s Bay Algal Samples • Sampling has taken place since 2008. • Algal biomonitoring was conducted along the littoral zone to identify potential faulty or under functioning septic systems. • Using the Palmer Index and other metrics it was determined that 5 of the sites fully analyzed indicated septic issues. • Resampling in summer 2016 showed that sites that have replaced or upgraded septic systems no longer score high on targeted metrics.
Lake George Algal Studies • Within Lake George sampling was conducted following known septic spills at Shepard Park and following the spill at the Sagamore. • Samples were collected from regional wastewater treatment facilities and treatment ponds to further verify metrics.
Lake George Algal Studies In Summer 2016 under the Lake George Septic Initiative, samples were collected, identified, analyzed and metrics applied. • PPI: 2 indicated probable organic pollution present and 2 indicate less organic pollution present. Regression analysis indicated a mild correlation between the Palmer metric and Total Nitrogen. • PTI: 4 indicated slight impact from pollution. • TI: 1 indicated severe impact, 3 indicated moderate impact and 7 indicated slight impact. • Eutrophic Forms: 17 sites had one or more forms of Eutrophic associated algal forms identified within the sample.
A Useful Tool • Incorporating algal biomonitoring into any monitoring effort is a valuable tool. • Using littoral algal sampling and specific metrics is a proven method to pinpoint sources and determine water quality impacts and provide direction on solutions. Specifically targeting organic waste associated with septic systems and wastewater treatment facilities. • Biomoitoring using algae showcases impacts and changes that water quality “chemical” monitoring ( Chl a, coliform, TN, TP) can’t detect.
Thank You Winooski Natural Resources Conservation District Corrina Parnapy, District Manager 617 Comstock Road, Suite 1 Berlin, VT 05602 corrina@winooskinrcd.org www.winooskinrcd.org The WNRCD focuses its resources on completing conservation projects within the areas of agricultural assistance, forestland enhancement, urban conservation and watershed stewardship.
Recommend
More recommend