
SLIDE 1
Jet Propulsion Laboratory California Institute of Technology
AIRS Outreach Jet Propulsion Laboratory California Institute of - - PowerPoint PPT Presentation
AIRS Outreach Jet Propulsion Laboratory California Institute of Technology Science Team Meeting Oct 2008 - Sharon Ray 1 The New AIRS Web Site Jet Propulsion Laboratory California Institute of Technology Launched 9/29/08 Check out the new AIRS
Jet Propulsion Laboratory California Institute of Technology
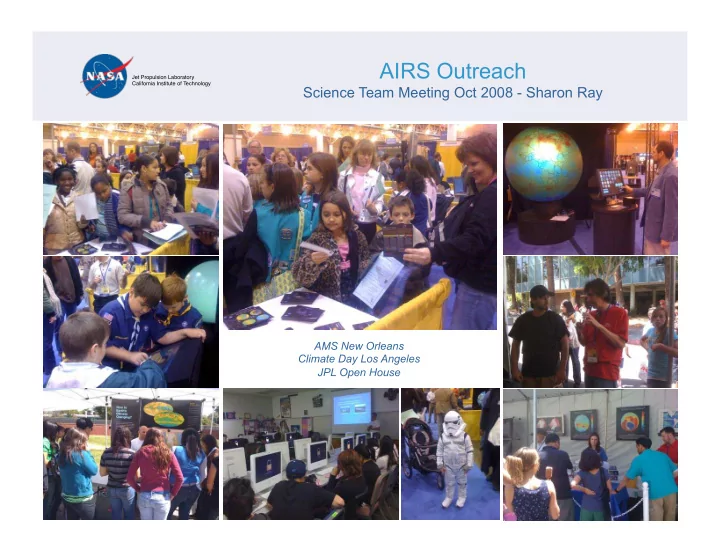
Jet Propulsion Laboratory California Institute of Technology
Jet Propulsion Laboratory California Institute of Technology
Jet Propulsion Laboratory California Institute of Technology
beginning of the mission
Image is zeroed out at night, builds up during the day as granules come in
Jet Propulsion Laboratory California Institute of Technology
Jet Propulsion Laboratory California Institute of Technology
Jet Propulsion Laboratory California Institute of Technology
Jet Propulsion Laboratory California Institute of Technology
Jet Propulsion Laboratory California Institute of Technology
Jet Propulsion Laboratory California Institute of Technology
October 09, 2008PASADENA, Calif.
global satellite maps of the key greenhouse gas carbon dioxide in Earth's mid-troposphere, an area about 8 kilometers, or 5 miles, above
contributes to climate change, is distributed in Earth's atmosphere and moves around our world.
Chahine, M. T., L. Chen, P. Dimotakis, X. Jiang, Q. Li, E. T. Olsen, T. Pagano, J. Randerson, and Y. L. Yung (2008), Satellite remote sounding of mid-tropospheric CO2, Geophys. Res. Lett., 35, L17807, http://dx.doi.org/10.1029/2008GL035022 9 September 2008
Jet Propulsion Laboratory California Institute of Technology
Jet Propulsion Laboratory California Institute of Technology
Jet Propulsion Laboratory California Institute of Technology
Jet Propulsion Laboratory California Institute of Technology
Jet Propulsion Laboratory California Institute of Technology
Jet Propulsion Laboratory California Institute of Technology
Jet Propulsion Laboratory California Institute of Technology
The development of a plug-in prototype GIS tool had, as a science driver, a case study examining the role of water vapor transport along an atmospheric river across the Pacific Basin in January
significant amounts of rain to fall over much of California, triggering mudslides that resulted in millions of dollars of damage and a dozen deaths. The study characterized the three-dimensional distribution of water vapor during the event and related surface winds and height-resolved water vapor to coastal rainfall. Measurements were supplied by a host of spaceborne instruments and one ground-based instruments. These measurements consisted of: water vapor from the AIRS instrument, surface winds from QuikSCAT, precipitation from TRMM, sea surface temperature from GHRSST, and integrated water vapor from SCIGN ground-based GPS. Back-in-time trajectories were provided by HYSPLIT. In this figure, a granule of AIRS water vapor data was subsetted to show the points with highest values of water vapor in the northeastern Pacific. These measurements are shown as a point cloud superimposed on a background of GHRSST sea surface temperatures, TRMM precipitation, and QuikSCAT wind vectors. To the right of the image, water vapor amounts from the SCIGN GPS network are shown color- coded by absolute magnitude for various stations. Back trajectories from the NOAA HYSPLIT model are shown as dotted lines, indicating the relationship between the atmospheric water vapor
the top center of the image.
Jet Propulsion Laboratory California Institute of Technology
Jet Propulsion Laboratory California Institute of Technology
present, focusing on NASA's programs and research in meteorology, stratospheric ozone depletion, and planetary climates and global warming. But the story is not only a scientific one.
environmental issues garnered strong public and political support in the 1970s, the following decades saw increased opposition to environmentalism as a threat to free market capitalism.
actors involved -- among them NASA, congressional appropriation committees, government weather and climate bureaus, and the military. "The author does an excellent job of telling this story -- translating the science into prose, characterizing the various personalities and institutions, organizing the convoluted tale into a narrative, and assessing interactions of multifarious factors. The work... will stand as a significant contribution to the literature. Much of the story has not yet been told, or if it has, certainly not in this detail or scope. It is likely to rank high in the top score or so of books devoted to the history of space science."
Johns Hopkins University Press http://www.press.jhu.edu/books/title_pages/9567.html