AGENDA Recycling Development Center Advisory Board Meeting October - - PowerPoint PPT Presentation

agenda
SMART_READER_LITE
LIVE PREVIEW

AGENDA Recycling Development Center Advisory Board Meeting October - - PowerPoint PPT Presentation

AGENDA Recycling Development Center Advisory Board Meeting October 14, 2020 | 9 am 12 pm (Pacific time) 9:00 am Welcome & review meeting goals Welcome! 9:10 am Updates 9:40 am Market development presentations We are conducting


slide-1
SLIDE 1

1

AGENDA

Recycling Development Center Advisory Board Meeting October 14, 2020 | 9 am – 12 pm (Pacific time)

9:00 am Welcome & review meeting goals 9:10 am Updates 9:40 am Market development presentations 11:00 am Presentation debrief 11:20 am Board work 11:50 am Wrap up 12:00 pm Meeting adjourned

Welcome!

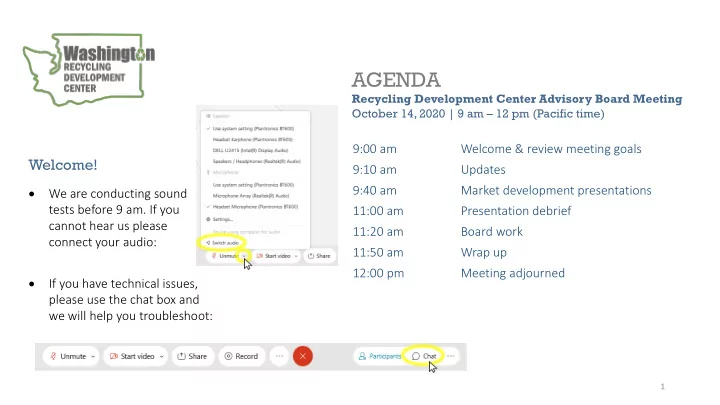
  • We are conducting sound

tests before 9 am. If you cannot hear us please connect your audio:

  • If you have technical issues,

please use the chat box and we will help you troubleshoot:

slide-2
SLIDE 2

Participating in this meeting:

Board m mem ember ers may unmute themselves. We will have opportunities for public comments throughout the meeting.

2

Note: we are not recording this meeting, meeting notes will be posted on the Advisory Board website.

Anyo yone may use the chat box to ask questions:

slide-3
SLIDE 3

3

Kara Steward Center coordinator Katherine Walton Facilitator …and many other staff at Ecology and Commerce. Tina Schaefer Center planner

This meeting is brought to you by:

Visit it t the A Advis isory B Board EZview web ebsite a at: t: www.ezview.wa.gov/site/alias__1962/37596/recycling_development_center_advisory_board.aspx

slide-4
SLIDE 4

4

Meeting goal:

Review and discuss work of recycling market development efforts in other states.

AGENDA

Recycling Development Center Advisory Board Meeting September 3, 2020 | 9 am – 12 pm (Pacific time) Visit it t the A Advis isory B Board EZview web ebsite a at: t: www.ezview.wa.gov/site/alias__1962/37596/recycling_development_center_advisory_board.aspx

9: 9:00 00 am m Wel elcome e & & revie iew m mee eetin ing g goa

  • als

ls 9:10 am Updates 9:40 am Market development presentations 11:00 am Presentation debrief 11:20 am Board work 11:50 am Wrap up 12:00 pm Meeting adjourned

slide-5
SLIDE 5

5

Updates:

  • Board roundtable
  • Center updates
  • Dept. of Commerce glass study
  • Data and Outreach subcommittee update
  • Comments from other attendees

AGENDA

Recycling Development Center Advisory Board Meeting September 3, 2020 | 9 am – 12 pm (Pacific time) Visit it t the A Advis isory B Board EZview web ebsite a at: t: www.ezview.wa.gov/site/alias__1962/37596/recycling_development_center_advisory_board.aspx

9:00 am Welcome & review meeting goals 9: 9:10 10 am Updates 9:40 am Market development presentations 11:00 am Presentation debrief 11:20 am Board work 11:50 am Wrap up 12:00 pm Meeting adjourned

slide-6
SLIDE 6

Board roundtable:

Allen Langdon Scott Morgan Mike Range Derek Ruckman Tim Shestek Jay Simmons Heather Trim Corinne Drennan Karl Englund Kyla Fisher Deb Geiger Margo Gillaspy Nina Goodrich Sego Jackson

6

slide-7
SLIDE 7

Tammi Vellinga and Rebecca Duncan

RESEARCH SERVICES, DEPARTMENT OF COMMERCE 10/14/2020

Broken Glass: Trash or Treasure?

An Examination of Glass Recycling in Washington State

slide-8
SLIDE 8

WASHINGTON STATE DEPARTMENT OF COMMERCE

8

CRIME IME VICTIM IMS & S & PUBLIC S LIC SAFETY Y BUSIN SINESS A S ASSIS ISTAN ANCE CE PLANNI NNING INFRA RASTRU TRUCTURE RE COMMU MMUNIT ITY F Y FACILIT ILITIE IES HOUS OUSING HOMELE LESSN SSNESS SS ENERGY GY COMMU MMUNIT ITY S Y SERVICE ICES

We strengthen communities

slide-9
SLIDE 9

Our Research

Overview

slide-10
SLIDE 10

WASHINGTON STATE DEPARTMENT OF COMMERCE

10

Washington’s Current Recycling State

  • Washington utilizes a predominantly

commingled recycling system, also referred to as mixed or single-stream

  • recycling. This requires residents to place

all recyclables into one bin at the curb. The materials in the bin are picked up by a recycling company and brought to a material recovery facility (MRF). The MRF sorts the material into individual commodity streams such as glass, paper, plastics, and metals.

  • According to 2016 data, Ecology reports

that 88% of people living in single-family homes and 77% of people in multi-family residences have access to curbside

  • recycling. The remaining population is

served by 192 recycling drop off locations.

slide-11
SLIDE 11

WASHINGTON STATE DEPARTMENT OF COMMERCE

11

Using Commingled Recyclables

Benefits of a commingled system For a collection system, there are many benefits for choosing an automated, "single bin" approach:

  • Easy collection
  • Increased participation by residents
  • Higher collection volumes
  • Greater public convenience and privacy
slide-12
SLIDE 12

WASHINGTON STATE DEPARTMENT OF COMMERCE

12

Using Commingled Recyclables

Limitations of a commingled system

  • Causes a need for separation
  • Damage to sorting equipment
  • Increased contamination
  • Increased costs for MRFs
  • Residents often hold the belief that everything can go in the

recycling bin, and it will get sorted and recycled

slide-13
SLIDE 13

WASHINGTON STATE DEPARTMENT OF COMMERCE

13

Contamination

  • Any item that

does not belong in the recycling process is a contaminant.

  • If plastic bags or

lids are mixed with paper, they contaminate the paper and reduce its value.

  • If glass is placed

in with other recyclables, it can break and contaminate the rest of the material.

slide-14
SLIDE 14

WASHINGTON STATE DEPARTMENT OF COMMERCE

14

Contamination

Contamination is a serious issue, it

  • Reduces efficiency
  • Destroys value
  • Leads to more waste going to landfills
slide-15
SLIDE 15

WASHINGTON STATE DEPARTMENT OF COMMERCE

15

Chinese Regulations

Previously, more than 60% of Washington’s recycled material was shipped to China. Beginning in July 2017, the Chinese government imposed new regulations – known as “National Sword 2017” and “Blue Sky 2018.”

  • These regulations restrict the import of low-grade and contaminated

recyclables.

  • The policy includes a strict 0.5% limit on the amount of contamination

allowed for other imported recyclables.

  • The new regulations on contamination levels have created an immediate

crisis.

  • Washington is particularly impacted due to the reliance on Chinese

markets because of the close proximity, relatively low cost, and ease of shipping recyclable materials to China.

slide-16
SLIDE 16

WASHINGTON STATE DEPARTMENT OF COMMERCE

16

Manufacturing and Recycling Glass

  • Glass is made from all-natural sustainable raw materials. It is the preferred

packaging for consumers concerned about their health and the environment. Consumers prefer glass packaging for preserving a product’s taste or flavor and maintaining the integrity or healthiness of foods and beverages. Glass is the only widely-used packaging material considered “GRAS” or “generally recognized as safe” by the U.S. Food and Drug Administration. (Source https://www.gpi.org/benefits-of-glass-packaging)

  • Manufacturing glass is a three-step process. Raw glass material is housed in

large silos at a location called the batch house. After leaving the batch house, the raw materials are fed into a furnace or tank where it is melted into glass. Once the glass is created, it goes through the forming process.

slide-17
SLIDE 17

WASHINGTON STATE DEPARTMENT OF COMMERCE

17

Glass Container Life Cycle https://www.gpi.org/glass-recycling-facts

slide-18
SLIDE 18

WASHINGTON STATE DEPARTMENT OF COMMERCE

18

Glass Life Cycle Flow Diagram

https://assets.noviams.com/novi-file-uploads/gpi/pdfs-and-documents/Learn_About_Glass/LCA_- _GPI2010_-_compressed.pdf

slide-19
SLIDE 19

WASHINGTON STATE DEPARTMENT OF COMMERCE

19

Glass Recovery

Once glass is used, it has four basic recovery

  • ptions:

1. Refill- Refillable bottles can be used about 25 times. Sterilizing and refilling a bottle uses about 93% less energy and 47-82% less water than making a new bottle. 2. Recycle- Glass bottles can be recycled repeatedly back to their original use without loss of quality or purity, with recycled glass substituted for up to 95% of raw materials and minimal material loss. 3. Beneficial use- Glass can be substituted as aggregate for filtration, sand replacement, abrasives, road/highway bed or fill, and alternative daily cover for landfills. 4. Landfill- Glass is disposed as trash.

https://nerc.org/documents/Glass/glass_hierarchy_oct_15_2019.pdf

slide-20
SLIDE 20

WASHINGTON STATE DEPARTMENT OF COMMERCE

20

Current Trends

  • In 2017, glass generation in all products was 11.4 million tons in the United

States, which was 4.2 percent of all material solid waste (MSW) generation.

  • The amount of recycled glass containers was three million tons in 2017, for

a recycling rate of 26.6 percent. The total amount of combusted glass in 2017 was 1.5 million tons. This was 4.3 percent of all MSW combustion with energy recovery that year.

  • In 2017, landfills received approximately seven million tons of MSW glass.

This was 4.9 percent of all MSW landfilled that year.

  • In the U.S. it is estimated that 66% of glass is not recycled, of which 43%

ends up as trash at a landfill.

  • In 2017, states with a glass deposit collection system had almost a 70%

glass recycling rate compared to the 12% rate in non-deposit states.

slide-21
SLIDE 21

WASHINGTON STATE DEPARTMENT OF COMMERCE

21

Flow across the Value Chain for Non-Redemption States.

Source: GPI, Northeast Glass Forum PowerPoint Presentation

slide-22
SLIDE 22

WASHINGTON STATE DEPARTMENT OF COMMERCE

22

Market Information for Recycled Glass

Recycled glass cullet can be used in a wide variety of products and manufacturing materials.

  • Containers/Bottles
  • Fiberglass
  • Roadway/Construction Applications

General Construction Backfill Roadway Construction Utility Construction Drainage Stationary loads Base course Pipe bedding Retaining wall backfill Landscaping fill Subbase or subgrade layer Trench backfill Foundation drainage Embankment Septage field media Sand fillers Drainage blanket French drains

slide-23
SLIDE 23

WASHINGTON STATE DEPARTMENT OF COMMERCE

23

Market Information for Recycled Glass

  • Fillers
  • Others
  • abrasive replacements like sand
  • making specialty glass
  • ceramics
  • bricks
  • astroturf
  • landscape applications
  • countertops
  • filtration media

Borosilicate Caulks/Adhesives Brick/Tile Coatings/Paint Plastics Flooring Aluminum Castings

slide-24
SLIDE 24

WASHINGTON STATE DEPARTMENT OF COMMERCE

24

Environmental Benefits

  • Saves raw materials - Over a ton of natural resources are conserved for every

ton of glass recycled, including 1,300 pounds of sand, 410 pounds of soda ash, 380 pounds of limestone, and 160 pounds of feldspar.

  • The container and fiberglass industries collectively purchase 3.2 million tons of

recycled glass annually, which is melted and repurposed for use in the production

  • f new containers and fiberglass products.
  • Lessens the demand for energy - Energy costs drop about 2-3% for every 10%

cullet used in the manufacturing process.

  • Cuts CO2 emissions - For every six tons of recycled container glass used, a ton
  • f carbon dioxide, a greenhouse gas, is reduced. A relative 10% increase in cullet

reduces particulates by 8%, nitrogen oxide by 4%, and sulfur oxides by 10%.

  • Extends furnace life - Including cullet in the manufacturing mix makes it less

corrosive and lowers the melting temperature (from 2800 degrees F. to 2600 degrees F.), prolonging furnace life.

slide-25
SLIDE 25

WASHINGTON STATE DEPARTMENT OF COMMERCE

25

A “Typical” MRF in 2018:

  • It is likely to be a single stream system.
  • If it is single stream, it may be confronting high residue rates. Trash, or "residue,"

contaminates recyclable materials, turning the whole bin into trash. Not only can co-mingling of trash and recyclables ruin your batch, but it can also contaminate

  • ther materials if it is dumped into the truck meant only for recyclables. If it's not

removed before it goes to the processing plant, the trash can damage expensive machinery used to separate recyclables. Rates, if glass is included could be in the range of 20 to 30%.

  • It is likely to process more than 100 tons per day.
  • Over the past several years, it has accepted more materials, particularly with

respect to fiber and plastics.

  • It is relying on highly mechanized sort systems with optical sorting equipment.
  • It is most likely owned and operated by a private firm.
slide-26
SLIDE 26

WASHINGTON STATE DEPARTMENT OF COMMERCE

26

MRF Technology

  • Single stream MRFs pushing technology
  • Continually evolving technologies within the MRF, i.e. robots,

A.I., new types of screens, separators.

  • Paradox
  • technology supports less sorting at the curb, while markets are

demanding a high quality product.

  • can drive up sorting costs in volatile market environment
slide-27
SLIDE 27

WASHINGTON STATE DEPARTMENT OF COMMERCE

27

Challenges to Single Stream Programs

  • High costs in reduced revenue environment. Average capital

cost for a new MRF is $11,000,000.

  • Facilities have broadened acceptable materials, but have seen

an increase in residue rates and handling costs.

  • Results
  • Increased emphasis on customer education
  • Tabling of additional equipment purchases
  • Cutting back of types of materials taken, particularly plastics and glass.
  • Sharing of market risks, implementation of processing fees. Base fees,

before revenue sharing, in range of $35 to $45 per ton, but can go above $65 per ton.

slide-28
SLIDE 28

WASHINGTON STATE DEPARTMENT OF COMMERCE

28

Return on Investment on Improving Glass Clean-up

https://nerc.org/documents/Webinars/Finding%20Opportunity%20in%20MRF%20Glass/Ellen%20Martin_CLF%20Presentati

  • n.pdf
slide-29
SLIDE 29

WASHINGTON STATE DEPARTMENT OF COMMERCE

29

Challenges to Improving Glass Recycling in Washington

  • Consensus among stakeholders

The stakeholders surveyed and interviewed indicated very little consensus as to the current key issues in the glass recycling market. For example, some stakeholders emphasized the importance of consumers in sorting, cleaning, depositing and appropriately recycling glass containers. Other stakeholders maintained that consumer actions had very little impact on the glass market, and the key issues were more with technology, transportation, and the material's market value. While having diversity in perspective among stakeholder perspectives is a strength when seeking ideas and problem solving, it can also be a challenge when it comes to advancing policy.

  • Policy/Legislation- lack of a bottle bill

Laws and deposit amounts differ from state to state, but all tend to:

 Improve the quality of glass collected for recycling.  Increase the percentage of containers going to bottle-to-bottle recycling.  Exclude some glass containers (like wine and liquor bottles).

slide-30
SLIDE 30

WASHINGTON STATE DEPARTMENT OF COMMERCE

30

Quantity versus Quality in Glass Collection

Source: GPI, Northeast Glass Forum Presentation

slide-31
SLIDE 31

WASHINGTON STATE DEPARTMENT OF COMMERCE

31

Recycling Markets Outside of Washington

  • Variety in markets outside of Washington –

different laws, different levels of development, different geography

  • Organizations and states addressing the gaps
  • Closed Loop Infrastructure Fund (CLIF)
  • Other states and countries
  • Variety of success with EPR, policy, amount of

recycled glass users in proximity depending on region

slide-32
SLIDE 32

WASHINGTON STATE DEPARTMENT OF COMMERCE

32

United States – Other Markets

  • Oregon
  • First ever Bottle Bill in US
  • 100% of responsibility on beverage industry
  • California
  • 1987 Bottle Bill
  • System of state-certified recyclers: MRFs, redemption centers,

registered curbside operations, drop-off sites, and retailers

  • All Beverage containers have California Refund Value (CRV)
  • Northeastern United States
  • Many states with beverage container deposit laws with high redemption
  • Working on contamination issues to increase glass price
slide-33
SLIDE 33

WASHINGTON STATE DEPARTMENT OF COMMERCE

33

Glass Recycling Infrastructure for the U.

  • S. Source: NERC Glass Forum Power Point
slide-34
SLIDE 34

WASHINGTON STATE DEPARTMENT OF COMMERCE

34

Outside of the United States

  • Canada
  • Every province has some sort of beverage container recycling program
  • Partial or full producer responsibility in several noteworthy programs
  • Ontario, Quebec, Manitoba, British Columbia (BC)
  • Recycle BC has innovative structure with flexibility for local jurisdictions
  • European Union
  • Double the glass recovery of the US
  • Many countries with EPR or deposit programs, starting from 1989 –

2016

  • European Landfill Directive laid the groundwork for recycling success
slide-35
SLIDE 35

WASHINGTON STATE DEPARTMENT OF COMMERCE

35

Recommendations

  • 1. Implement glass improvement programs at materials recovery
  • facilities. Promote programs that have clearly demonstrated their

ability to produce high-quality recycled glass suitable for reuse in the manufacture of new glass containers. Shift focus from quantity to quality.

  • 2. Create agency partnerships to develop procurement guidelines:

Department of Transportation, Ecology, and Commerce can, with recycling stakeholders, promote use of recycled glass in projects.

  • 3. Implement policies to increase the use of recycled material for

producing glass products and packaging by setting minimum recycled content targets.

slide-36
SLIDE 36

WASHINGTON STATE DEPARTMENT OF COMMERCE

36

Recommendations

  • 4. Create an Extended Producer Responsibility (EPR) Program to

transfer responsibility for end-of-life management for glass products and packaging.

  • 5. Increase awareness and education by developing partnerships

with glass recycling companies and communities to improve the quality and amount of recycled glass collected, recycled, and made available for purchase. Promote consistent messaging throughout the state emphasizing the importance of glass recycling. Enforcement of new policies or programs without educating the public will not be as effective.

  • 6. Work in collaboration with stakeholders and the community to build
  • n existing programs and establish new programs for collection

and recovery of beverage containers.

slide-37
SLIDE 37

WASHINGTON STATE DEPARTMENT OF COMMERCE

37

Next Steps – Future Research

  • Examine manufacturing usage of recycled glass material
  • Follow up on recent changes to other states’ legislation/system

improvements

  • Examine trends and challenges pertaining to non-recyclable

glass

  • Research current landfill practices and possible improvements
  • Explore alternative transportation methods or incentives
slide-38
SLIDE 38

www.commerce.wa.gov

Special thanks to:

Recycling Development Center Board Members Ecology Staff Commerce Staff

slide-39
SLIDE 39

www.commerce.wa.gov

Thank you!

Tammi Vellinga

tammi.vellinga@commerce.wa.gov 360-725-5038

Rebecca Duncan

rebecca.duncan@commerce.wa.gov 360-725-5040

slide-40
SLIDE 40

Data and Outreach subcommittee update:

Allen L n Lang ngdo don Scott Morgan Mike Range Derek R k Ruckm kman an Tim Shestek Jay S Simmo mmons Heather er T Trim Corinne nne Drenna nnan Karl Englund Kyla Fisher Deb Geiger Margo Gillaspy Nina na Goodr drich Sego Jackson

40

slide-41
SLIDE 41

Comments from attendees:

We want to hear from you!

If you would like to comment, plea ease w write e your n name in the e cha hat: We will unmute you to speak in the order that we see names in the chat. You may also write y e your commen ent i in the e chat and we will read it for you. Please keep your comment to under 2 minutes.

41

slide-42
SLIDE 42

42

Market development presentations:

  • Summary of other recycling market

development efforts

  • Matt Flechter, Michigan Dept. of Environment,

Great Lakes, and Energy (EGLE)

  • Anna DeLage, Recycling Market Development

program at the South Carolina Dept. of Commerce

  • Will Sagar, Southeast Recycling Development

Council (SERDC)

AGENDA

Recycling Development Center Advisory Board Meeting September 3, 2020 | 9 am – 12 pm (Pacific time) Visit it t the A Advis isory B Board EZview web ebsite a at: t: www.ezview.wa.gov/site/alias__1962/37596/recycling_development_center_advisory_board.aspx

9:00 am Welcome & review meeting goals 9:10 am Updates 9: 9:40 40 am m Market d devel elopmen ent p prese esentations 11:00 am Presentation debrief 11:20 am Board work 11:50 am Wrap up 12:00 pm Meeting adjourned

slide-43
SLIDE 43

Matt’s slides

43

slide-44
SLIDE 44

Recycling in SC

slide-45
SLIDE 45

Recycling Market Development

  • Track recycling’s economic impact
  • Provide sustainable materials

management consulting services for business and industry

  • Administer strategic campaigns to

advance recycling collection

  • Recycling Market Directory
  • Provide staff support to Recycling

Market Development Advisory Council

slide-46
SLIDE 46

Recycling Infrastructure 1993

1 recycled content paper mill 1 PET plastic reclaimer 3 textile recyclers 1 glass recycler

slide-47
SLIDE 47

Recycling Infrastructure 2020

4 Recycled content paper mills 1 tissue mill 10 PET plastic reclaimers/ 15 Industrial plastics processors 4 Steel mills 4 Textile recyclers 4 Tire recyclers 4 Electronics recyclers 1 Glass recycler 1 Carbon fiber recycler 1 Zinc recycler 1 Aluminum roller

slide-48
SLIDE 48

Economic Impact of Recycling

$13B

500 Businesses

300+ Biz

slide-49
SLIDE 49

Recycling Investments

Name Recycle Investment Jobs ACI Plastics plastics $10,000,000 DIRTT Environmental Solutions design, manufacture and install fully- customized environmental ly responsible interior environments $18,500,000 100 GlassWrx SC glass $15,100,000 63 Southern Environmental Solutions of the Carolinas, LLC (SESC) electronics $1,500,000 45 World Energy recycles used cooking oil $5,400,000 30 Total = 5 companies $50,500,000.00 238

RECYCLING INVESTMENT PAST FIVE YEARS

  • $1.5B Capital Investment
  • 2,667 Jobs
  • 40 Companies
slide-50
SLIDE 50

SC Recycling Markets Directory

slide-51
SLIDE 51

Questions? Contact Anna DeLage adelage@sccommerce.com

slide-52
SLIDE 52

Washington Recycling Development Center Advisory Board

October 14, 2020

slide-53
SLIDE 53

Sponsor Level Members

Platinum Sponsors

Gold Sponsor Silver Sponsors Bronze Sponsors

slide-54
SLIDE 54

Southeast Recycling Development Council

MISSION STATEMENT

Unite industry professionals, organizations, government agencies and individuals engaged in the business of recycling; to foster communications among those groups; to promote sustainable recycling programs; and, to coordinate education and public awareness activities related to recycling.

VISION

  • Increase collection and recovery of quality recyclable material;
  • Foster economic development via the recycling industry;
  • Create a greater awareness of the recycling industry’s impact in the southeast; and
  • Engage in other activities as permitted by law.
slide-55
SLIDE 55

Recycling

That recycling is beneficial for the environment is probably an uncontested proposition. What is becoming increasingly more

  • bvious is that recycling

contributes to the economic health of a state’s economy.

  • Dr. Frank Hefner

Department of Economics and Finance College of Charleston

slide-56
SLIDE 56

Recycling and Material Demand Impacts

SERDC Manufacturing Data

Plants Jobs Sales (millions) Alabama 42 17,350 $7,838 Arkansas 12 5,420 $1,710 Florida 28 4,884 $1,328 Georgia 49 13,151 $7,180 Kentucky 41 11,232 $5,171 Louisisana 13 4,887 $1,146 Mississippi 11 1,971 $1,947 North Carolina 60 14,142 $4,078 South Carolina 47 10,442 $5,563 Tennessee 40 7,730 $4,413 Virginia 19 6,759 $2,723

362 97,968 $43,097

ISRI Recycling Industry Data

Impact (millions) Jobs Wages (millions) Taxes (millions) Alabama $2,145 10,477 $539 $187 Arkansas $708 3,631 $173 $69 Florida $5,000 27,144 $1,487 $600 Georgia $2,457 12,385 $685 $232 Kentucky $1,846 8,350 $472 $164 Louisiana $1,303 5,510 $328 $92 Mississippi $812 3,717 $178 $66 North Carolina $3,436 15,909 $852 $314 South Carolina $1,790 9,163 $547 $194 Tennessee $26,229 12,521 $748 $256 Virginia $1,734 8,628 $501 $174 $47,460 117,435 $6,510 $2,348

slide-57
SLIDE 57

Current Issues for Recycling

  • Misinformation
  • Contamination
  • Fragmented messaging
  • Limited recycling access
  • Diverse MRF infrastructure
  • Processing fee increases

▫ Budget timeline

  • Strained local government budgets

▫ Exacerbated by Covid-19 impacts

slide-58
SLIDE 58

Recycling is not dead

$0.00 $20.00 $40.00 $60.00 $80.00 $100.00 $120.00 $140.00 $160.00 $180.00 $200.00

OCC $/ton

$/ton 17 yr Average

October 2020

slide-59
SLIDE 59

Measuring the MRF infrastructure

slide-60
SLIDE 60

MRF Study

Excess capacity available Robotics on a rapid rise

slide-61
SLIDE 61

SERDC Communicating Cost Reduction

  • More for Same or Same for Less in:

▫ Collection

 PAYT  Reduce collection frequency  Increase participation  Invest in automation  Service price increase, modest increase usually sufficient

▫ Processing & Market Quality

 Narrow materials collected  Consider dual stream, may or may not provide cost reduction  Clean up the stream  Film fees  Review processing contracts  Expand dropoff options

  • Outreach / Education

▫ Film fees ▫ Provide feedback, Oops, etc. ▫ Increase social marketing ▫ Use TRP resources ▫ Coordinate with common suit

slide-62
SLIDE 62

Recycle Right Tennessee

Standardized images and messaging for State, Community and County websites

  • Balance of text and images
  • Option for grid and maps for convenience centers
  • Printed versions provided as a pdf for downloading/printing
slide-63
SLIDE 63

Curbside

slide-64
SLIDE 64

What Communities Need to Keep Recycling as an Essential Service

Cities must see Cost-Benefit The Public must view Recycling as Essential Coordinated Effort to increase exposure of industry impact, opportunities, and benefits Form Coalitions

slide-65
SLIDE 65

Will Sagar Executive Director will.sagar@serdc.org (828) 507-0123

slide-66
SLIDE 66

66

AGENDA

Recycling Development Center Advisory Board Meeting September 3, 2020 | 9 am – 12 pm (Pacific time) Visit it t the A Advis isory B Board EZview web ebsite a at: t: www.ezview.wa.gov/site/alias__1962/37596/recycling_development_center_advisory_board.aspx

9:00 am Welcome & review meeting goals 9:10 am Updates 9:40 am Market development presentations 11:00 am Presentation debrief 11:20 am Board work 11:50 am Wrap up 12:00 pm Meeting adjourned WE ARE TAKING A SHORT BREAK

slide-67
SLIDE 67

67

Presentation debrief:

  • Did you hear anything from Matt, Anna, or Will

that resonated with you?

  • What lessons can we learn in Washington?
  • What are some challenges unique to

Washington State?

AGENDA

Recycling Development Center Advisory Board Meeting September 3, 2020 | 9 am – 12 pm (Pacific time) Visit it t the A Advis isory B Board EZview web ebsite a at: t: www.ezview.wa.gov/site/alias__1962/37596/recycling_development_center_advisory_board.aspx

9:00 am Welcome & review meeting goals 9:10 am Updates 9:40 am Market development presentations 11:00 00 am Presen esentation d debr ebrief 11:20 am Board work 11:50 am Wrap up 12:00 pm Meeting adjourned

slide-68
SLIDE 68

Comments from attendees:

We want to hear from you!

If you would like to comment, plea ease w write e your n name in the e cha hat: We will unmute you to speak in the order that we see names in the chat. You may also write y e your commen ent i in the e chat and we will read it for you. Please keep your comment to under 2 minutes.

68

slide-69
SLIDE 69

69

Board work:

  • Center Charter
  • Discussion of additional board representation
  • Questions or comments from other attendees

AGENDA

Recycling Development Center Advisory Board Meeting September 3, 2020 | 9 am – 12 pm (Pacific time) Visit it t the A Advis isory B Board EZview web ebsite a at: t: www.ezview.wa.gov/site/alias__1962/37596/recycling_development_center_advisory_board.aspx

9:00 am Welcome & review meeting goals 9:10 am Updates 9:40 am Market development presentations 11:00 am Presentation debrief 11:20 a 20 am Boa

  • ard w

wor

  • rk

11:50 am Wrap up 12:00 pm Meeting adjourned

slide-70
SLIDE 70

Center Charter:

70

slide-71
SLIDE 71

Discussion of additional board representation:

71

RCW 70A.240.040 Advisory board—Duties—Membership. (3) Except as otherwise provided, advisory board members must be appointed by the director in consultation with the department of commerce as follows: (a) One member to represent cities; (b) One member appointed by the Washington association of county solid waste managers to represent counties east of the crest of the Cascade mountains; (c) One member appointed by the Washington association of county solid waste managers to represent counties west of the crest of the Cascade mountains; (d) One member to represent public interest groups; (e) Three members from universities or state and federal research institutions; (f) Up to seven private sector members to represent all aspects of the recycling materials system, including but not limited to manufacturing and packaging, solid waste management, and at least one not-for-profit organization familiar with innovative recycling solutions that are being used internationally in Scandinavia, China, and other countries; (g) The chair of the utilities and transportation commission or the chair's designee as a nonvoting member; and (h) Nonvoting, temporary appointments to the board may be made by the chair of the advisory board where specific expertise is needed.

“The chair and cochair of the advisory board, Scott Morgan, chair and Karl Englund, cochair, were elected from among the members by a simple majority vote. Additional temporary appointments may be made by the chair of the Board, with agreement among the members, where specific expertise is needed. Board members may substitute an alternate to attend meetings on their behalf.”

ADVISORY B BOAR ARD CHAR ARTE TER

slide-72
SLIDE 72

Comments from attendees:

We want to hear from you!

If you would like to comment, plea ease w write e your n name in the e cha hat: We will unmute you to speak in the order that we see names in the chat. You may also write y e your commen ent i in the e chat and we will read it for you. Please keep your comment to under 2 minutes.

72

slide-73
SLIDE 73

73

Wrap up:

  • Board feedback on Legislative report due Oct 23
  • Next meeting: December 9, 2020

AGENDA

Recycling Development Center Advisory Board Meeting September 3, 2020 | 9 am – 12 pm (Pacific time) Visit it t the A Advis isory B Board EZview web ebsite a at: t: www.ezview.wa.gov/site/alias__1962/37596/recycling_development_center_advisory_board.aspx

9:00 am Welcome & review meeting goals 9:10 am Updates 9:40 am Market development presentations 11:00 am Presentation debrief 11:20 am Board work 11:50 a 50 am Wr Wrap u up 12:00 pm Meeting adjourned