
SLIDE 1
1
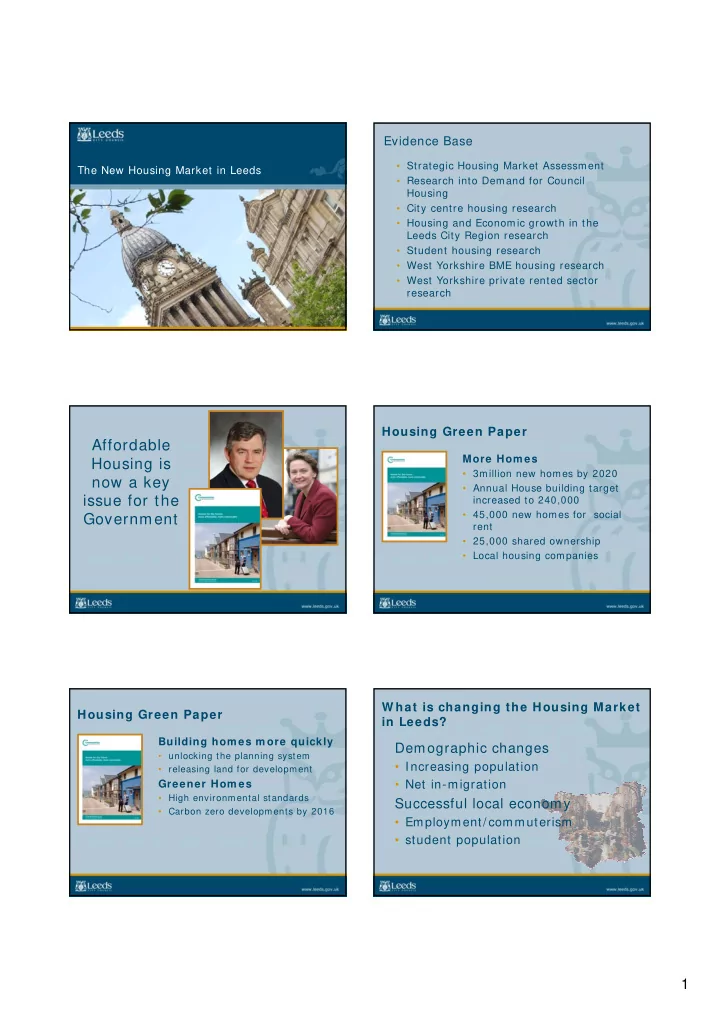
The New Housing Market in Leeds
Evidence Base
- Strategic Housing Market Assessment
- Research into Demand for Council
Housing
- City centre housing research
- Housing and Economic growth in the
Leeds City Region research
- Student housing research
- West Yorkshire BME housing research
- West Yorkshire private rented sector
research
Affordable Housing is now a key issue for the Government
Housing Green Paper
More Hom es
- 3million new homes by 2020
- Annual House building target
increased to 240,000
- 45,000 new homes for social
rent
- 25,000 shared ownership
- Local housing companies
Housing Green Paper
Building hom es m ore quickly
- unlocking the planning system
- releasing land for development
Greener Hom es
- High environmental standards
- Carbon zero developments by 2016
W hat is changing the Housing Market in Leeds?
Demographic changes
- Increasing population
- Net in-migration
Successful local economy
- Employment/ commuterism
- student population