
SLIDE 1
Adolfo Castro Chief Financial Officer July 2009 Company overview - - PowerPoint PPT Presentation
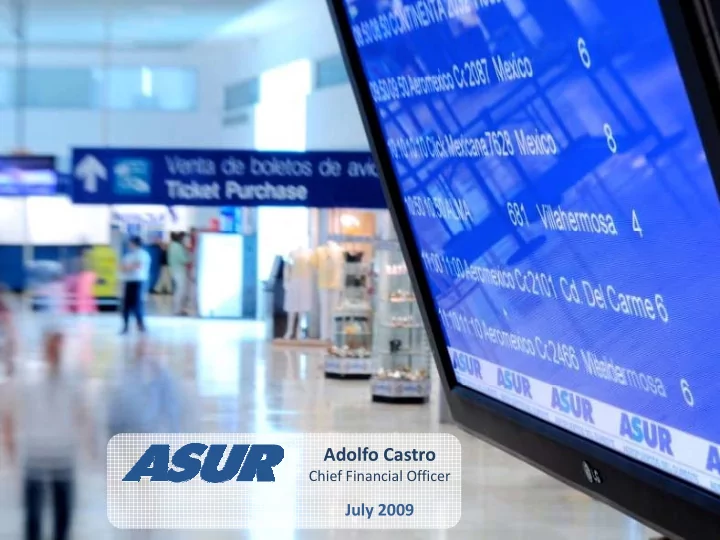
Adolfo Castro Chief Financial Officer July 2009 Company overview ASUR is mation tact Company with a 50 year concession period Company with a 50 year concession period Inform Con that operates 9 airports in the southeast
Corporate Governance Structure in ASUR
Landing at Villahermosa Airport
Corporate Governance Structure in ASUR
UK Li t d L d SE
Denmark Listed on Copenhagen SE
Germany Listed on Frankfurt SE
China Listed on Hong Kong SE
China Listed on Hong Kong SE
Austria Listed on Frankfurt SE Listed on London SE
Slovenia Listed on Ljubljana SE
Turkey Listed on Istanbul SE
Mexico
BMV, NASDAQ
Mexico
BMV, NYSE
China Listed on Hong Kong SE Listed on Ljubljana SE
Thailand Listed on Thailand SE
Australia Listed on Australian SE
New Zealand Listed on New Zealand SE
20 tact mation
* Transit and General Aviation excluded
16 18
Con Inform gic ers 10 12 14 Strate Matte al
6 8 10 Financia Informati al n 2 4 Operationa Information
Company Overview
(4.1) 14.0 10.9 (2.2) (1.8) 7.7 5.6 17.8 9.3 % of change YOY:
Apron & Contact Stand Veracruz Airport
tact mation
Con Inform gic ers
Strate Matte al
Financia Informati al n
Operationa Information
Company Overview
2000‐09 2000‐11 2001‐01 2001‐03 2001‐05 2001‐07 2001‐09 2001‐11 2002‐01 2002‐03 2002‐05 2002‐07 2002‐09 2002‐11 2003‐01 2003‐03 2003‐05 2003‐07 2003‐09 2003‐11 2004‐01 2004‐03 2004‐05 2004‐07 2004‐09 2004‐11 2005‐01 2005‐03 2005‐05 2005‐07 2005‐09 2005‐11 2006‐01 2006‐03 2006‐05 2006‐07 2006‐09 2006‐11 2007‐01 2007‐03 2007‐05 2007‐07 2007‐09 2007‐11 2008‐01 2008‐03 2008‐05 2008‐07 2008‐09 2008‐11 2009‐01 2009‐03 2009‐05
Apron & Contact Stand Cancun Airport
tact mation
10 6 11.6 12.6 13.6
0 5 0.6 0.6 0.7 0.7
0.4 0.4 0.4 0.4
Con Inform gic ers
6.6 7.6 8.6 9.6 10.6
Dic-99 Jun-00 Dic-00 Jun-01 Dic-01 Jun-02 Dic-02 Jun-03 Dic-03 Jun-04 Dic-04 Jun-05 Dic-05 Jun-06 Dic-06 Jun-07 Dic-07 Jun-08 Dic-08 Jun-09
0.3 0.3 0.4 0.4 0.5 0.5
Dic-99 Jun-00 Dic-00 Jun-01 Dic-01 Jun-02 Dic-02 Jun-03 Dic-03 Jun-04 Dic-04 Jun-05 Dic-05 Jun-06 Dic-06 Jun-07 Dic-07 Jun-08 Dic-08 Jun-09
0.3 0.3 0.3 0.3 0.3
Dic-99 Jun-00 Dic-00 Jun-01 Dic-01 Jun-02 Dic-02 Jun-03 Dic-03 Jun-04 Dic-04 Jun-05 Dic-05 Jun-06 Dic-06 Jun-07 Dic-07 Jun-08 Dic-08 Jun-09
Strate Matte al
1.2 1.3 1.4 1.5
0 2 0.2 0.2 0.2 0.2 0.2
0.5 0.6 0.6 0.7
Financia Informati al n
0.9 1.0 1.1
Dic-99 Jun-00 Dic-00 Jun-01 Dic-01 Jun-02 Dic-02 Jun-03 Dic-03 Jun-04 Dic-04 Jun-05 Dic-05 Jun-06 Dic-06 Jun-07 Dic-07 Jun-08 Dic-08 Jun-09
0.1 0.1 0.1 0.2
Dic-99 Jun-00 Dic-00 Jun-01 Dic-01 Jun-02 Dic-02 Jun-03 Dic-03 Jun-04 Dic-04 Jun-05 Dic-05 Jun-06 Dic-06 Jun-07 Dic-07 Jun-08 Dic-08 Jun-09
0.4 0.5
Dic-99 Jun-00 Dic-00 Jun-01 Dic-01 Jun-02 Dic-02 Jun-03 Dic-03 Jun-04 Dic-04 Jun-05 Dic-05 Jun-06 Dic-06 Jun-07 Dic-07 Jun-08 Dic-08 Jun-09
Operationa Information
0.2 0.2 0.2 0.3 0.3 0.3 0.3
0.6 0.7 0.8 0.9 1.0 1.1 1.2
0.6 0.7 0.8 0.9 1.0 1.1
Company Overview
0.2 0.2
Dic-99 Jun-00 Dic-00 Jun-01 Dic-01 Jun-02 Dic-02 Jun-03 Dic-03 Jun-04 Dic-04 Jun-05 Dic-05 Jun-06 Dic-06 Jun-07 Dic-07 Jun-08 Dic-08 Jun-09
0.5 0.6
Dic-99 Jun-00 Dic-00 Jun-01 Dic-01 Jun-02 Dic-02 Jun-03 Dic-03 Jun-04 Dic-04 Jun-05 Dic-05 Jun-06 Dic-06 Jun-07 Dic-07 Jun-08 Dic-08 Jun-09
0.5
Dic-99 Jun-00 Dic-00 Jun-01 Dic-01 Jun-02 Dic-02 Jun-03 Dic-03 Jun-04 Dic-04 Jun-05 Dic-05 Jun-06 Dic-06 Jun-07 Dic-07 Jun-08 Dic-08 Jun-09
tact mation
8 100 8,600 9,100 9,600 10,100
450 500 550
65 75 85 95
Con Inform gic ers
5,600 6,100 6,600 7,100 7,600 8,100
Dic-99 Jun-00 Dic-00 Jun-01 Dic-01 Jun-02 Dic-02 Jun-03 Dic-03 Jun-04 Dic-04 Jun-05 Dic-05 Jun-06 Dic-06 Jun-07 Dic-07 Jun-08 Dic-08 Jun-09
250 300 350 400
Dic-99 Jun-00 Dic-00 Jun-01 Dic-01 Jun-02 Dic-02 Jun-03 Dic-03 Jun-04 Dic-04 Jun-05 Dic-05 Jun-06 Dic-06 Jun-07 Dic-07 Jun-08 Dic-08 Jun-09
25 35 45 55 65
Dic-99 Jun-00 Dic-00 Jun-01 Dic-01 Jun-02 Dic-02 Jun-03 Dic-03 Jun-04 Dic-04 Jun-05 Dic-05 Jun-06 Dic-06 Jun-07 Dic-07 Jun-08 Dic-08 Jun-09
Strate Matte al
121 131 141 151 161 171
3 2 3.7 4.2 4.7 5.2
40 50 60 70 80
Financia Informati al n
91 101 111 121
Dic-99 Jun-00 Dic-00 Jun-01 Dic-01 Jun-02 Dic-02 Jun-03 Dic-03 Jun-04 Dic-04 Jun-05 Dic-05 Jun-06 Dic-06 Jun-07 Dic-07 Jun-08 Dic-08 Jun-09
2.2 2.7 3.2
Dic-99 Jun-00 Dic-00 Jun-01 Dic-01 Jun-02 Dic-02 Jun-03 Dic-03 Jun-04 Dic-04 Jun-05 Dic-05 Jun-06 Dic-06 Jun-07 Dic-07 Jun-08 Dic-08 Jun-09
20 30 40
Dic-99 Jun-00 Dic-00 Jun-01 Dic-01 Jun-02 Dic-02 Jun-03 Dic-03 Jun-04 Dic-04 Jun-05 Dic-05 Jun-06 Dic-06 Jun-07 Dic-07 Jun-08 Dic-08 Jun-09
Operationa Information
2.4 2.9 3.4 3.9 4.4 4.9 5.4 5.9
57 62 67 72 77
19 24 29 34 39 44 49 54 59
Company Overview
1.9 2.4
Dic-99 Jun-00 Dic-00 Jun-01 Dic-01 Jun-02 Dic-02 Jun-03 Dic-03 Jun-04 Dic-04 Jun-05 Dic-05 Jun-06 Dic-06 Jun-07 Dic-07 Jun-08 Dic-08 Jun-09
52
Dic-99 Jun-00 Dic-00 Jun-01 Dic-01 Jun-02 Dic-02 Jun-03 Dic-03 Jun-04 Dic-04 Jun-05 Dic-05 Jun-06 Dic-06 Jun-07 Dic-07 Jun-08 Dic-08 Jun-09
14 19
Dic-99 Jun-00 Dic-00 Jun-01 Dic-01 Jun-02 Dic-02 Jun-03 Dic-03 Jun-04 Dic-04 Jun-05 Dic-05 Jun-06 Dic-06 Jun-07 Dic-07 Jun-08 Dic-08 Jun-09
tact mation
3 000 3,500 4,000
140 160 180
290 310 330
Con Inform gic ers
1,500 2,000 2,500 3,000
Dic-99 Jun-00 Dic-00 Jun-01 Dic-01 Jun-02 Dic-02 Jun-03 Dic-03 Jun-04 Dic-04 Jun-05 Dic-05 Jun-06 Dic-06 Jun-07 Dic-07 Jun-08 Dic-08 Jun-09
60 80 100 120
Dic-99 Jun-00 Dic-00 Jun-01 Dic-01 Jun-02 Dic-02 Jun-03 Dic-03 Jun-04 Dic-04 Jun-05 Dic-05 Jun-06 Dic-06 Jun-07 Dic-07 Jun-08 Dic-08 Jun-09
210 230 250 270
Dic-99 Jun-00 Dic-00 Jun-01 Dic-01 Jun-02 Dic-02 Jun-03 Dic-03 Jun-04 Dic-04 Jun-05 Dic-05 Jun-06 Dic-06 Jun-07 Dic-07 Jun-08 Dic-08 Jun-09
Strate Matte al
1,000 1,050 1,100 1,150 1,200 1,250 1,300
150 160 170 180 190 200
460 480 500 520 540 560 580
Financia Informati al n
800 850 900 950 ,
Dic-99 Jun-00 Dic-00 Jun-01 Dic-01 Jun-02 Dic-02 Jun-03 Dic-03 Jun-04 Dic-04 Jun-05 Dic-05 Jun-06 Dic-06 Jun-07 Dic-07 Jun-08 Dic-08 Jun-09
120 130 140 150
Dic-99 Jun-00 Dic-00 Jun-01 Dic-01 Jun-02 Dic-02 Jun-03 Dic-03 Jun-04 Dic-04 Jun-05 Dic-05 Jun-06 Dic-06 Jun-07 Dic-07 Jun-08 Dic-08 Jun-09
400 420 440 460
Dic-99 Jun-00 Dic-00 Jun-01 Dic-01 Jun-02 Dic-02 Jun-03 Dic-03 Jun-04 Dic-04 Jun-05 Dic-05 Jun-06 Dic-06 Jun-07 Dic-07 Jun-08 Dic-08 Jun-09
Operationa Information
180 200 220 240 260 280 300
500 600 700 800 900 1,000 1,100
600 650 700 750 800 850 900 950 1,000
Company Overview
160 180
Dic-99 Jun-00 Dic-00 Jun-01 Dic-01 Jun-02 Dic-02 Jun-03 Dic-03 Jun-04 Dic-04 Jun-05 Dic-05 Jun-06 Dic-06 Jun-07 Dic-07 Jun-08 Dic-08 Jun-09
400 500
Dic-99 Jun-00 Dic-00 Jun-01 Dic-01 Jun-02 Dic-02 Jun-03 Dic-03 Jun-04 Dic-04 Jun-05 Dic-05 Jun-06 Dic-06 Jun-07 Dic-07 Jun-08 Dic-08 Jun-09
500 550
Dic-99 Jun-00 Dic-00 Jun-01 Dic-01 Jun-02 Dic-02 Jun-03 Dic-03 Jun-04 Dic-04 Jun-05 Dic-05 Jun-06 Dic-06 Jun-07 Dic-07 Jun-08 Dic-08 Jun-09
tact mation
Con Inform gic ers
Strate Matte al
Region 99 00 01 02 03 04 05 06 07 08
% Change 08 vs. 07 % of total 2008 CARG 99‐08
Mexico 5 0 5 0 4 9 4 8 5 3 5 6 5 5 5 9 7 4 8 1 9 0 45 4 5 4
Financia Informati al n Mexico 5.0 5.0 4.9 4.8 5.3 5.6 5.5 5.9 7.4 8.1 9.0 45.4 5.4 USA 4.1 4.6 4.5 4.4 4.9 5.9 5.6 5.3 6.0 6.5 8.8 36.8 5.2 Europe 0.7 0.9 0.9 0.8 1.0 1.3 1.2 1.3 1.4 1.5 5.3 8.3 9.5 Canada 0.3 0.4 0.5 0.6 0.7 0.8 0.8 0.8 1.0 1.3 26.8 7.1 17.9 Operationa Information Canada 0.3 0.4 0.5 0.6 0.7 0.8 0.8 0.8 1.0 1.3 26.8 7.1 17.9 Latin America (ex. Mexico) 0.5 0.5 0.5 0.3 0.3 0.3 0.3 0.3 0.3 0.4 39.3 2.4 ‐2.8 Asia & Others 0.0 0.0 0.0 0.0 0.0 0.0 0.0 0.0 0.0 0.0 0.0 0.0 0.0 ASUR 10.6 11.4 11.3 10.9 12.2 13.9 13.4 13.6 16.1 17.8 10.2 100 5.9 Company Overview ASUR 10.6 11.4 11.3 10.9 12.2 13.9 13.4 13.6 16.1 17.8 10.2 100 5.9
Departure Veracruz Airport
tact mation
Con Inform gic ers
Strate Matte al
Financia Informati al n
Operationa Information
Company Overview
Aircraft Rescue and Fire Fighting Team Veracruz Airport
Million pesos, as of December 31th, 2007 for 2007 Nominal pesos for 2008
1 $US=Ps 13.8325 ** Excluding passengers in transit and general aviation
tact mation
5.0 6.0
Con Inform gic ers
4.0
Strate Matte al
2.0 3.0
Financia Informati al n
1.0
Operationa Information
0.0
1Q01 2Q01 3Q01 4Q01 1Q02 2Q02 3Q02 4Q02 1Q03 2Q03 3Q03 4Q03 1Q04 2Q04 3Q04 4Q04 1Q05 2Q05 3Q05 4Q05 1Q06 2Q06 3Q06 4Q06 1Q07 2Q07 3Q07 4Q07 1Q08 2Q08 3Q08 4Q08 1Q09
Company Overview
Commercial Area at Terminal 3, Cancun International Airport USD as of Mar 31. 2009
1 $US=Ps 14.1517
tact mation Con Inform gic ers
100 120 Million USD
Strate Matte al
60 80
Financia Informati al n
40 60
Operationa Information
20 1999 2000 2001 2002 2003 2004 2005 2006 2007 2008 2009 2010 2011 2012 2013
15*
Company Overview
1 2 2 2 2 2 2 2 2 2 2 2 2 2 2
*MDP 2009‐2013: 15 million USD have been paid for each year ** Exchange Rate used for the 2009‐2013 period: 14.3317 pesos = 1 USD
Dollars in millions as of December 31, 2008 tact mation
Total Revenues
Commercial Revenues***
Con Inform gic ers Operating Profit
Profit before taxes
Net Profit
Net Profit per ADS in USD
Strate Matte al
Current Assets
Total Assets
Total Liabilities
Sharehoders equity
Financia Informati al n
Cash at the Beggining of the year
Operating Cash Flow
Investments
Operationa Information Cash at the End of the year
Passengers (millions)*
EBITDA**
Company Overview
Exchange Rate: 13.8325 pesos per USD *Excludes Transit and General Aviation **Net Income before provision for taxes, deferred taxes, deferred employees profit sharing, non‐ordinary items, comprehensive financing cost and depreciation and amortization ***ASUR classifies commercial revenues as those derived from the following activities: duty‐free services, car rental, retail, banking and currency exchange, advertising, teleservices, non permanent ground transportation, food and beverage and parking lots
Taxiway Villahermosa Airport
tact mation Con Inform gic ers
Strate Matte al
Financia Informati al n
Operationa Information Company Overview
Boarding Lounge Huatulco Airport
tact mation Con Inform gic ers Strate Matte al
Financia Informati al n Operationa Information
Company Overview