
SLIDE 1
AAR/ARCI Freight Car Fatigue Task Force II
September 2008
TM TM
AAR/ARCI Freight Car Fatigue Task Force II September 2008 - - PowerPoint PPT Presentation
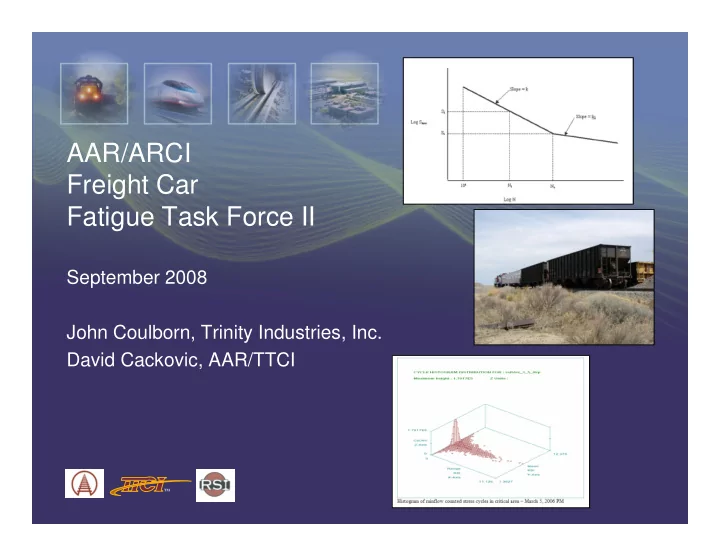
AAR/ARCI Freight Car Fatigue Task Force II September 2008 September 2008 John Coulborn, Trinity Industries, Inc. David Cackovic, AAR/TTCI TM TM Background The railroad environment is a moving target The birth of railcar design
TM TM
TM
TM
TM
TM
TM
TM
TM
TM
TM
TM
TM
TM
TM
TM
TM
TM
TM
TM
TM
TM
TM
TM
MEASUREMENT Transducer Type, Comment Data Type, Analysis
MEASURMENT Center Plate Vertical Load Strain Gage, calibrated in load frame Time History, Rainflow Cycle Counting Post Test Processing Side Bearing Load Bridge Longitudinal Coupler Load Instrumented Coupler SYSTEM MEASUREMENTS Power System Time History GPS Train Speed GPS Time History
TM
GPS Train Speed GPS Time History GPS Train Location GPS Time History CAR BODY STRUCTURAL MEASUREMENTS Car Body Strain Locations (Key locations, twist, etc.) Strain gage, locations based on car type (history, analysis) Time History, Rainflow Post Processing BOLSTER AND SIDEFRAME LOAD SPECTRA Bolster Load Strain Gage, calibrated in load frame Time History, Rainflow Post Processing SF Vertical Load SF Lateral Load
5 & 6 1 & 2 3 & 4
TM
▼ Wyoming to NY on UP / CSX ▼ Wyoming to Georgia on
TM
GPS Position Loaded Train Cities
North Platte Omaha Chicago Cleveland Dunkirk Mine
TM
Location on Route Test Speed (mph) Compressive Axial Stress Bending Stress Vertical Wheel Force Clinton Sub., MP 148.13, Right Switch
51.8 20,820 2,320 76,710
Columbus Sub., MP
49.5 18,210 2,190 73,460
TM
Columbus Sub., MP 86.49, Bridge
49.5 18,210 2,190 73,460
Columbus Sub., MP 88.23, Culvert
50.0 17,520 2,030 68,230
South Morrill Sub., MP 62.89, Road Crossing
50.0 16,270 1,680 56,560
Clinton Sub, MP 159.31 - culvert
43.1 15,960 2,150 65,450
Calculated Critical Compressive Stress for Buckling – 22,300 psi.
3600 Miles 2006 Data
TM
3600 Miles 2006 Data 5625 Miles 83'-85' Data
TM
500,000 1,000,000 1,500,000 2,000,000 2,500,000 ASF ASF ASF ASF ASF ASF ASF PEI PEI PEI PEI TTCI TTCI TTCI TTCI TTCI TTCI TTCI Test Location Fatigue Test Mileage Equivalent 100,000 200,000 300,000 400,000 500,000 600,000 700,000 800,000 Fatigue Test Cycles
AA R M - 2 02 M inimum Qua lif ic a t ion
Proposed Draft M-216 Specification Knuckle Fatigue Test Load Cycles Proposed
Segment Number of Cycles (Sinusoidal form) Total Elapsed Cycles Cycle Load Range
1 4 4 10 – 300 kips 2 2 6 10 – 280 kips 3 7 13 10 – 260 kips 4 10 23 10 – 240 kips
TM
4 10 23 10 – 240 kips 5 31 54 10 – 220 kips 6 77 131 10 – 200 kips 7 65 196 10 – 180 kips 8 73 269 10 – 160 kips 9 89 358 10 – 140 kips 10 105 463 10 – 120 kips 11 129 592 10 – 100 kips 12 187 779 10 – 80 kips 13 279 1058 10 – 60 kips
▼ Truck bolster load ▼ Side Bearing (brackets) ▼ Centerbowl load
▼ 70-ton truck dynamics
TM
▼ 70-ton truck dynamics ▼ Dynamic forces beneath 20
TM
TM
TM
Figure 1: Coal Hopper Coupler Fatigue
6,000,000 8,000,000 10,000,000 12,000,000 Fatigue Life (mileage)
TM
2,000,000 4,000,000 REPOS Table 7.23 Hopper REPOS Table 7.24 Hopper, Extreme 2006 Coal Hopper - Manned 2006 Coal Hopper - Unmanned Data Set F
Dual-Slope S-N Curve Single Slope S-N Curve Cut Off at Se
Note: Analysis performed per Ref. A
Figure 3: Coal Hopper Bolster Fatigue
10,000,000 15,000,000 20,000,000 25,000,000 atigue Life (mileage)
TM
5,000,000 REPOS Table 7.21 Hopper 2006 Coal Hopper - Manned 2006 Coal Hopper - Unmanned Data Set Fa
Dual-Slope S-N Curve Single Slope S-N Curve Cut Off at Se
Note: Analysis performed per Ref. A
TM
TM
TM
TM TM