
SLIDE 1
1
A Whirlwind Introduction to the Internet
Overview
◆ What’s the Internet ◆ Network core ◆ Network edge ◆ Access nets, physical media ◆ Internet Structure & ISPs ◆ Performance: loss, delay ◆ Security ◆ Protocol layers, service models
mobile network global ISP regional ISP home network Institutional network
2
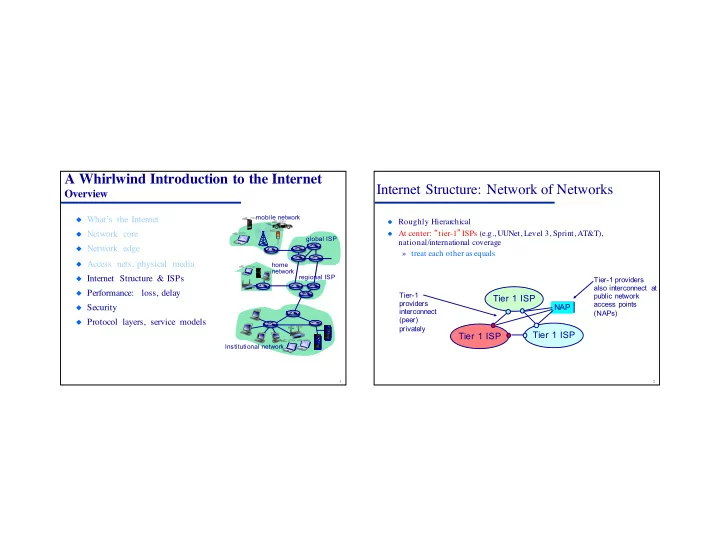
Internet Structure: Network of Networks
◆ Roughly Hierarchical ◆ At center: “tier-1” ISPs (e.g., UUNet, Level 3, Sprint, AT&T),
national/international coverage » treat each other as equals
Tier 1 ISP Tier 1 ISP Tier 1 ISP
Tier-1 providers interconnect (peer) privately
NAP
Tier-1 providers also interconnect at public network access points (NAPs)