A tool for Bottleneck analysis and Performance Prediction for - - PowerPoint PPT Presentation

a tool for bottleneck analysis and performance prediction
SMART_READER_LITE
LIVE PREVIEW

A tool for Bottleneck analysis and Performance Prediction for - - PowerPoint PPT Presentation

Motivation A Statistical Approach: BlackForest Implementation and Case Studies Conclusion A tool for Bottleneck analysis and Performance Prediction for GPU-accelerated Applications S. Madougou, A. Varbanescu, C. de Laat and R. van Nieuwpoort


slide-1
SLIDE 1

Motivation A Statistical Approach: BlackForest Implementation and Case Studies Conclusion

A tool for Bottleneck analysis and Performance Prediction for GPU-accelerated Applications

  • S. Madougou, A. Varbanescu, C. de Laat and R. van

Nieuwpoort

Universiteit van Amsterdam, NL

May 23, 2016

  • S. Madougou et al.

A tool for Bottleneck analysis and Performance Prediction for GPU-accelerated

slide-2
SLIDE 2

Motivation A Statistical Approach: BlackForest Implementation and Case Studies Conclusion

Motivation

Heterogeneous computing emerging as a way to computing efficiency

parallel design and programming are the trends

Hard to get optimal performance on heterogeneous architectures Need for tools for understanding performance on heterogeneous architectures

Different approaches: profilers, simulators, performance models

  • S. Madougou et al.

A tool for Bottleneck analysis and Performance Prediction for GPU-accelerated

slide-3
SLIDE 3

Motivation A Statistical Approach: BlackForest Implementation and Case Studies Conclusion

Why GPUs?

  • S. Madougou et al.

A tool for Bottleneck analysis and Performance Prediction for GPU-accelerated

For their popularity

Higher pure computing horse-power than CPUs Performance enhancement for more and more applications

For the challenge of getting performance on GPUs

Fitness to data parallel and specific programing models Exploration of a large optimization space (via tuning, etc)

slide-4
SLIDE 4

Motivation A Statistical Approach: BlackForest Implementation and Case Studies Conclusion

Modelling performance, why?

Scaling behavior through application parameter space Scaling behavior through hardware parameter space Performance bottlenecks Performance limiting factors

  • S. Madougou et al.

A tool for Bottleneck analysis and Performance Prediction for GPU-accelerated

slide-5
SLIDE 5

Motivation A Statistical Approach: BlackForest Implementation and Case Studies Conclusion

Modelling performance, why?

Scaling behavior through application parameter space Scaling behavior through hardware parameter space Performance bottlenecks Performance limiting factors

  • S. Madougou et al.

A tool for Bottleneck analysis and Performance Prediction for GPU-accelerated

slide-6
SLIDE 6

Motivation A Statistical Approach: BlackForest Implementation and Case Studies Conclusion

Performance modelling (PM)

Not the first, certainly not the last. Many different approaches: Simulation Analytical Statistical/ML Measurements Current approaches present many shortcomings1:

1 Madougou et al., An empirical evaluation of GPGPU performance models, Hetero-Par 2014.

  • S. Madougou et al.

A tool for Bottleneck analysis and Performance Prediction for GPU-accelerated

slide-7
SLIDE 7

Motivation A Statistical Approach: BlackForest Implementation and Case Studies Conclusion

Main PM Obstacles

Complexity Requirement for detailed hardware knowledge Dependence on hardware or application Requiring user intervention Simulation/benchmarking is time consuming

  • S. Madougou et al.

A tool for Bottleneck analysis and Performance Prediction for GPU-accelerated

slide-8
SLIDE 8

Motivation A Statistical Approach: BlackForest Implementation and Case Studies Conclusion

Machine Learning Trade-Offs

Pros: Doesn’t require hardware understanding Doesn’t require software understanding Sparse set of measurements is sufficient Easily publishable buzzword! Cons: Don’t know what is learned Hard to know where bottlenecks are Prone to overfitting

  • S. Madougou et al.

A tool for Bottleneck analysis and Performance Prediction for GPU-accelerated

slide-9
SLIDE 9

Motivation A Statistical Approach: BlackForest Implementation and Case Studies Conclusion

Some Observations

All platforms expose hardware performance counters (PCs) Performance data is easy to extract but hard to interpret

  • S. Madougou et al.

A tool for Bottleneck analysis and Performance Prediction for GPU-accelerated

slide-10
SLIDE 10

Motivation A Statistical Approach: BlackForest Implementation and Case Studies Conclusion

PC Measurements and Metrics

PC: special-purpose register built into a processor to store the count of an hardware event PCs allow to establish correlation between application code and its mapping to the hardware Choice of tool for PC counting and derived metrics

Low level: PAPI, vendor-specific, high level: TAU, HPCToolkit, Score-P, etc LIKWID (CPU), nvprof (GPU) used currently

  • S. Madougou et al.

A tool for Bottleneck analysis and Performance Prediction for GPU-accelerated

slide-11
SLIDE 11

Motivation A Statistical Approach: BlackForest Implementation and Case Studies Conclusion

Some PCs and Metrics for CPU (Intel Nehalem)

metric meaning group inst per br instructions per branch BRANCH br rate branch rate BRANCH mem data vol volume of data read/write in GByte MEM SPFlops single precision arithmetic performance FLOPS SP SPMUOPS single precision vectorization performance FLOPS SP PMUOPS vectorization performance FLOPS SP L1 miss ratio L1 data cache miss ratio CACHE dcache miss rate L1 data cache miss rate CACHE L3 data vol data volume between L2 and L3 L3 L2S ratio loads to stores ratio DATA L1DTLB miss rate L1 data TLB miss rate TLB cpi cycles per instruction Always br mispred rate branch misprediction rate BRANCH

  • S. Madougou et al.

A tool for Bottleneck analysis and Performance Prediction for GPU-accelerated

slide-12
SLIDE 12

Motivation A Statistical Approach: BlackForest Implementation and Case Studies Conclusion

Some PCs and Metrics for GPU (CUDA CC 2.0)

  • S. Madougou et al.

A tool for Bottleneck analysis and Performance Prediction for GPU-accelerated

counter meaning shared replay overhead average number of replays due to shared memory conflicts for each instruction executed shared load|store number of executed shared load (store) instructions, increments per warp on a multiprocessor inst replay overhead average number of replays for each instruction executed l1 global load hit number of cache lines that hit in L1 for global memory load accesses l1 global load miss number of cache lines that miss in L1 for global memory load accesses gld request number of executed global load instructions increments per warp on a multiprocessor gst request similar to gld request for store instructions global store transaction number of global store transactions increments per transaction which can be 32,64,96 or 128 bytes gld requested throughput requested global memory load throughput achieved occupancy ratio of average active warps per active cycle to the maximum number of warps per SM l2 read throughput memory read throughput at L2 cache l2 write transactions memory write transactions at L2 cache ipc number of instructions executed per cycle

slide-13
SLIDE 13

Motivation A Statistical Approach: BlackForest Implementation and Case Studies Conclusion

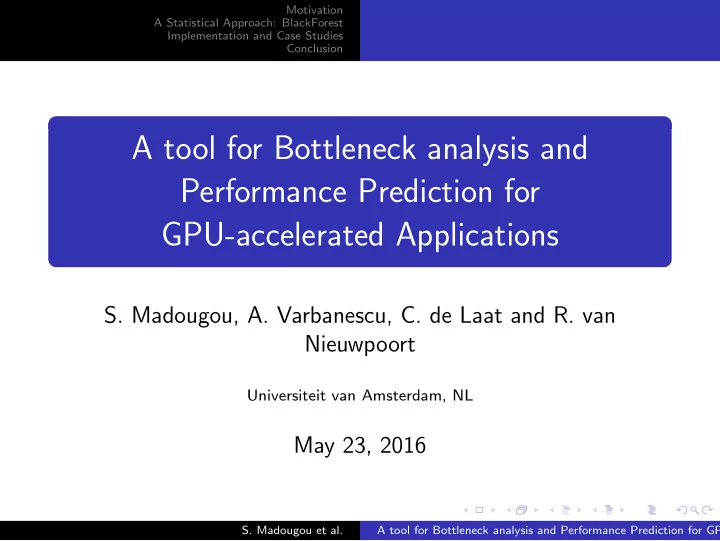
Counter Behavior vs Performance - CPU2

  • 2J. Treibig et al., Best practices for HPM-assisted performance engineering on modern multicore processors,

CoRR, 2012

  • S. Madougou et al.

A tool for Bottleneck analysis and Performance Prediction for GPU-accelerated

pattern signature performance behavior HPM (group) load imbalance saturating speedup different counts of instructions retired or FP

  • perations among cores (FLOPS DP,FLOPS SP)

memory BW saturation saturating speedup across memory BW comparable cores sharing a memory interface to peak memory BW (MEM) strided memory access large discrepancy between between low BW utilization despite LD/ST simple BW-based model and actual domination, low cache hit ratios, frequent performance evicts/replacements (CACHE,DATA,MEM) bad instruction mix performance insensitive large ratio of inst. retired to FP inst. if FP, to problem sizes fitting many cycles per inst. if long-latency arithmetic, into different cache levels scalar instructions dominating in data-parallel loops (FLOPS DP,FLOPS SP,CPI) limited instruction throughput large discrepancy between low CPI near theoretical limit if instruction actual performance and simple throughput is the problem, static code analysis predictions based on max FLOP/s predicting large pressure on single execution

  • r LD/ST throughput

port (FLOPS DP,FLOPS SP,CPI) synchronization overhead speedup going down as more cores large non-FP instruction count are added, no speedup with small (growing with number of cores used), low problem sizes, core busy but low FP CPI (FLOPS DP,FLOPS SP,CPI) false cache line sharing very low speedup or slowdown frequent (remote) evicts (CACHE) even with small core counts

slide-14
SLIDE 14

Motivation A Statistical Approach: BlackForest Implementation and Case Studies Conclusion

Counter Behavior vs Performance - GPU

  • S. Madougou et al.

A tool for Bottleneck analysis and Performance Prediction for GPU-accelerated performance issue counter set values and trends message scattered access pattern gld request ,l1 global load miss memory instruction count ≪ coalesce access l1 global load hit,gst request memory transaction count addresses, l1 global store transaction kernel throughput ≪ non-caching gld|gst transactions per request hardware throughput loads or textures insufficient mem. concurrency gld throughput,gst throughput effective ≪ theory increase occupancy achieved occupancy low many elements / thread instruction serialization inst executed,inst issued executions ≪ issues see next 2 items shared bank conflicts l1 shared bank conflict conflicts > loads+stores use padding shared load,shared store warp divergence divergent branch,branch or divergent branches data or thread branch efficiency ≈ branches index rearrangement limited inst. throughput ipc low compared to theory use intrinsics insufficient parallelism achieved occupancy low adjust exec. config. synchronization overhead stall synch high code rearrangement latency gld|gst throughput,ipc both mem. and msgs for insuf. mem.

  • inst. throughput ≪ theory

and inst. throughput register spilling l1 local load miss,local load compare to total instructions increase register local store,gld request compare to global memory limit per thread, gst request,inst issued instructions increase L1

slide-15
SLIDE 15

Motivation A Statistical Approach: BlackForest Implementation and Case Studies Conclusion

BlackForest3 Architecture

performance model measurements tools CPU accelerator analyses regressions similarity correlation data

  • perf. metrics
  • hw. params
  • prg. params

compilation instrumentor compiler program scheduler autotuner visualization

  • 3S. Madougou et al., A Tool for Bottleneck Analysis and Performance Prediction for GPU-accelerated
  • S. Madougou et al.

A tool for Bottleneck analysis and Performance Prediction for GPU-accelerated

slide-16
SLIDE 16

Motivation A Statistical Approach: BlackForest Implementation and Case Studies Conclusion

BlackForest (BF) Approach

Goal: explain performance behavior and predict performance Main approach: regression by random forest4 black-box approach predictive power and high accuracy of the predictions variable importance feature Model simplification: model important variables in terms of problem/hardware parameters: (g)lm, MARS Additional techniques for model improvement and ease of interpretation: PCA, clustering

  • 4L. Breiman, Random forests, Machine Learning, 2001
  • S. Madougou et al.

A tool for Bottleneck analysis and Performance Prediction for GPU-accelerated

slide-17
SLIDE 17

Motivation A Statistical Approach: BlackForest Implementation and Case Studies Conclusion

Random Forest Model Construction

Steps:

1

Select random sample from training set (Bagging)

2

Select random sample from PCs

3

Construct regression tree to fit data

4

Repeat to build forest of trees

5

Average predictions of all trees together Remarks: Randomness reduces overfitting Identifies important performance counters!

  • S. Madougou et al.

A tool for Bottleneck analysis and Performance Prediction for GPU-accelerated

slide-18
SLIDE 18

Motivation A Statistical Approach: BlackForest Implementation and Case Studies Conclusion

BlackForest Measurements

  • S. Madougou et al.

A tool for Bottleneck analysis and Performance Prediction for GPU-accelerated performance model measurements LIKWID nvprof

i7 920 GTX480,K20m analyses RF, MARS, lm clustering PCA data

  • perf. metrics
  • hw. params
  • prg. params

compilation LIKWID gcc,nvcc scheduler autotuner R viz. tools program

HS hotspot, structured grid thermal simulation tool for estimating processor temperature, memory intensive, latency limited NW Needleman-Wunsch, nonlinear global optimization method for DNA sequence alignment, memory intensive, bandwidth limited MM Matrix Multiply, linear algebra primitive used in many numerical algorithms, memory intensive, bandwidth limited

slide-19
SLIDE 19

Motivation A Statistical Approach: BlackForest Implementation and Case Studies Conclusion

Experimental Setup

Experimental data collection: several application runs with different problem sizes Response and predictors specification, model building and training

Sampling UAR of 20% data for test

Use variable importance to simplify the model if possible Otherwise, PCA and/or clustering to try to simplify Control goodness-of-fit by R-squared (>95%)

  • S. Madougou et al.

A tool for Bottleneck analysis and Performance Prediction for GPU-accelerated

slide-20
SLIDE 20

Motivation A Statistical Approach: BlackForest Implementation and Case Studies Conclusion

HS Problem Scaling on CPU

  • S. Madougou et al.

A tool for Bottleneck analysis and Performance Prediction for GPU-accelerated

L1DTLB_miss_ratio L2Load L3_miss_rate SPFlops L1_miss_ratio L2_bw PMUOPS L3_miss_ratio dcache_miss_rate P1_ratio L1DTLB_req_rate L3_bw SPMUOPS L3Evict mem_bw br_mispred_rate L3Load cpi dcache_req_rate L2Evict L2_data_vol dcache_misses DPFlops L1DTLB_miss_rate L2S_ratio L3_data_vol size mem_data_vol br_rate inst_per_br

  • 5

10 15 20 %IncMSE

variable importance

1000 2000 3000 4000 0.0 0.2 0.4 0.6 0.8 size time (s) predicted measured

Prediction of unseen grid sizes

slide-21
SLIDE 21

Motivation A Statistical Approach: BlackForest Implementation and Case Studies Conclusion

MM Problem Scaling on GPU

  • S. Madougou et al.

A tool for Bottleneck analysis and Performance Prediction for GPU-accelerated

alu_fu_utilization ldst_fu_utilization l1_shared_bank_conflict uncached_global_load_transacti l1_global_load_hit l1_local_load_miss l1_local_load_hit divergent_branch local_store l1_global_load_miss inst_executed gld_requested_throughput gld_request gld_throughput shared_load shared_store inst_issued flops_sp branch inst_replay_overhead achieved_occupancy gst_throughput global_store_transaction gst_request gst_requested_throughput

  • 5

10 15 20 %IncMSE

variable importance

500 1000 1500 10 20 30 40 size time (ms) predicted measured

predicting unseen matrix sizes

slide-22
SLIDE 22

Motivation A Statistical Approach: BlackForest Implementation and Case Studies Conclusion

NW Hardware Scaling on GPUs (1/2)

  • S. Madougou et al.

A tool for Bottleneck analysis and Performance Prediction for GPU-accelerated

branch_efficiency l1_local_load_miss l1_local_load_hit divergent_branch local_store warp_execution_efficiency inst_replay_overhead ldst_fu_utilization l1_global_load_hit gld_throughput l2_read_throughput gst_throughput gld_requested_throughput gst_requested_throughput issue_slot_utilization l2_write_throughput size achieved_occupancy branch inst_executed gst_request shared_load gld_request l1_shared_bank_conflict shared_store l2_write_transactions global_store_transaction inst_issued l1_global_load_miss l2_read_transactions

  • 2

4 6 8 10 12 %IncMSE

variable importance on GTX480

flops_dp flops_sp l1_global_load_miss l1_global_load_hit l1_local_load_miss l1_local_load_hit local_store warp_execution_efficiency inst_replay_overhead ldst_fu_utilization inst_executed global_store_transaction l2_read_transactions shared_load l2_write_transactions gst_request shared_store gld_request l2_read_throughput l2_write_throughput inst_issued shared_store_replay shared_load_replay gld_requested_throughput gst_requested_throughput gst_throughput gld_throughput issue_slot_utilization size achieved_occupancy

  • 2

4 6 8 10 %IncMSE

variable importance on K20m

slide-23
SLIDE 23

Motivation A Statistical Approach: BlackForest Implementation and Case Studies Conclusion

NW Hardware Scaling on GPUs (2/2)

  • S. Madougou et al.

A tool for Bottleneck analysis and Performance Prediction for GPU-accelerated 2000 4000 6000 0.025 0.030 0.035 0.040 0.045 size time (ms) predicted on GTX580 measured predicted on K20m

slide-24
SLIDE 24

Motivation A Statistical Approach: BlackForest Implementation and Case Studies Conclusion

Conclusion & Outlook

Results: BF is a step towards an easy-to-use and insightful PM framework Accuracy, quasi automation, application and architecture agnostic Future directions: Automation Improve accuracy for irregular applications Build higher level metrics on top of PC Address counter hardware specificity to improve portability (PAPI?) Implement correlation between counter behavior vs performance issue

  • S. Madougou et al.

A tool for Bottleneck analysis and Performance Prediction for GPU-accelerated

slide-25
SLIDE 25

Motivation A Statistical Approach: BlackForest Implementation and Case Studies Conclusion

Questions?

Questions?

Source: https://bitbucket.org/smadougou/rfpm (Warning: Pre-alpha software) Email:{s.madougou,a.l.varbanescu}@uva.nl

  • S. Madougou et al.

A tool for Bottleneck analysis and Performance Prediction for GPU-accelerated

slide-26
SLIDE 26

Motivation A Statistical Approach: BlackForest Implementation and Case Studies Conclusion

Simplification validation using VI

  • S. Madougou et al.

A tool for Bottleneck analysis and Performance Prediction for GPU-accelerated

1000 1500 2000 2500 3000 3500 4000 0.2 0.4 0.6 0.8 size time (s) predicted all predicted 6 measured

HS on CPU

2000 4000 6000 8000 0.020 0.025 0.030 0.035 0.040 0.045 0.050 size time (ms) predicted all predicted 6 measured

NW on GPU

slide-27
SLIDE 27

Motivation A Statistical Approach: BlackForest Implementation and Case Studies Conclusion

Bottleneck analysis using VI

  • S. Madougou et al.

A tool for Bottleneck analysis and Performance Prediction for GPU-accelerated

l1_global_load_hit alu_fu_utilization achieved_occupancy l1_shared_bank_conflict ldst_fu_utilization issue_slot_utilization warp_execution_efficiency ipc l1_global_load_miss shared_store shared_load gst_throughput l2_write_transactions l2_read_transactions global_store_transaction gst_request gld_request l2_write_throughput gld_throughput gld_requested_throughput gst_requested_throughput l2_read_throughput inst_replay_overhead shared_replay_overhead

  • 5

10 15 20 %IncMSE

reduce1 VI on GPU

warp_execution_efficiency shared_replay_overhead l1_shared_bank_conflict l1_global_load_hit alu_fu_utilization ldst_fu_utilization issue_slot_utilization achieved_occupancy ipc l2_read_throughput gld_requested_throughput gst_requested_throughput gld_throughput gst_throughput l2_write_throughput inst_replay_overhead shared_store gst_request shared_load gld_request global_store_transaction l2_read_transactions l2_write_transactions l1_global_load_miss

  • 5

10 15 %IncMSE

reduce2 VI on GPU

slide-28
SLIDE 28

Motivation A Statistical Approach: BlackForest Implementation and Case Studies Conclusion

Predictor-Response Association (1/2)

  • S. Madougou et al.

A tool for Bottleneck analysis and Performance Prediction for GPU-accelerated

l1_global_load_hit alu_fu_utilization achieved_occupancy l1_shared_bank_conflict ldst_fu_utilization issue_slot_utilization warp_execution_efficiency ipc l1_global_load_miss shared_store shared_load gst_throughput l2_write_transactions l2_read_transactions global_store_transaction gst_request gld_request l2_write_throughput gld_throughput gld_requested_throughput gst_requested_throughput l2_read_throughput inst_replay_overhead shared_replay_overhead

  • 5

10 15 20 %IncMSE

reduce1 VI on GPU

0.10 0.15 0.20 0.25 0.035 0.040 0.045 0.050

Partial dependence of time on shared_replay_overhead

shared_replay_overhead Average predicted time (ms)

Partial Dependence Plot

slide-29
SLIDE 29

Motivation A Statistical Approach: BlackForest Implementation and Case Studies Conclusion

Predictor-Response Association (2/2)

  • S. Madougou et al.

A tool for Bottleneck analysis and Performance Prediction for GPU-accelerated

warp_execution_efficiency alu_fu_utilization ldst_fu_utilization l1_shared_bank_conflict l1_global_load_hit l2_read_throughput issue_slot_utilization inst_replay_overhead gld_requested_throughput achieved_occupancy l2_write_throughput gld_throughput gst_requested_throughput gst_throughput gld_request l2_write_transactions l1_global_load_miss l2_read_transactions global_store_transaction shared_load shared_store gst_request

  • 5

10 15 %IncMSE

reduce6 VI on GPU

0.00005 0.00010 0.00015 0.00020 0.00025 0.0145 0.0150 0.0155 0.0160 0.0165 gst_request partial dependence

Partial Dependence Plot

slide-30
SLIDE 30

Motivation A Statistical Approach: BlackForest Implementation and Case Studies Conclusion

Redundant predictors removal using PCA

  • S. Madougou et al.

A tool for Bottleneck analysis and Performance Prediction for GPU-accelerated

branch_efficiency l1_local_load_miss l1_local_load_hit divergent_branch local_store warp_execution_efficiency inst_replay_overhead ldst_fu_utilization l1_global_load_hit gld_throughput l2_read_throughput gst_throughput gld_requested_throughput gst_requested_throughput issue_slot_utilization l2_write_throughput size achieved_occupancy branch inst_executed gst_request shared_load gld_request l1_shared_bank_conflict shared_store l2_write_transactions global_store_transaction inst_issued l1_global_load_miss l2_read_transactions

  • 2

4 6 8 10 12 %IncMSE

variable importance on GTX480

Factor loading value −0.2 0.0 0.2 0.4 l 2 _ r e a d _ t r a n s a c t i

  • n

s l 1 _ g l

  • b

a l _ l

  • a

d _ m i s s i n s t _ i s s u e d g l

  • b

a l _ s t

  • r

e _ t r a n s a c t i

  • n

l 2 _ w r i t e _ t r a n s a c t i

  • n

s s h a r e d _ s t

  • r

e l 1 _ s h a r e d _ b a n k _ c

  • n

f l i c t g l d _ r e q u e s t s h a r e d _ l

  • a

d g s t _ r e q u e s t i n s t _ e x e c u t e d b r a n c h PC1 PC2 PC3

PCA involving 9 most VI

slide-31
SLIDE 31

Motivation A Statistical Approach: BlackForest Implementation and Case Studies Conclusion

MM hardware scaling on GPUs

  • S. Madougou et al.

A tool for Bottleneck analysis and Performance Prediction for GPU-accelerated 500 1000 1500 2000 10 20 30 40 50 size time (ms) predicted on GTX580 measured predicted on K20m