
SLIDE 1
5/1/2011
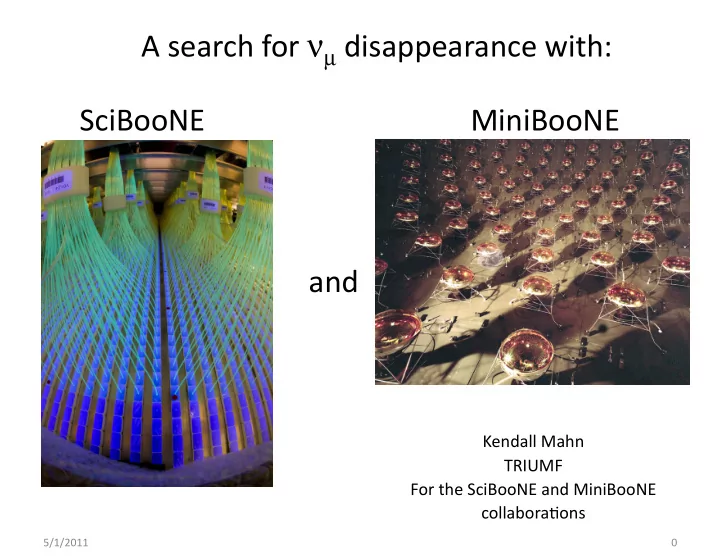
A search for disappearance with: SciBooNE MiniBooNE and Kendall - - PowerPoint PPT Presentation
A search for disappearance with: SciBooNE MiniBooNE and Kendall Mahn TRIUMF For the SciBooNE and MiniBooNE collabora>ons 5/1/2011 0 Neutrino oscillations in 2011 Neutrino oscillations thus far are consistent with three flavors of
5/1/2011
5/1/2011 1
5/1/2011 2
Barger, Marfatia, & Whisnant, Phys. Lett. B576 (2003) 303
Palomares-Ruiz, Pascoli, Schwetz, JHEP 0509:048,2005. hep-ph/0505216
Nelson, Walsh Phys .Rev. D77 033001 (2008) hep-ph/0711.1363
1 10
2
10
90%CL excluded, CDHS 90%CL excluded, CCFR
1 10
2
10
90%CL excluded, CDHS 90%CL excluded, CCFR
1 10
2
10
90%CL excluded, CDHS 90%CL excluded, CCFR
1 10
2
10
90%CL excluded, CDHS 90%CL excluded, CCFR 90% CL sensitivity
!
! MiniBooNE 90% CL limit
!
! MiniBooNE (null) of 17.78
2
"
2
" best fit: (17.50, 0.16) with
2
eV
2
m #
10
10 1
10 1 10 10
90%CL excluded, CCFR __ __ ) $ (2
2
sin
2
eV
2
m #
10
10 1
10 1 10 10
90%CL excluded, CCFR __ __ ) $ (2
2
sin
2
eV
2
m #
10
10 1
10 1 10 10
90%CL excluded, CCFR __ __ ) $ (2
2
sin
2
eV
2
m #
10
10 1
10 1 10 10
90%CL excluded, CCFR __ __ ) $ (2
2
sin
2
eV
2
m # 90% CL sensitivity
!
! MiniBooNE 90% CL limit
!
! MiniBooNE (null) of 10.29
2
"
2
" best fit: (31.30, 0.96) with
3
5/1/2011
4
4 5/1/2011
5/1/2011 5
W+
10/31/08 W&C
p p
5/1/2011 6
12C
5/1/2011 7
5/1/2011 8
Events 500 1000 1500 2000 2500 3000 3500 4000 4500 Data Null oscillation Non-CCQE events
(GeV)
!
Reconstructed E 0.4 0.6 0.8 1 1.2 1.4 1.6 1.8 Ratio 0.5 0.6 0.7 0.8 0.9 1 1.1 1.2 1.3 1.4 1.5 Best fit = 0.5 " 2
2
, sin
2
= 1.0 eV
2
m # = 0.5 " 2
2
, sin
2
= 10 eV
2
m #
Events 500 1000 1500 2000 2500 3000 Data Null oscillation Non-CCQE events
(GeV)
!
Reconstructed E 0.4 0.6 0.8 1 1.2 1.4 1.6 1.8 Ratio 0.5 0.6 0.7 0.8 0.9 1 1.1 1.2 1.3 1.4 1.5 Best fit = 0.5 " 2
2
, sin
2
= 1.0 eV
2
m # = 0.5 " 2
2
, sin
2
= 10 eV
2
m #
Events 5000 10000 15000 20000 25000 30000 Data Null oscillation Non-CCQE events
(GeV)
!
Reconstructed E 0.2 0.4 0.6 0.8 1 1.2 1.4 1.6 1.8 Ratio 0.5 0.6 0.7 0.8 0.9 1 1.1 1.2 1.3 1.4 1.5 Best fit = 0.5 " 2
2
, sin
2
= 1.0 eV
2
m # = 0.5 " 2
2
, sin
2
= 10.0 eV
2
m #
5/1/2011 9
5/1/2011 10
! 2
2
sin 0.1 0.2 0.3 0.4 0.5 0.6 0.7 0.8 0.9 1 ]
2
[eV
2
m "
10 1 10
90% CL limits from previous exp’s. 90% CL sensitivity (Sim. fit) 90% CL observed (Sim. fit) 90% CL observed (Spec. fit)
5/1/2011 11
5/1/2011 12
5/1/2011 13
5/1/2011 14
0.86 0.88 0.9 0.92 0.94 0.96 0.98 1 1.02 1.04 0.5 1 1.5 reconstructed E! (GeV) "m2=1eV2 reconstructed E! (GeV) "m2=3eV2 0.86 0.88 0.9 0.92 0.94 0.96 0.98 1 1.02 1.04 0.5 1 1.5 0.86 0.88 0.9 0.92 0.94 0.96 0.98 1 1.02 1.04 0.5 1 1.5 (GeV) reconstructed E! (GeV) "m2=9eV2 0.86 0.88 0.9 0.92 0.94 0.96 0.98 1 1.02 1.04 0.5 1 1.5 reconstructed E! (GeV) "m2=6eV2
Events 5000 10000 15000 20000 25000 30000 Data Null oscillation Non-CCQE events
(GeV)
!
Reconstructed E 0.2 0.4 0.6 0.8 1 1.2 1.4 1.6 1.8 Ratio 0.5 0.6 0.7 0.8 0.9 1 1.1 1.2 1.3 1.4 1.5 Best fit = 0.5 " 2
2
, sin
2
= 1.0 eV
2
m # = 0.5 " 2
2
, sin
2
= 10.0 eV
2
m #
5/1/2011 15
sin22θ = 0.51