
SLIDE 1
July 201 017 Republic blic
- f
Indones esia ia
A Re Resi sili lien ent an and Pr Progr gres essive sive Ec Econom
- my
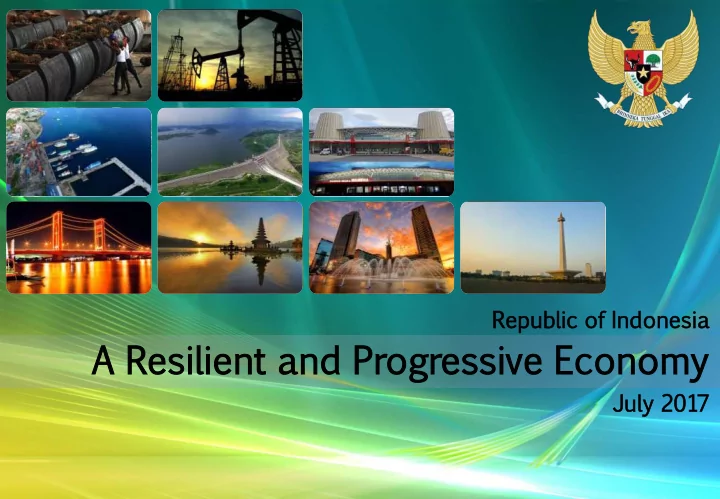
A Re Resi sili lien ent an and Pr Progr gres essive sive - - PowerPoint PPT Presentation
Republic blic of Indones esia ia A Re Resi sili lien ent an and Pr Progr gres essive sive Ec Econom omy July 201 017 About ut Inves esto tor Relatio tions ns Unit of the Republic ublic of Indones I esia
July 201 017 Republic blic
Indones esia ia
1
About ut Inves esto tor Relatio tions ns Unit
the Republic ublic
I Indones esia
Investor Relations Unit (IRU) of the Republic of Indonesia has been established as a joint effort between Coordinating Ministry of Economic Affairs, Ministry of Finance and Bank Indonesia since 2005. The main objective of IRU is to actively communicate Indonesian economic policy and to address concerns of investors, especially financial market investors. As an important part of its communication measures, IRU maintains a website under Bank Indonesia website which is administered by International Department of Bank Indonesia. However, day-to-day activities of IRU are supported by all relevant government agencies, among others: Bank Indonesia, Ministry of Finance, Coordinating Ministry for Economic Affairs, Investment Coordinating Board, Ministry of Trade, Ministry of State Owned Enterprises, Ministry of Energy and Mineral Resources and Financial Services Authority. IRU also convenes an investor conference call on a quarterly basis, answers questions through email, telephone and may arrange direct visit of banks/financial institutions to Bank Indonesia and other relevant government offices. Published by Investor Relations Unit – Republic of Indonesia Website: http://www.bi.go.id/en/iru/default.aspx Contact: Wiwit Widyastuti (International Department - Bank Indonesia, Phone: +6221 2981 8279) Adrianto (Fiscal Policy Office - Ministry of Finance, Phone: +6221 345 0012) I Gede Yuddy Hendranata (Directorate General of Budget Financing and Risk Management - Ministry of Finance, Phone: +62213510714) E-mail: contactIRU-DL@bi.go.id This Presentation Book also can be downloaded from: http://www.bi.go.id/en/iru/presentation/red/Default.aspx
2
Overvie rview
Instit itutio utional nal and Governan ernance Effectiv ivene eness: Acceler lerated ted Reforms rms Agenda with Instit itutio utional nal Improvem ement ent Econo nomic ic Factor: Strong ng and Stable le Growth wth Prospec ects Remain in Intact Externa ernal l Facto tor: : Impro roved ed Externa ernal l Resilien lience Fiscal al Perfo rformanc ance and Flexibilit ibility: y: More re Fiscal al Stimulus lus with Prud udent nt Fiscal l Mana nage gement nt Moneta etary ry and Financ ncial ial Factor: : Credible ible Monet netar ary y Polic licy y Track k Record rd and Favour urable ble Financ ncial ial Sector Pro rogres gressiv ive e Infras rastr truc uctur ure Develo lopment ent: Strong ng Commitm itment ent on Acceleratio leration n
rastr truc uctur ture e Pro rovis isio ion
4
Positi tive ve Globa bal Perceptio ception
1. Source: World Bank – Doing Business 2017 Report; 2. Source: Transparency International – Corruption Perceptions Index 2016 Report; 3. Source: World Economic Forum –The Global Competitiveness Report 2016 – 2017 4. Source: World Bank
World ld Govern ernance Indic icato tors4 Ease of Doing ng Busin iness1 Global l Compe petitive titivene ness Index3 Corruptio uption n Perce cept ptio ion n Index2
Higher rank is better Higher score is better 41 39 81 57 55 30 45 60 75 90 2009 2010 2011 2012 2013 2014 2015 2016 Indonesia India Brazil Phillipines Turkey 91 130 123 99 69 50 70 90 110 130 150 2008 2009 2010 2011 2012 2013 2014 2015 2016 Indonesia India Brazil Philippines Turkey 37 40 35 41 25 30 35 40 45 50 55 2012 2013 2014 2015 2016 Indonesia India Brazil Philippines Turkey * Both India and Brazil shared the same score (40) in 2016 Higher rank is better Higher rank is better 52 25 47 46 38 40 15 25 35 45 55 2010 2011 2012 2013 2014 2015 Voice and Accountability Political Stability/Absence of Violence Regulatory Quality Government Effectiveness Control of Corruption Rule of Law
5 Fitch JCRA
2006 2006 2007 2007 2008 2008 2009 2009 2010 2010 2011 2011 2012 2012 2013 2013 2014 2014 2015 2015 2016 2016 2017 2017
BBB BBB- / / Positive ive Baa3 a3 / Positiv ive BBB BBB- / Stable
Feb b 201 017, Baa3, Outlook Revis ised ed to Posit itive “We changed the outlook on Indonesia's sovereign rating to positive from stable to reflect emerging signs of a reduction in structural constraints, including its level of external vulnerability and the strength of its institutions.“ May 2017 17, BBB-, Ratin ing g Upgr graded ded “We raised the long-term sovereign credit to BBB- as the Indonesian authorities have taken effective expenditure and revenue measures to stabilize the public finances despite the terms of trade shock.” July y 201 2017, BBB-, Posit itiv ive e Ratin ing g Affir firmed ed “Indonesia's ratings balance a low government debt burden, favourable growth outlook and limited sovereign exposure to banking sector risks with weak - but strengthening - external finances compared with 'BBB' category peers and some lagging structural factors, including governance standards and a still difficult - but improving - business environment.”
BBB BBB- / / Positive ive
March 201 017, BBB-, Outlook Revis ised ed to Posit itiv ive e “JCR has changed the rating outlook from Stable to Positive, based
series of Economic Policy Packages & the containment of private external debt brought by Bank Indonesia’s prudential regulations on external borrowing.”
BBB BBB- / Positive ive
April il 2017, 017, BBB-, Outlook Revis ised ed to Posit itiv ive e “Indonesia's macroeconomics stability has been maintained for several
reined in and government debt is low. In light of such factors, coupled with improved policy management, R&I has changed the rating outlook to Positive.’
BBB BBB- BB BB+ BB B+ BB-
Inves estm tment ent Grad ade Status tus From Rating ng Agen encies cies
Below low Inve vestme tment nt Grade
S&P R&I Moody’s
6
Indones esia ia Remain ains the he Investment stment Desti stinatio tion
C Cho hoice ice
1. Source: The Economist – Asia Business Outlook Survey 2017 2. Source: IMF World Economic Outlook, Database April 2017 3. Source: United Nations Conference on Trade and Development (UNCTAD) – World Investment Report 2017 4. Source: JBIC – Outlook for Japanese Foreign Direct Investment (28th Annual Survey)
Tota tal Investm tment t / GD GDP (%)
Indo done nesia a Enjo joys Large Investm tments Relat lative to Peers within n the Region2 JBIC: C: Among ngst t ASEAN AN countr ntries, , Indo done nesia a is the most prefe ferred d plac ace for busine ness investme tment nt (Decemb mber 201 2016)4 The Econo nomi mist: : Indo done nesia a among ng the top 3 desti tinati nation n for attracti ting ng investo tors in Asia (Janua nuary 2017) 17)1
2,5 3,1 3,5 4,8 6,8 7,2 10,1 10,6 19,3 25,9 29,4 32,7 35,8 42,0 47,6 5 10 15 20 25 30 35 40 45 50 Turkey Korea Russia Singapore Malaysia Brazil Myanmar Philippines USA Mexico Thailand Vietnam Indonesia China India
% of surveyed who consider each country has promising prospects
18 18,9 21,3 24,8 25,3 26,3 27,7 28,4 33,3 39,4 46,2 53,7 55,7 71,6 10 20 30 40 50 60 70 80 Taiwan Singapore Japan Hong Kong South Korea Australia Malaysia Myanmar Thailand Phillipines Vietnam Indonesia India China
UNCTAD: AD: Indonesia a is listed d as the top 5 prospecti tive ve investme tment nt desti tinati nation in the world ld (June ne 2017) 17)3
32,75 34,17 25,09 20,55 22,25 27,58 31,42 34,29 26,06 23,60 22,01 26,58 31,43 34,30 25,48 25,41 24,30 27,18 5 10 15 20 25 30 35 40 India Indonesia Malaysia Philippines Thailand Vietnam 2015 2016 2017* * 2017 estimation
3 4 4 4 5 6 7 7 7 9 11 11 20 36 40
10 20 30 40 50 Australia (13) Canada (18) Singapura (18) Vietnam (14) Spain (25) Philippines (9) Mexico (7) Germany (5) United Kingdom (4) Brazil (7) Thailand (14) Indonesia (8) India (3) China (2) United States (1)
% of executives responding (x) = 2016 ranking
7
Natio iona nal Strategic tegic Dev evel elopmen pment Plan an (Nawa Cita ta)
Human Development
Educ ucation ion Healt alth Hous using ing Char aracte ter
Priority Sector Development
Food Securi rity ty Energy & Electr tric ical Securi rity ty Mari ritime time & Mari rine ne Touris urism & Indus ustry try
Water ter Security rity, Basic ic Infra rastru tructu ture re & Connect ectivity ivity
Equitable Development
Inte ter- Incom
Group
Inte ter-Reg Region: ion: (1) Rural al Area ea, (2) Perip ripher hery, y, (3) Outs tside ide Java, (4) Easte tern rn Area ea. .
Security & Order Politic & Democracy Governance
The 3 Dimensio ions
Econom
ic Develop
ment Necessary sary Condit ition
Legal Certainty & Law Enforcement
8
Equitable itable Economy Policy cy
Source: Coordinating Ministry for Economic Affairs The Eco cono nomi mic c Equa ualiz lizatio tion n Polic icy announ unced in April il 2017 embo mbodies natio iona nal l eco cono nomi mic c transfo nsforma matio tion n to succ ccessfully ully ove verco come me the middle le income me trap p and achieve ve the status us of a develope loped countr ntry in the long ng-te term Land nd Social Forest stry
The Ministry of Environment and Forestry (KLHK) will distribute access to social forest management covering an area of 211,522 ha for 48,911 families with total permits of 134 Initial focus will be on 11 villages with a total area of 15.576 ha for 9,411 households
Agraria ian Refo form m and Transmi migratio tion Land Legaliz izatio tion
Transmigration land of 220,000 ha and 3,800 ha under the National Agrarian Operation Project (PRONA) is ready to be legalized from a total of 4.5 million ha, while 23,000 ha of displaced land and 707,000 ha of forest disposal are also ready to be redistributed from a total of 4.5 million ha The Land Object of Agrarian Reform (TORA) will be expanded to several provinces, including Banten, West Java, Central Java, Riau, West Kalimantan, West Sumatra, North Sumatra, and Maluku
Affordable e Housing g for the Urban Poor
Committed to housing development within urban areas that are well connected to the center of activity, economic resources and public transportation for the urban poor Core housing policies, among others, include provision of land for affordable housing (land availability), implementation of Housing Scheme for MBR (social housing), and the Housing Financing Scheme
Three Key Pillars and “Quick Win” Programs Oppor por
nity ty
Targeted eted Devel elopme pment
tors
Focused on addressing issues related to the tax system, development of manufacturing and IT industries and retail sector Improve the competitiveness of the retail sector and strengthen synergies between traditional and modern retail
Human Capita ital
Vocatio ional Trainin ing g and Labour Markets ets
Vocational and labor policies structured for capacity building of human resources, especially to align with industry needs and to support government priority programs Policy steps will be taken by the government to draft and improve on the road map for vocational education and training, through reclassification and prioritization of business fields and positions Job matching program that will focus on strengthening vocational programs for industries Vocational schemes in place for the automotive, tourism and transportation sectors
9
The he Economic ic Policy cy Pac ackag ages es
“To improve national industry competitiveness, export and investment to generate significant economic growth”
Phase e III (7 Oct t ’15) Boosting investment, spurring exports, and maintaining people‘s purchasing power Phase e IV (15 Oct t ’15) Simplifying wage formula and expanding loans for small business Phase e V (22 Oct t ’15) Improving industry and investment climate through tax incentives and deregulation on sharia banking Harmo moni nizi zing ng Regulations
Simp mpli lifyin ying Bureauc ucratic Proc
Ensuring Law Enfo forceabi bili lity Phase VI (5 Nov ’15) Stimulating economic activities in border areas and facilitating strategic commodities availability Phase e I (9 Sept ’15) Improving national industry competitiveness Phase e II (29 Sept ’15) Easing permit requirement and simplifying export proceeds requirement Phase e VII (7 De Dec ’15) Stimulating business activities in labor-intensive industries nation-wide through incentives in the form of accelerating land certification process for individuals Phase e VIII I (21 De Dec ’15) Resolving land acquisition disputes, intensifying domestic
industries Phase e IX (27 Jan ’16) Accelerating electricity generation, stabilizing meat prices and improving rural–urban logistics sector Phase e X (11 Feb ’16) Revising the Negative investment List and improving protection for SMEs Phase e XI (29 29 Mar r ’16) Stimulating national economy through facilitation to SMEs and industries Phase e XII II (28 28 Apr’16) Improving Indonesia’s rank on Ease of Doing Business (EODB) Phase e XIII I (24 Aug ’16) Low Cost Housing for Low-Income Communities Phase e XI XIV (10 Nov ’16) Roadmap for E-commerce
Source: Coordinating Ministry for Economic Affairs
Phase e XV (15 Jun ’17) Development of Business and Competitiveness
10
Boosting ting the he Competitive petitivenes ness through ugh Lo Logisti stical al Efficienc ciency
..15th Econo nomy my Policy Packag age has been launche nched
Source: Coordinating Ministry for Economic Affairs
Policy cy Goals s and Benef efit its s
Strengthen the Institution
Single Window (INSW) Provide Market Opportunities for Shipping Companies, Marine Insurance, and National Ship Maintenance Businesses Increase Competitivenes
Providers
Policy cy Target ets
Import duty for 115 types
ship’s spare parts and components 0%
Opportunities for national shipping to serve export and import transportation
around
USD 600 00 millio lion/y n/year ear
70-100 units
new ships worth USD
700 00 millio lion
New employment
2,000 000 sai ailors rs
Improve the Regional Government’s role in development
Regional Logistics System to control inflation and reduce post-harvest product damage up to 30%
11
Thema ematic tic Policy cy Issues ues
D Der ereg egula ulatio tion
Next Phas ase of
icy Packages es based on
toral and Them ematic tic Issue ues Six policy issues es unde der Packag ages es I-XV:
improvem ement ent
indus ustr try compet etitiv itivene eness improvem ement ent
society’s purchasin ing power er widenin ening of
inves estmen ent expans nsio ion of
export efficienc iency of
logis istic tics sector improvem ement ent
touri rism sector
Education and Vocational Training Logistics Agrarian reform Energy Industry, Manufacture, Tourism, Fishery & Service sector Food Invention, Innovation and Creative Economy
Source: Coordinating Ministry for Economic Affairs
12
Progres ess
t the he Economic ic Policy cy Pac ackag ages es*
Initially, there are 233 regulations which need to be deregulated As of July 3rd, 2017, deregulation of 215 regulations are finished (97%), comprising 50 regulations at Presidential level and 165 regulations at Ministrial/Institutional level Unfinishe ished reg egula latio ions: Proposed Policy on Development
Service Providers
SET
REVOK OKED ED REGULATIONS TIONS
ON GOIN ING DISCU SCUSSION SION
170 TOTAL
165
MINIST STRIAL AL/I /INST NSTITUT TUTIO IONAL NAL LEVE VEL
47 47 42 42
SELESAIPRESI SIDE DENTI NTIAL
52 TOTAL
50 50 FINI
NISHED SHED
PRESIDENTIAL AL LEVE VEL
FINI NISHED SHED
TOTAL INITIA TIAL REGULATIONS TIONS
TOTAL REGULATIONS TIONS
Based
the further assessment, 11 regulations has been revoked from deregulation process Total regulation subject to be deregulated: 222 regulations
Source: Coordinating Ministry for Economic Affairs *as of July 5th, 2017
13
Other her Progress ess
Economic ic Policy cy Pac ackag ages es
14 Provinces have set 2016 Minimum Wage System in accordance to the Government Regulation (GR) No. 78/2015 (Kepulauan Riau, Kalimantan Barat, Nusa Tenggara Barat, Sumatera Barat, Jambi, Aceh, Kalimantan Selatan, Banten, Gorontalo, Nusa Tenggara Timur, Jawa Barat, Bali, Sumatera Utara, and Bangka Belitung)
Fair, Simplif ifie ied & & Project ctable able Wage Sys System
State-owned train manufacturer PT Industri Kereta Api (INKA) in Madiun, East Java, has begun its first passenger train exports by shipping 15 train wagon to Bangladesh.
Export-Orie rient nted Busine ness Credit it (KURBE) RBE) Develo lopmen ment
Spesial al Economic mic Zone ne (SEZ)
SEZs amounted IDR 33.8 trillion (as of September 2016)
companies benefitted from the simplification of fiscal incentive process with average processing time of 13.4 days (previously 2 years)
coconut product through SOEs’ joint program
launched to support various industries
Deregula ulatio ion
Logis istics ics Sect ctor
14
Improving ving Investment stment Clima imate te
…implement 3-hour ur investme ment nt licensing sing service ice to compleme ment the One Stop Service vice (OSS) S)
BKPMrive at OSS at BKPM directly from the airport
it the required documents & data Require iremen ent t for
lizi zing g 3-ho hour Inves estme tment t Lisen encin ing g Service vice:
No requir irem ement ents for investm estment ent in infrastr struc uctu ture sector
9 document ments
ined
Wait it at the lounge while documents are processed by BKPM, in-house notary, ministries, & other government institutions Obtain tain eight documents & letter of land availability within three hours to start the business
Certaint ainty to start a busines ess Certaint ainty to Import capital tal goods Certaint ainty to work rk Accurate land informatio ion
1. Minimum investment of IDR 100 billion (USD 8 million) and/or employing 1,000 local workers. 2. Application must be submitted directly by at least one candidate of the proposed company stakeholder
2 documen ments needed
Article of Association (Foreign company)
finished products
Inves esto tor iden entitiy titiy as the prospec ectiv ive shareh ehold lders ers Flowc wchart art
busines ess activities ities work rkflo low
Source: Investment Coordinating Board (BKPM)
Until il March ch 2017, 313 projec jects ts* have ve utilized the “3 hou
rs services ices”
* Since January 2016, including 12 projects in EMR sector
15
Improving ving Investment stment Clima imate te
…implement 3-hour ur investmen ment licensing sing service ice for Energy and Mineral al Resour urce ces Secto tor
Director arrives at central OSS, then submit required documents* Waiting in priority lounge, while the documents processed
1 2 3
Applicant receive the requested licensing products Note *: ESDM3J service is given if the company has fulfilled
the checklist of administrative & technical requirements as regulated on MEMR Ministrial Decree No.15 of 2016
9 Types es
licen ensing ing issue ued by ESDM3J M3J serv rvic ice
No. Type
Licen ensing ing Duratio ion for reguler uler servic ice (work rk days) 1 Temporary Business License for Electricity 20 2 Temporary Business License for Oil/Fuel/LPG storage 32 3 Temporary Business License for Storage
Processed Products/CNG 32/40 4 Temporary Business License for LNG Storage 32 5 Temporary Business License for Oil Refinery 32 6 Temporary Business License for Processing Oil Residue Industry 32 7 Temporary Business License for Natural Gas Processing 32 8 Temporary Business License for General Trade
Oil/Fuel 40 9 Temporary Business License for General Trade
Product 40
Source: Investment Coordinating Board (BKPM)
Until March ch 2017, 12 projects cts have utilize zed the 3 3 hours service ices for EMR Sector
16
Improving ving Investment stment Clima imate te
…implement nt Direct ct Construc ructio ion Permit it to attract ct invest stment nt in Indust ustrial rial Estates
Direc ect Construct uction ion (KLIK IK)
No Requir uirement ments
minimum investments
workers is required.
32 sele lecte ted indus dustrial rial esta tate tes.
permits can be
in parallel with construction process.
Investors can directly start their project construction before
both Cent Central al and and Regional gional Gov Gover ernme nment nts wh which ich become become the first step to to syner ergize gize betwe ween en central and local al licensi ensing ng
Obtain in investment licence at
OSS at national or regional level.
ey a land within selected
industrial estates.
ire the land for your
industry.
rt the constru tructio tion of your
required.
ly for building construction permit & environmental permit, in parallel with construction process.
Priority Investment Service Until il May 2017, 90 90 projects have utilized the “KLIK servi vices ces”
Source: Investment Coordinating Board (BKPM)
17
Improving ving Investment stment Clima imate te
…Direct Construc ructio ion Permit it is expanded nded to 32 Indust ustrial rial Estates (IE) E) throug ughou hout Indone nesia ia
1
Banten (3 3 IE IE; ; 3,150 3,150 ha)
Estate/MCIE (1,800 ha)
Industrial Park/WIIP (800 ha)
Cilegon/KIEC (570 ha) West Java (5 5 IE IE; ; 1.151 ha)
Estate/BFIE (300 ha)
Industrial City/KIIC (293 ha)
Industry/SCI (300 ha)
Karawang (100 ha) Central Java (3 3 IE IE; ; 840 840 ha)
(700 ha)
(40 ha)
Estate/KIW (100 ha)
East Java (1 1 IE; 1,761 ha)
KI Java Integrated Industrial and Port Estate/JIIPE (1,761 ha)
North h Suma matera (1 1 IE; 100 ha)
Medan Industrial Estate/KIM (100 ha)
South Sulawes esi i (1 1 IE IE; ; 3,000 000 ha ha)
Bantaeng Industrial Park/BIP (3,000 ha)
KLIK 1st
st Stag
age (14 IE) KLIK 2nd
nd Stag
age (18 IE)
1 2 3 4 5 6 3 5 6 7
1 2 3 4 5 6
East Java (2 IE; 341 341 ha) 1. IE Maspion (151 ha) 2. IE Tuban (190 ha) East Kalima manta tan (1 1 KI KI;133 133.8 8 ha ha) IE Kariangau (133.8 ha) Riau Island (5 IE; 556 ha)
Park (61.4 ha)
Park II (20 ha)
Industrial Estate (142.5 ha)
Estate (229.6 ha)
Industrial Park (102.5 ha) West Java (6 IE; 1,814 814.1 1 ha)
(315.1 ha)
Industrial Center (GIIC)/Deltamas (400 ha)
(45 ha)
City (510 ha)
Indah (300 ha)
ha) Central Java (1 1 IE IE; ; 285 285.7 7 ha ha) IE Demak (285.7 ha)
2
1
Riau (1 IE IE; ; 198 198.9 9 ha) IE Dumai (198.9 ha)
2
4
DKI Jakarta ta (2 IE; 129 129 ha)
Nusantara/KBN (118.6 ha)
Estate Pulagadung/JIEP (10.4 ha)
3 6 4 7 5
Source: Investment Coordinating Board (BKPM)
18
(Pusat Logistik Berikat/PLB) is a facility provided by Ministry
Finance as part
the implementation
the 2nd Economic Policy Package. PLB facility aims to improve efficiency and reduce the cost of transportation and logistics in Indonesia; support the growth of the domestic industry, including small and medium industries; increase investment; and to make Indonesia to become a logistics hub in Asia Pacific.
To To da date, e, 30 30 Bo Bond nded ed Logis gistic tic Cent nter ha has been en laun unched hed to to suppo pport variou rious indus dustries ries.
Improving ving Investment stment Clima imate te
…Bonded Logistic Center to Improve Indonesia’s Competitiveness
Oil il and ga gas, s, and mining ing industry dustry Food & bev ever erag ages industry dustry Auto to- motiv tive industry dustry Per erson
al care/ home care industry dustry Textile tile (cot
ton) industry. dustry. Smal all and medium dium industry dustry Synt nthe hetic tic textile tile (chem hemic ical al substan ances) es) industry. dustry.
Bonded Logistic Center
19
Impr proving ving Invest stment ment Clima imate te
…revising the Negative Investment List
1 For total project value of IDR10bn and aboveBefore
Cold storage ge Restaurants, , Bars Pharmaceutical Raw Materials Manufacturing Sports Center, Film P Processing Lab, Crumb Rubber
Revisio ion of "Partnership ip" category y to refer to partnership ip with Micro, Smal all and Mediu ium Enterpris ises (MSME MEs) Gran andfat ather Law: If a par artic icul ular ar sector is tightened in futur ure, existin ing foreig ign n investor does not need to comply with tighter stak ake Key Reforms in Negative ive Foreig ign Investment List Strengthen implementatio ion of negative investment law throug ugh active ive roles from min inistrie ies, agencie ies and regio ional al governments
100% 49% 100% 51% 100% 85% 100% 95% 100% 33% 67% 51% 67% 67% 55% 67% 65% 67%
Distribution,
housing Private Museum, Catering, g, apparel Manufacturing, g, Exhibitions
Conve ventions
Toll Road Operator, Telecom
Consultancy for Construction
Telecom
der with Integrated d Servi vices Profession
, Golf Course Management, , Air Transport
vices, , Trave vel Bureau
After Before After Before After Before After Before After Before After Before After Before After Before After Before After 33% 49%
Introduc uctio tion n of New w Foreig ign n Owne wnership ip Regula ulatio tion n for Strate tegic ic Secto ctors Source: Investment Coordinating Board (BKPM)
20
Improving ving Investment stment Clima imate te
…improving Indonesia’s Rank
Ease
Doing ng Busine ness (EODB)*
EODB 2017 Rank nk EODB 2016 Rank nk Chan hange in Rank nk EODB 2017 Point ints EODB 2016 Point ints Chan hange in Point ints
Overall all 91 91 106 106 15 15 61.52 58.51 3.01 Start rting ing a busines ess 151 167 16 76.43 67.51 8.92 Dealing ing with Constr truc uctio ion Permit rmit 116 113 3 65.73 65.26 0.47 Getting ng Electr tric icity ity 49 49 61 12 80.92 77.60 3.32 Registering tering Property erty 118 123 5 55.72 53.24 2.48 Getting ng Credit it 62 62 70 8 60.00 55.00 5.00 Prote tecting ting Mino nority ity Inves esto tors 70 70 69 1 56.67 56.67 Paying ing Taxes 104 104 115 11 69.25 64.47 4.78 Trading Across Border ers 108 108 113 5 65.87 63.53 2.34 Enforcing ing Contrac acts ts 166 171 5 38.15 35.37 2.78 Resolv lving ing Insolv lven ency 76 76 74 2 46.46 46.48 0.02
Source: World Bank * Higher rank is better, EoDB 2017 was published in October 2016
21
Improving ving Investment stment Real aliza izatio tion (Q2-201 2017) 7)
IDR tn
2013 2014 2015
Risin ing Direct ct Inve vestme tments nts
2016
Mini ning ng Wood Indust ustry Rubbe ber and Plastic tic Indust ustry Metal, tal, Machine chinery & & Ele lectroni nic c Ind ndust ustry US$ US$100.6 .6 mn US$ US$62.7 .7 mn mn US$ US$137.3 .3 mn mn US$ US$1006.3 .3 mn mn US$ US$1131.2 .2 mn mn US$ US$705.3 .3 mn mn Food Indus ustry
35.7%
US$ US$437.1 .1 mn mn
102.7% 26 26.6% 6% 40 40.8% 8% 1.5% 6.8% 87 87.6% 6% Invest stment nt Reali liza zatio ion
Textil xtile Indust ustry US$ US$76.1 .1 mn
20 20.9% 9%
FDI Reali lizatio tion n by Secto ctors
Source: Investment Coordinating Board (BKPM), compared to Q2-2016 period
2017
Rp145.4 5.4 T Rp159.4 9.4 T IDR99.4tn tn IDR109.9 109.9tn tn IDR52.2 52.2tn tn 434 434,463 463
9.6 9.6% 15.6 .6%
10.6% 16.9%
Q1-201 016 Q1-201 017 Q2-201 016 Q2-201 017 Q1-201 016Q1-201 017 Q2-201 016 Q2-201 017
*
* * person son 37 375,9 ,982 IDR151.6 151.6tn tn IDR170.9 170.9tn tn
12.7% 7%
Q2-201 016 Q2-201 017
IDR61tn tn Trade & Repar paratio tion Non Metallic tallic Mine neral l Indust ustry 110 61 171
20 40 60 80 100 120 140 160 180 Q1 Q2 Q3 Q4 Q1 Q2 Q3 Q4 Q1 Q2 Q3 Q4 Q1 Q2 Q3 Q4 Q1 Q2 FDI DDI TOTAL
23
Conducive cive Environment ment Underpin rpinning ning Strong ng Growth th Fundam ament ental als
Larges gest t Economy my in South East Asia 4th Most Populous country y in the World; ; 64% in productiv tive e age Manageable Inflatio tion Rate Growin ing g Middle e Income me Class
From commodity-based to man anufa ufactur urin ing and servic vice sectors via infrast astruc ucture development From consum umptio ion-led d to investment nt-led d growth via a stronger man anufac ufactur urin ing sector and more investment init itia iative ives Policie ies to main aintai ain pur urchasing asing power to stim imulat ate domestic ic economy in the mid idst
ing mac acroeconomic ic condit itio ions Budget reform as a a part of larger economic ic reform init itiat iative Tax base to be broad adened from
uce dependency on commodit itie ies Fuel subsid idie ies signif ific ican antly y reduc uced and spendin ing redir irected to more produc uctive allocat atio ion Prud udent debt man anag agement
Reform rm-Or Orien iented ted Adminis inistr tratio ion
Three main ain sources of finan ancin ing for investment needs: Stat ate and regio ional al budget, Stat ate Owned Enterpris ises and PPP Contin inui uing from 2015 polic icy, infras astructur ure will be higher than fuel subsid idy Fiscal al and non-fis iscal al incentive ives to attrac act infras astructur ure investment and promote PPP Infras astructur ure spend nding ing focused d on basic ic infras astructur ure projects
Larg rge e and d Stable able Econo nomy Consi nsiste tent nt Budg dget t Reform
New Econom nomic ic Structu ructure re High h Infras rastruc ructu ture re Investmen ents
24
Indonesia’s Strong GDP
Growth th Prospe pect ct GDP Growth th Based on Expe xpend nditur itures (%, YoY YoY)1 Strong ng GDP Growth th1
By expen pendit diture 2014 14 2015 15 2016 16 2017 17 Q1 Q1 Q2 Q2 Q3 Q3 Q4 Q4 Tot. Q1 Q1 Q2 Q2 Q3 Q3 Q4 Q4 Tot. Q1 Q1 Q2 Q2 Q3 Q3 Q4 Q4 Tot. Q1 Q1
5.2 5.2 5.1 5.1 5.1 5.0 5.0 5.0 4.9 5.0 5.0 5.1 5.0 5.0 5.0 4.9 Non profit HH. consumption 23.2 22.4 5.8 (0.5) 12.2 (8.1) (8.0) 6.6 8.3 (0.6) 6.4 6.7 6.6 6.7 6.6 8.0 Government consumption 6.1 (1.8) 1.2 0.9 1.2 2.9 2.6 7.1 7.1 5.3 3.4 6.2 (2.9) (4.0) (0.1) 2.7 Gross Fixed Cap. Formation 5.4 4.0 4.4 4.1 4.4 4.6 4.0 4.9 6.4 5.0 4.7 4.2 4.2 4.8 4.5 4.8 Exports 3.1 1.5 4.9 (4.4) 1.1 (0.7) (0.3) (0.9) (6.4) (2.1) (3.3) (2.2) (5.6) 4.2 (1.7) 8.0 Imports 5.1 0.4 0.2 3.0 2.1 (2.6) (7.4) (6.6) (8.7) (6.4) (5.1) (3.2) (3.7) 2.8 (2.3) 5.0 GDP 5.1 4.9 4.9 5.0 5.0 4.8 4.7 4.8 5.2 4.9 4.9 5.2 5.0 4.9 5.0 5.0 %
Instit itutio ions 2017 GDP growth (% (%YoY) 2017 R-Budget Plan 5.2 Bank Indonesia 5.0-5.4 IMF 5.1 World Bank 5.2 ADB 5.1 Consensus Forecast (July 2017) 5.2
Favo vour urable ble GDP Growth th Compar pared to Peers2
1. Source: Central Bureau of Statistics of Indonesia (BPS) 2. Source: World Economic Outlook Database - April 2017; * indicates estimated figure % QoQ YoY
1,0 3,0 5,0 7,0 9,0 2012 2013 2014 2015 2016 2017* 2018* Brazil India Indonesia Malaysia Philippines Singapore Thailand Turkey 0,04 3,83 3,27 (2,07) (0,17) 3,75 3,30 (1,70) (0,40) 4,01 3,13 (1,77) (0,34) 5,12 4,94 4,93 5,05 4,82 4,74 4,77 5,17 4,92 5,18 5,01 4,94 5,01
1,0 3,0 5,0 7,0 Q1 Q2 Q3 Q4 Q1 Q2 Q3 Q4 Q1 Q2 Q3 Q4 Q1 2014 2015 2016 2017
25
Strong ng an and Stable able GDP Perf rform rman ance ce
Contribu ibutor tors to GDP Growth th by Secto ctor (%, YoY YoY) Spatia tial l GDP Growth th
By sectors 2014 14 2015 15 2016 16 2017 17 Q1 Q1 Q2 Q2 Q3 Q3 Q4 Q4 Tot. Q1 Q1 Q2 Q2 Q3 Q3 Q4 Q4 Tot. Q1 Q1 Q2 Q2 Q3 Q3 Q4 Q4 Tot. Q1 Q1 Agriculture, forestry, and fishery 5.2 4.9 3.6 3.3 4.2 3.8 6.5 2.9 1.6 3.8 1.5 3.4 3.0 5.3 3.3 7.1 Mining (1.2) 0.7 0.7 1.5 0.4 0.6 (3.6) (4.4) (6.0) (3.4) 1.2 1.2 0.3 1.6 1.1 (0.5) Industrial processing 4.5 4.9 5.0 4.2 4.6 4.1 4.2 4.6 4.4 4.3 4.7 4.6 4.5 3.4 4.3 4.2 Construction 7.2 6.5 6.5 7.7 7.0 6.0 5.4 6.8 7.1 6.4 6.8 5.1 5.0 4.2 5.2 6.3 Big traders, wholesale, retail 6.1 5.1 5.2 4.4 5.2 3.8 1.6 1.4 3.7 2.6 4.1 4.1 3.6 3.9 3.9 4.8 Transportation and warehousing 7.0 7.6 7.7 7.2 7.4 5.8 5.9 7.3 7.7 6.7 7.9 6.9 8.3 7.9 7.7 7.6 Information and communication 9.9 10.7 9.8 10.1 10.1 9.7 9.3 10.6 9.2 9.7 7.6 9.3 9.0 9.6 8.9 9.1 Financial service and insurance 3.6 5.5 1.9 7.9 4.7 8.6 2.6 10.4 12.8 8.6 9.3 13.6 9.0 4.2 8.9 5.7 Other Services 8.4 9.5 9.5 8.4 8.9 8.0 8.1 8.1 8.2 8.1 7.9 7.9 7.7 7.7 7.8 8.0 GDP 5.1 4.9 4.9 5.0 5.0 4.8 4.7 4.8 5.2 4.9 4.9 5.2 5.0 4.9 5.0 5.0
Java: 58. 58.5% 5% Sumater era: 22.0% Maluku ku & Pap apua: a: 2.5% Sulawesi: esi: 5.9% 9% Kalimantan an: 8.3% Bali & Nusa Tengga gara: a: 3. 3.0% 0%
Spatia tial l GDP Growth th Contribu ibutio tion
Sumatera GDP Grow
Q1 2017: 2017: 4.1% Java GDP Grow
Q1 2017: 2017: 5.7% Kalimantan GDP Grow
Q1 2017:4.9% Sulaw awesi si GDP Grow
Q1 2017: 2017:6. 6.9% Maluku ku & Papua GDP Grow
Q1 2017: 4.2% Bali & Nusa sa Tenggara GDP Grow
Q1 2017: 2.4%
27
1,96 1,63
0,0 1,0 2,0 3,0 1 3 5 7 9 11 1 3 5 7 9 11 1 3 5 7 9 11 1 3 5 7 9 11 1 3 5 7 9 11 1 3 5 2012 2013 2014 2015 2016 2017
OG Non-OG Total
6 9 12 15
40 60 80 100 120 140 1 3 5 7 9 11 1 3 5 7 9 11 1 3 5 7 9 11 1 3 5 7 9 11 1 3 5 7 9 11 1 3 5 2012 2013 2014 2015 2016 2017
FX Reserves (LHS) Month of Import & Debt Service (RHS)
Month
A Nar arro rower er, , Stru ructur ctural ally ly-Str tronger nger Curr rrent nt Account nt Deficit ficit
Imp mprovin ing g Current t Account Defic icit it Strong g Balance e of Payme ments Supported ted by Substantia tial FX Reser erves es to Mitiga igate te Exter ernal Challen enges ges Trade e Balance e Surplus Continues es
Source: Bank Indonesia Source: Bank Indonesia US$bn US$bn
2015 2015: CA Defic icit (US$17.5bn) n) 2012: 2012: CA Defic icit (US$24.4bn) n) 2013: 2013: CA Defic icit (US$29.1bn) n) 2014: 2014: CA Defic icit (US$27.5bn) n) US$bn (7.5) (1. 1.4) 5.7 0.8 (2.4)
Source: Bank Indonesia FX Reserves s as of June 2017: US$123.09bn n (Equiv
ths s of impo ports ts + servic icin ing of government t debt) t) US$bn
201 2016* 6*: CA Defic icit (US$16.9bn) n)
Source: BPS * Preliminary Figure ** Very Preliminary Figure 40 80 120 160
10 20 Q1 Q3 Q1 Q3 Q1 Q3 Q1 Q3 Q1* Q3* Q1* 2012 2013 2014 2015 2016* 2017** Current Account Capital & Financial Account Overall Balance Reserve Assets (RHS)
4 8 Q1 Q3 Q1 Q3 Q1 Q3 Q1 Q3 Q1* Q3* Q1* 2012 2013 2014 2015 2016* 2017** Goods Service Income Secondary Inc. Current Account 121 121.8 7.9 4.5 (2.4) US$bn 2015: 2015: Surplus US$7.59bn 2012 2012: Defic icit (US$1.7 .79bn) n) 2013 2013: Defic icit (US$4.1 .10bn) n) 2014 2014: Defic icit (US$2.3 .37bn) n) 201 2016: : Surplus US$8.83b 3bn 2017: 2017: Surplus US$ US$7,63bn bn*
28
2,85 1,55 1,37 1,30 1,15 1,13 0,92 0,8 0,17 0,00
0,33 1,59 0,33 0,20
0,55
0,51
0,5 1,5 2,5 3,5 ZAR EUR THB TRY JPY CNY MYR SGD IDR INR PHP KRW BRL Point to Point Average
Exchang ange Rate In Li Line ne with Fundam ament entals als
Stable ble Move veme ment nt of Rupia iah Poin Point-to to-point
the the rupiah piah stre rengthened gthened 1.08 08% (pt ptp) to to clos
at a le level vel of
Rp13 13,328/USD
appreciation was bolstered by the ongoing FX sales by corporations and a considerably large influx
foreign capital into the domestic market, and also in line with the appreciation in the regional currencies. Rupia iah Exc xchang nge Rate Fared Relative latively ly Well ll Compar pared to Peers
Source: Bank Indonesia
IDR/US$
*data as of June 30th, 2017
YTD 201 2017* vs 201 2016 June vs May 2017
*data as of June 30th, 2017 *data as of June 30th, 2017
% %
11,17 9,60 2,14 1,62 1,60
5,09
5,18 5,61 5,39 1,08 7,96
4,51 0,08
0,0 5,0 10,0 15,0 ZAR BRL INR THB KRW IDR EUR PHP MYR TRY Point to Point Average
13328 13361 13338 13345 13304 13321 13298 13348 13309 13.200 13.250 13.300 13.350 13.400 13.450 13.500 3-Jan 11-Jan 19-Jan 27-Jan 4-Feb 12-Feb 20-Feb 28-Feb 8-Mar 16-Mar 24-Mar 1-Apr 9-Apr 17-Apr 25-Apr 3-May 11-May 19-May 27-May 4-Jun 12-Jun 20-Jun IDR/USD Monthly Average Quarterly Average
29
Ampl ple Li Lines of D Defen efense se Against ainst Ext xter ernal nal Shocks cks
Ample level of FX reserves to buffer against external shock
FX Reserves as of June 2017: US$123.09 billion
South th Korea
Renewed a 3 year KRW/IDR swap arrangement with the size of up to 10.7 tn KRW/IDR115 tn in March 2017
Australia alia
Established a 3 year A$/IDR swap arrangement with the size of up to A$10 bn or IDR100 tn in Dec. 2015
Chia iang g Mai i Initia tiative tive Multila ltilatera terali liza zation tion (CMIM IM) ) Agreem eemen ent
Entitled to a maximum swap amount of US$ 22.76 bn under the ASEAN+3 (Japan, China, and Korea) FX reserves pool created under the agreement
Came into effect in 2010 with a pool of US$120 bn
Doubled to US$240 bn effective July 2014
Japan
US$22.76 billion swap line with Japan currently in place
The size of the swap line was increased from US$12 bn in December 2013
IMF Global al Financ ncial ial Safety ty Net
Indonesia is entitled to access IMF facilities for crisis prevention to address potential (actual) BOP problem
Such facilities include Flexible Credit Line (FCL) and Precautionary and Liquidity Line (PLL)
Bilateral teral Regio iona nal Globa bal FX Reserv rve
Ampl ple Reserve ves Swa wap p Arrang ngeme ment nt
Source: Bank Indonesia
30
Measu asures es to Man anag age Ext xter ernal nal Volatility tility
Pre-em emptiv tive Measur ures es
and continuous dialogue with market participants
2017 budget law
cooperation
Crisis is Management nt Prot
Securities Market condition (normal, aware, alert, crisis)
‐ Repurchase the government securities at secondary market ‐ Postpone or stop the issuance
Firs rst Line
Defense
State’s Budget Buyback fund at DG of Budget Financing and Risk Management Investment fund at Public Service Agency (BLU) (min. level Aware) State e Owned ed Enterprises’s Budget get Related SoE (min. level Aware) Socia ial l Securi rity y Orga ganiz izin ing g Agency (BPJS)’s Budget BPJS (min. level Aware)
Second nd Line
Defense
State’s Budget State General Treasury Account (Rekening KUN) (min. level Alert) Accumulated cash surplus (SAL) (min. Level Crisis) State e Owned ed Enterprises’s Budget get Related SoE (min. level Alert) Socia ial l Securi rity Orga ganiz izin ing g Agency (BPJS)’s Budget BPJS (min. level Alert)
Bond nd Stab abiliz ilization ion Framework
Source: Ministry of Finance
31
Comply Not Comply 2,257 (93.3%) 161 (6.7%) Comply Not Comply 2,170 (89.7%) 248 (10.3%)
50 100 150 200 250 300 350 400 50 100 150 200 250 300 2013 2015 Feb 2016* Apr 2016* Jun 2016* Aug 2016* Oct 2016* Dec 2016* Feb 2017* Apr 2017* Public (Govt. & BI) Private Total (RHS)
Streng engthened hened Pri rivate te Exter erna nal Deb ebt Risk Man anag agem ement ent
(US$bn)
Source: External Debt Statistics of Indonesia, July 2017 Source: Moody’s Statistical Handbook, May 2017
Regulat atio ion Key Points Phase 1 Jan 1,2015 – Dec 31,2015 Phase 2 Jan 1,2016 – Dec 31,2016 Phase 3 Jan 1, 2017 and beyond Object of Regulat atio ion Governs all Foreign Currency Debt Hedgin ing Ratio io < 3 months 20%* 25%** > 3 – 6 months 20%* 25%** Liqui quidit ity y Ratio io ( < 3 months) 50% 70% Credit Ratin ing Not applicable Minimum rating of BB- Hedgin ing tran ansac actio ion to meet hedge ratio not necessarily be done with a bank in Indonesia Must be done with a bank in Indonesia Sanction As of Q IV-2015 Applied
Exter ernal Debt bt / GDP P (%)
(US$bn)
Debt bt Burden n Indic icator tor (Exte xterna nal l Debt bt / GDP) Rema main ins Compar parable ble to Peers Priva vate te Exte xterna nal l Debt bt is Stabili bilizin ing and Trend ndin ing Down Encouragin ing Corpo porate tes Compli liance on Hed edgin ing Ratio io
(%)
> 3 – 6 mont
hs < 3 mont
Total Ext. Debt: US$334bn Priva ivate Sector
US$165b 5bn
Source: Bank Indonesia * Provisional Figures
26,2 26,5 33,3 36,1 37,4 46,1 26 24,6 36,4 34,1 34 47,1
5 10 15 20 25 30 35 40 45 50 India Philippines Thailand Indonesia Brazil Turkey 2016 2015 Q1-201 017 (Total = 2,418 18) Q1-201 017 (Total = 2,418 18)
32
Man anag ageable eable External rnal Debt bt Profile le
... ...short
term non-bank bank corpor porate debt (non affil ilia iati tion
repr presen ents
8.9% %
total priva vate te external ernal debt
Priv ivate te Short-Term Term1 Priv ivate te Non-Bank Exter ernal Debt Positio tion
Af Affil iliat iation Non Af Affil iliat iation
US$118.8bn
71.9%
Debt US$19.9bn
12.0%
US$11.9b 1.9bn
7.2 7.2%
ate Ext. . Debt t US$14. 4.7bn 7bn
8. 8.9%
ate Ext. . Debt t
Public ic Long Term 1 Priv ivate te Bank
US$26.5bn
16.1%
US$165.2 .2bn bn
49.5 9.5%
US$46.4bn bn
28.1%
External Debt Position as of May 2017
1 Based on remaining maturity
Source: External Debt Statistics of Indonesia, July 2017
US$333.6bn bn
US$168.4bn
50.5%
Debt
34
Integr egrated ted Reform rm to Provide Higher gher Qual ality ity
mic Growth th
.. ...syne nergy between authorit ritie ies to drive econo nomy my navigating ing the chall lleng nges
and realistic budget
budget execution
to maintain consumption and improve investment climate
policy packages
management
policy to ensure macroeconomic and financial system stability
policies Fiscal al Real al Secto tor Mone netary ary & Finan ancial ial Secto tor
Sy Synergy gy in reform rm to boost the more sustainab nable le and inclu lusiv ive growth wth
Source: Ministry of Finance
35
Lo Long Term rm Strategie tegies to Achiev ieve Susta tainable inable Growth th
…stimul uli to maintain ain purchas chasing ing power
Consumptio
ion is still the larges est contr ntrib ibuto utor to Indonesia’s GDP
Private
consumption has been a key factor driving Indonesia’s economic growth in recent years
The
government has designed stimulus program to mainta tain in and enhanc nce purchas asing ing powe wer for households
The
government has increased non-taxa taxable ble incom
level and adjus usted ed wage polic icy to ensure that the lowest income bracket has the greatest support
Funds
are targeted at not
ly to improve basic vill llage infras astr truc uctur ture but also to crea eate jobs through labor intensive projects as well as
job creation programs
u Fuel pric ice e and elec ectric icit ity adjustmen ent Predi edicta ctabl ble e labo bour wages ges Boostin ing g housin ing g devel elopm pment Elimin ination n of luxury goods tax for consumer er goods 2 months addit ditio ion of rice ce subsidy idy progra gram Rural transfer fer for produ ductive e spen endin ding Ease of land d certifica fication and lice censin ing g for street eet vendo dors
Maint ntaining ining Purchasing chasing Power wer
Increa ease non-taxabl ble income e limit it Stabi bilized ed pric ice e for meat produ ducts
The e Virtu tuous
le of Purc rchas hasing ing Power er Stimu imuli li
36
Lo Long Term rm Strategie tegies to Achiev ieve Susta tainable inable Growth th
…stimul uli to promote te invest stment nts
Licen ensing ing Incent ntiv ives Tax Incen entiv tives es Other Incen entiv tives es Busines ess and Infras astr truc uctur ure Incen entiv tives es
Tax incen entiv tives es
perty ty Spec ecia ial economi mic zones Relaxa xatio tion of negative tive foreign ign inves estmen tment list Integr egrated ted logis istic tics s zones CPO CPO fund Support t for export-orien iented ted industr tries ies Village ge-city ity logis istic tics imp mproveme vement Accel eler eratio tion
infrastructure Income me tax relief ief for labor intensive sive industr tries ies Permi mit t & licen ensing ing simp mplfi ficatio tion One ma map polic icy Incen entiv tives for footwea ear and apparel el industr tries ies Simp mplif ific icati tion of imp mport licen ensin sing g for drugs and raw food Accel eler eratin ting infrast structure devel elopme pment Water ma manageme ment and regulati tion Tax incen entiv tives es for REITS EITS Relaxa xatio tion of entry visa polic icies ies Expansio sion of cover erage ge and interest est subsidy for MSME Dwellin ing g time me
mizatio tion Oil refin iner ery devel elopme pment Avia iatio tion secto tor incen entiv tives Downstrea eam industr tries ies Debt To equit ity y ratio
37
Build lding ing a Credib ible le an and Real alist istic ic Budget et
…providing more certainty to all stakeholders
Indic icator 2016 16 2017 17 Realiz ization¹ n¹ Budget dget June e Real. R-Budge Budget4 Economic ic growt wth (%, yoy) 5.02 5.1 5.012 5.2 Inflatio ion (%, yoy) 3.02 4.0 4.37 4.3 3-Mo Month Treasury y Bill (SPN PN) (%) 5.7 5.3 5.1 5.2 Exchang nge Rate (Aver erage ge, IDR IDR/US USD, Avg.
13,307 13,300 13,331 13,400 ICP (USD/ba barrel) 40 45 48.9 50.0 Oil il Productio ction n (thousand nd barrel el/da day) 829 815 784.23 815.0 Gas Produ ductio ction n (thousand nd barrel el oil equiv ivalent/da day) 1,180 1,150 1,0943 1,150
Macroeconomic Assum umptio ion for 2017 R- Budget
Source: Ministry of Finance 1. Audited 2. Q1 GDP Growth
Credib dible le and re reali listic tic budget with 2016 outlook numbers used as the basis for the 2017 State Budget
relative to Q1 2016
revenue in 2016 grew 3.6%, which includes IDR 103.1 trn from the tax amnesty program, which has further increased to IDR 134.8 trn as of Q1 2017
prioritizes efficiency in terms
spending, without compromising capital spending
discipline in maintaining budget deficit at reasonable levels
Descrip iptio ion (IDR Trillion) n) 2016 16 2017 17 Audit dited ed Realiz ization Budg dget et R-Bu Budg dget ∆ R-Budge Budget to Budget dget 1H Realiz ization ion % Realiz izatio ion n to Budget dget A. A. Reven enues es and Grants 1,555. 555.9 9 1,750. 750.3 3 1,736. 736.1 1 (14. 4.2) 2) 718. 8.2 2 41.0 .0% %
estic Reven enue 1,546. 546.9 9 1,748. 748.9 9 1,733. 733.0 (15. 5.9) 9) 718. 8.0 41.0 .0% %
1,284.9 1,498.9 1,472.7 (26.2) 571.9 38.2%
262.0 250.0 260.2 10.2 146.1 58.4%
9.0 1.4 4 3.1 1 1.7 7 0.2 2 15.5 .5% % B.
pendi diture 1,864. 864.3 3 2,080. 080.5 5 2,133. 133.3 3 52.8 .8 893. 3.3 3 42.9 .9% %
ernm nmen ent Expe pendi diture 1,154. 154.0 1,315. 315.5 5 1,367. 367.0 51.5 .5 498. 8.6 6 37.9 .9% %
684.2 763.6 773.1 9.5 263.9 34.6%
469.8 552.0 593.9 41.9 234.6 42.5%
fer to Regio egion and Village ge Fund 710. 0.3 3 764. 4.9 9 766. 6.3 3 1.4 4 394. 4.8 8 51.6 .6%
663.6 704.9 706.3 1.4 360.4 51.1%
46.7 60.0 60.0
7.3% C. C. Prim imary y Balance ce (125 25.6) .6) (109 09.0) .0) (178 78.0) .0) (69. 9.0) 0) (68. 8.2) 2) 62.6 .6% %
plus (Defici eficit) (308 08.3) .3) (330 30.2) .2) (397 97.2) .2) (67. 7.0) 0) (175 75.1) .1) 53.0 .0% % % of GDP (2.4 .49) 9) (2.4 .41) 1) (2.9 .92) 2) (0.5 .51) 1) (1.2 .29) 9)
cing ng 334. 4.9 9 330. 0.2 2 397. 7.2 2 67.0 .0 209. 9.4 4 63.4 .4% %
38
A More Real alis istic tic 2017 Tax ax Revenue nue Tar arget et
…taxation policies are directed at expanding the tax base and increase compliance
Source: Ministry of Finance
Target
IDR 26,2 trillion lower than 2017 budget
R-Budg udget 2017:
2014: 4:
1,146 46.8 .8
2015: 5:
1,24 240. 0.5
2016:
1,28 285. 5.0
Budg dget et 2017:
1,49 498. 8.9
8,2 3,6 6,8 16,0
IDR 41,8 ,8 T IDR 1.241,8 1,8 T IDR 189,1 ,1 T
↑ IDR 5,8 T (16,2%) ↓ IDR 2,1 T (-1,1%)
Tax Collection Growth (yoy, %) Comparison between 2017 R-Budget with 2017 Budget
Tax Revenue nue (in IDR Trilli llion) n)
collection in 1H2017 has been higher by 9.6% than 1H2016
collection growth target has been adjusted from 16.0% to 14.6% in
to be more credible
post tax amnesty program and tax treaty, tax audit, as well as law enforcement are expected to support tax collection
14,6 ,6
↓ IDR 29,9 T (-2,4%)
39
Indonesia’s Tax Amnesty Program – A Succes ess Story ry
With more than 965,000 taxpayers rs particip cipating ing in the program
Source: Ministry of Finance
Tax Amne nesty ty Resul ult (as of the end nd of March ch 31st
st, 2017)
Redemptio mption n Money ney Assets ts Decla clared
114,2 18,8
1,7 Preliminary Evidence Payment 1% Redemption Money 85% Tax Arrears Payment 14%
Reven enue IDR 134. 4.8t 8tn n (~1. 1.1% 1% GDP) P)
3.323,36 861,81 594,99 85,59 Individuals 68% Individual SMEs 18% Companies 12% SMEs 2%
Compo posit ition n of Partic icipa ipants Based ed on Asset et Declared ed
0,04 0,15 0,20 0,62 1,10 0,58 0,17 0,12 0,04 Germany (2004) Belgium (2004) Italy (2009) Chile (2015) Indonesia (2016) India (1997) South Africa (2003) Spain (2012) Australia (2014) % of GDP 2,1 3,9 8,3 39,3 5,2 3,6 0,3
India (1997) Spain (2012) Chile (2015) Indonesia (2016) Italy (2009) South Africa (2003) Australia (2014)
% of GDP 3,698 1,036 147,1
Onshore Declaration 76% Offshore Declaration 21%
Repatriation 3%
Asset Declared IDR 4,881tn (~39.4% of GDP)
40
Compr prehen ehensiv ive Tax Reform rm to Improv
and Susta tain in Revenue enue Collection ection
Focused sed
expanding ing taxpayer database, base, improving ing busine ness proce cesses, ses, revisi sing ng regula ulatio ions ns and streng ngthe henin ning support system
56.2% 59.2% 60.4% 62.3% 49% 54% 59% 64% 10 20 30 40 2013 2014 2015 2016 Registered Taxpayers Registered Taxpayers – Tax Report Required Submitted Tax Report Compliance Rate = Submitted Tax Report/Registered Taxpayers-Tax Report Required
Expe xpecte cted Tax Reve venu nue / GDP Increase (%) Ongoi ngoing ng Comprehensi nsive ve Tax x Reform m on 4 Pillar lars Compl plia ianc nce Rate te in Submi bmitt ttin ing Annu nual l Tax x Repor port
Source: Ministry of Finance
Human Resources Business Process
resources and
capabilities
task force team
Do-Check-Action to monitor tax collection
party data (banking)
Automatic Exchange of Information
registration
Regulation
Procedures
IT Support
communication system
public data for individual data management
management
11,2 11,4 11,3 10,8 10,7 10,4 11,5 5 10 15 2011 2012 2013 2014 2015 2016 2017 Budget
41
Regio gional al Reven enue ue and Exp xpenditure nditure Pro rofile le
…effective expendit iture ure policy as a tool to promote equalit lity across Indone nesi sia
SUMATERA TERA Reven enue 141.1
66.9
6.8
70.4 Expen enditu iture 232.3
176.1
Spending 56.2 Nett tt (88.2) JAVA Reven enue 1.143.2
884.9
161.6
96.6 Expen enditu iture 302.8
201.8
Spending 101 Nett tt 840.4 BALI I & NUSRA Reven enue 15.5
11.7
1.5
2.3 Expen enditu iture 56.4
39.5
17.0 Nett tt (40.9) KALIM IMAN ANTAN AN Reven enue 86.0
32.0
1.1
52.9 Expen enditu iture 93.9
73.7
Spending 20.3 Nett tt (7.9) SULAW AWESI ESI Reven enue 19.7
16.6
0.6
2.5 Expen enditu iture 104.5
73.3
31.2 Nett tt (84.8) PAPUA A & MALUKU Reven enue 18.4
10.7
1.7
6.0 Expen enditu iture 89.6
71.7
17.9 Nett tt (71.3) Notes es: 1. Average data 2014 - 2016 2. Revenue amount collected from certain region for central government budget 3. Expenditure amount spent for certain region from central government budget 4. Figure in IDR trillion Source: Ministry of Finance
42
Continue nue the efficien iency cy
ional expense nse and incr crease ease the priori rity expend ndit itur ures es
Minist sterial erial Spendin ing
↑ IDR 35.0 T from 2017 Budget Oper eratio tional al Expense nse Efficien iency
↓ 16.0 T
Addit ditiona ional Priority iority Spend nding ing
↑ 48.2 T
UN Mission to Center Africa Preparation for Regional Election and 2019 General Election Land Certification Asian Games 2018 Development program
agriculture and horticulture
Non Minist sterial rial Spendin ing
↑ IDR 17.4 from 2017 Budget
Inter eres est Payment nt
↓ Rp2,0 T from 2017 Budget Energy Subsid idy
↑ Rp12,5 T from 2017 Budget Non Energy gy Subsid idy
↓ Rp3.7 T from 2017 Budget
43
2016 Budget et Real aliza izati tion Did Not Impede pede Pri riori rity ty Projects cts
Althoug ugh deficit cit was capped at manag ageable able level, l, infras astruc ructur ture develo lopment nt continue inued to accele lerate
Infrastru tructu cture Realiz lizatio tion1 Infrastru tructu cture Deve velopme lopment nt Achie chieveme ment nt in 2016 Food Secu curity ity Realiz izatio tion
100 200 300 400 Budget Realization Budget Realization Ministerial Spending Non Ministerial Spending Regional Transfer Financing
290.3 256.2 317.2 267.0
2015: 88. 88.2% % of budget 2016: 84. 84.9% % of budget
IDR tn 50 100 150 200 Budget Realization Budget Realization Ministerial Spending Non Ministerial Spending Regional Transfer Financing
2015: 87. 87.5% % of budget 2016: 84. 84.3% % of budget
IDR tn
125.9 110.3 117.9 99.3
Roa
elopm pmen ent t (km) Target: 3,149.6 Realization: 2,528.7 Airpo rport Target: 15 (up to 2019) Realization: 3 Brid idge ge (km) Target: 12.9 Realization: 10.6 Railw ilway2 (km) Target: 114.9 Achievement: 114.9 Dam Target: 37 Achievement: 37 Irr rriga igatio ion (km) Target: 4,889 Achievement: 1,025
Source: Ministry of Finance 1. Not including LRT South Sumatra and Jabodetabek 2. Land issues are in progress
44
Educatio tion an and Heal alth th Spend nding ing Well ll Delive livered ed in 2016
Invest stment nt to improve ve social al welfar are in the longer term
Educ ucatio tion n Expe xpend nditur iture Healt lth Expend nditur ure
Immunizat izatio ion for infan ants between 0 0 – 11 months Realizat ization: 4 million infants Target 4 million infants Unive versit ity y scholar arship ips for underprivil ileged students (Bid idik ikmis isi) Realizat ization: 324 thousand college students Target: : 332 thousand college students Health Insur uran ance Subsid idy (PBI) Realizat ization: 91.1 million people Target 92.4 million people School Operat ational Assis istan ance (BOS OS) Realizat ization: 8.0 million students Target: 8.2 million students Vaccin ine avail ilabil ilit ity in Commun unit ity Health Centre (Puskesmas as) Realizat ization: 81.5% Target 80.0% School Rehabil ilit itatio ion Realiza ization: n: 28,400 rooms Target: 30,300 rooms Malar aria a Erad adicat ation Realizat ization: 247 cities Target 245 cities Indonesia ia Smar art Card (KIP) Realizat ization: 20.7 million students Target: 19.5 million students Accredited Regional al Hospit ital al Realizat ization: 201 hospit ital als Target 190 hospitals
100 200 300 400 500 600 Budget Realization Budget Realization Ministerial Spending Non Ministerial Spending Regional Transfer Financing 20 40 60 80 100 120 Budget Realization Budget Realization Ministerial Spending Non Ministerial Spending Regional Transfer Financing
2016: 88.9% % of budget 408.5 390.2 416.6 370.5 2015: 88.1% % of budget 2016: 88.6% of budget
IDR tn
74.8 67.0 104.1 92.3 2015 15: 95.5% 5% of budg dget
IDR tn
Source: Ministry of Finance
45
Better tter Tar argeting eting
Subsid bsidy Policy cy in 2017
...more budget alloca cated to non energy subsid idy and priori rity program ams to improve ve basic ic service ices
Bidik ikmi misi si Scholarship ship
50 100 150 200 250 300 350 400 450 2009 2010 2011 2012 2013 2014 2015 2016 2017 Budget
IDR IDR tn
416.1
2,7 2,8 3,0 2,7 2,8 3,3 3,8 5,0 5,0 0,0 1,0 2,0 3,0 4,0 5,0 6,0 50 100 150 200 2009 2010 2011 2012 2013 2014 2015 2016 2017 Budget Budget % of R-Budget IDR tn % Basic & complete immunization for 92% of 0-11 months old infants Immu mmunizatio ion 94.4 million people Health th Insurance Subsidy (PBI) Stunting prevention to 29.6% of children below 2 years old Stuntin ing Prevent entio ion 700 regencies Commu mmunity Health th Centre e (Puskesma esmas) 6.7 million people Fami mily Plan Program m (KB)
Budg udget t for Educ ucatio tion n Program Budg udget t for Healt lth Program
360.5 thousands college students 19.5 million students Indones esia ia Sma mart Card (KIP) 101,100 teachers 10,200 lecturers Certific tificatio tion School Rehabil bilita itatio tion 41,128 rooms 8.5 million students School Operatio tional Assista tance e (BOS OS) 107 Colleges/Universities Oper eratio tional Assista tance for College eges
46
Impr proved ved Budg dget Allo loca cation tion Between tween Central al & & Local al Governm rnment ent
…promoting better alloca cation
budget spending ing to local al governm rnment nt
65.85% .85% 22.67% .67% 0.98% 98% 2.65% 65% 7.85% 85%
Gradually increasing Villag age Fun und allocation Average allocation of IDR800.5 million per village Villag age Fun und (IDR60.0 tn tn) Improving efficiency and effectiveness of Special ial Autonomy & DIY Fund. Special ial Autonomy y & D.I Yogyak akar arta - DIY (IDR20.2 tn tn) Incentive ive Fund (IDR7.5 tn tn) Minimum of 25% (IDR125.9 tn) earmarked for public service facility development acceleration. It provides revenue sharing fund to promote equal opportunity for natural resource producers & high tax earners General al Tran ansfer Fund (IDR494.0 tn tn) Special ial Tran ansfer Fund allocation is based on each regions’ proposal and national priorities Special ial Trans ansfer Fund nd (IDR184.6 tn tn) Incentive ive Fund allocation has been increased (317 regions were awarded an incentive ranging between IDR 7.5bn and IDR 65. 3bn)
policy to allo locate spendin ing to regio ions ns
nimum um 25%
general al transfe fer fund has to be used for public service infrastructure 2017 Transfe fer r to Regions
lage Funds ds (R-Budg Budget) Trans nsfer er to Regio ions/Villa Village ge Funds & Minis nister erial ial Spending ing
IDRtn 2013 Audit ited 2014 14 Audit ited 2015 15 Audit ited 2016 16 Audit ited 2017 Budget 2017 R-Bud udget Transfer to Region 513.3 573.7 602.4 663.6 704.9 697.7 Village Fund
46.7 60.0 58,2 Total al Intergove vernmental al Tran ansfer 513.3 573.7 623.2 710.3 764.9 755.9 Minis isterial al Spending 582.9 577.2 732.1 677 677.6 763.6 769.2 Source: Ministry of Finance
47
Policy cy
Infras astr tructur ucture Spe pending ding an and Tran ansfer fer to Re Regio ions ns
…developing the nation throug ugh targeted spending ng
In 2017, min inimum um 25% of general al tran ansfer fund has to be used for public service infrastructure
Kalima limanta ntan
2016 : 2,889.9 2017 : 3,641.6 2016 : 597.9 2017 : 634.5 2016 : 2,694.4 2017 : 4,117.1 2016 : 606.2 2017 : 1,042.6 2016 : 3,749.1 2017 : 3.686.3 2016 : 1,680.2 2017 : 1,941.7
Suma mate tera
2016 : 3,895.4 2017 : 3,545.7 2016 : 1,044.8 2017 : 1,320.4 2016 : 3,229.4 2017 : 3,257.8 2016 : 461,1 2017 : 1,147.5 2016 : 661.3 2017 : 1,207.3 2016 : 101.1 2017 : 308.2
Ja Java
76 86 114.2 145.5 168,5 154,1 256,1 317,1 387,3 8,1 8,3 8,8 9,8 10,2 8,7 14,2 15,2 18,6 5 10 15 20 100 200 300 400 500 2009 2010 2011 2012 2013 2014 2015 2016 2017 % IDR tn Anggaran Infrastruktur % thd Belanja Negara (RHS)
Infrastructure budget % of total state expenditure (RHS) Maluk uku u & Papua ua Sulaw lawesi Bali li & Nusa Teng nggara Infrastru tructu cture Budget Alloc locatio tion
2017 2017 Infrastr tructu ture e Budget get Allocatio tion (IDR R billio ion) and 2016 realiz izatio tion
2017 Constr truc uctio tion n Target Roa
elopm pmen ent Target: 815 km Airpo rport Target: 13 Brid idge ge Target: 9,399 m Railw ilways Target: 550 km Seapor port Target: 55 locations Bus statio tion Target: 3 locations
Source: Ministry of Finance
48
Finan ancing cing Policy cy 201 017: : Gener neral al Objective jective & P Policy cy
To conduct active debt portfolio To manage debt-to- GDP ratio To optimize the use of external and domestic loans To
currency mix of issuance
General al Policy cy
To support market development To enhance public accountability as part
transparent Government debt management To meet financing needs at
cost and tolerable risk
Source: Ministry of Finance
49
Budget et Finan ancing cing Breakdo akdown wn in 201 2017
Debt (Gross) IDR735.6tn tn (eq. USD 55.2bn) bn) Redemptio tion IDR350.9tn tn (eq. USD 26.3bn) bn) Budget et Financ ncing ng IDR330.2tn tn (eq. USD 24.8bn) bn) Non-De Debt bt Financ ncing ng IDR54.5tn tn (eq. USD 4.1bn) bn)
USD/IDR: 13,323 as of 31 May 2017 Note: Subject to change in market conditions and other factors
Breakdo akdown wn
budget et financ ncin ing IDR tn tn USD bn bn Governm ernmen ent debt bt (net) 384.7 28.9 Governm ernmen ent securi rities ies (net) 400.0 30.0 Domestic tic loans ns (net) 1.5 0.1 Foreig eign loans ns (net)
Source: Ministry of Finance
50
Gover ernment ment Securit urities: ies: Indica cati tive ve Finan ancing cing Plan an for 2017
…prudent and sustainab inable le fiscal al manag agement nt
Gov
ernmen ent t Issuance e Targ rgets ets Intern ernati tional l Bonds ds
international bonds as a complement to avoid crowding
the domestic market;
USD, YEN
EURO global bonds;
can be maximized up to 25% from gross target, depends on financing need
Domestic tic Bonds
Weekl kly Auctio ction: n: Conve ventio ntiona nal l secu curitie ities 24 x Islam lamic ic secu curitie ities 24 x Non-Auc uctio tion: n: Retai tail l bond nds Priva vate te Place ceme ment nt Based on request Fro ront Loa
ding g Issuance e For r Budge dget t Financin ing
gross issuance target
42.7% from gross issuancce target
Debt Securities 71%
Sukuk 29% Average Tenor Maturity (ATM) for Government Securities: 6-8 years
Comp mpositio tion Dome mestic ic 79% 79% Auction 93% Non-Auction 7% Internatio tional Bond 21% 21%
Source: Ministry of Finance
Instrumen ments ts Budget et Indic icativ tive Target et (IDR R trn) Indic icativ tive Target et (USD bn bn)* Governmen ment t Securiti ities es (Net) et) 399.99 30.03 Governmen ment t Securiti ities es (Gross) s) 684.83 51.42
* USD/IDR: 13,323 as of 31 May 2017
51
Sound Governm rnment ent Deb ebt Port rtfolio lio Man anag agem ement ent
Portfolio io managemen ment charact acteriz rized by stable le debt/G /GDP DP ratio and well-div iversi rsified fied debt
Stable ble Debt bt to GDP Ratio Ove ver the Years Weig ighte ted Ave verage Debt bt Matur urity ity of ~8.9 Years** (As As of June ne 2017)
US US$ bn
Rema marka kable ble Debt bt Reduc uctio tion n Initia itiative tive Ove ver the Past t 10 Years
Chang nge in Debt bt to GDP P Ratio io (200 007 – 201 017) ) (%) Source: IMF World Economic Outlook Database, April 2017
Well ll Dive versif ifie ied Across Different nt Currenc ncie ies
% of Yearly y Issuance ce Gover ernment Debt bt / GDP P (%) Source: Ministry of Finance Source: Ministry of Finance Source: Ministry of Finance *Based on 2016 realization, ** Using GDP assumption in 2016 R-Budget, ***SDR, AUD, and other 140,76 136,27 155,24 174,7 206,95 220,98 63,76 56,61 54,47 54,74 54,37 54,65 23 24,9 24,7 27,4 28,3 28,1 5 10 15 20 25 30 50 100 150 200 250 300 2012 2013 2014 2015 2016* May 2017 Securities (LHS) Loans (LHS) Gross Debt/GDP (%) (RHS) 9,7 9,6 9,7 9,4 9,0 8,9 8,0 8,3 8,5 8,8 9,0 9,3 9,5 9,8 10,0 2012 2013 2014 2015 2016 Jun-17 Years 56% 53% 57% 56% 58% 59% 24% 29% 29% 31% 30% 29% 14% 12% 9% 8% 7% 7% 3% 3% 3% 3% 4% 4% 3% 3% 2% 2% 1% 1% 2012 2013 2014 2015 2016 Jun-17 IDR USD JPY EUR Others***
113,56 93,46 55,08 52,33 40,31 27,32 16,18
10,00 60,00 110,00 Russia South Africa Vietnam Mexico Malaysia Brazil Thailand Argentina India Indonesia Turkey Philippines
52
Well ll Bal alan anced ced Maturi rity ty Profile le With th Strong ng Resilie silience nce Again ainst st Exter ernal al Shocks cks
Declin clinin ing Inte terest t Rate te Risks ks Debt bt Matur urity ity Profile ile Declin clinin ing Exch change Rate te Risks ks Upco comi ming ng Matur uritie ities (Ne Next 5 Years)
IDR tn tn
1 Variable Rate Ratio is defined as ratio between debt instruments with variable rate divided by total debt instruments (variable + fixed rates) 2 Refixing Rate ratio is defined as ratio between debt instruments with variable rate + debt instruments with fixed rate maturing in 1 year divided by total debt instruments (variable + fixed rates)*Preliminary Figures **Using GDP assumption in 2017 Budget.
Source: Ministry of Finance
16,2 16,0 14,8 13,7 12,3 11,2 22,5 23,2 21,0 20,7 17,8 19,3 5 10 15 20 25 2012 2013 2014 2015 2016* Jun-17 Variable Rate Ratio¹ Refixing Rate²
%
10,2 11,7 10,7 12,2 11,7 11,0 44,4 46,7 43,4 44,5 41,8 40,8 10 20 30 40 50 2012 2013 2014 2015 2016* Jun-17 FX Debt to GDP Ratio** FX Debt to Total Debt Ratio
%
101 101 201 201 189 189 116 116 140 140 107 107 98 98 168 168 45 45 126 126 100 100 53 53 100 100 29 29 124 124 66 66 52 52 97 97 5 90 90 22 22 22 22 7 15 15 26 26 23 23 20 20 28 28 44 44 110 110 135 135 112 112 123 123 128 128 103 103 88 88 116 116 88 88 71 71 46 46 21 21 20 20 18 18 17 17 16 16 12 12 29 29 5 23 23 28 28 2 1 1 31 31 21 21 28 28 27 27 39 39
50 100 150 200 250 300 2017 2019 2021 2023 2025 2027 2029 2031 2033 2035 2037 2039 2041 2043 2045 IDR-Denominated Other Currencies 2046- 2055 7,2 8,6 7,7 8,4 6,6 9,1 21,5 21,8 20,1 21,4 23,0 23,5 32,4 33,4 33,9 34,7 36,5 39,1 0,0 10,0 20,0 30,0 40,0 50,0 2012 2013 2014 2015 2016* Jun-17 In < 1 year In < 3 year In < 5 year
%
53
Profile le
Total al Centr ntral al Gover ernment ment Deb ebt
Foreig eign Own wnership p of Govern ernment Secu ecuritie ities at Longer Tenors Hold lders of Governm nment nt IDR Bond nds – Compositio tion n June ne 2017 2017 Governm nment nt Debt bt Outs tstan tandin ing
(%) (%)
Source: Ministry of Finance
34,34 31,18 29,96 25,87 24,19 23,84 22,01 21,14 20,67 19,62 65,66 68,82 70,04 74,13 75,81 76,16 77,99 78,86 79,33 80,38 199,48 204,51 194,55 209,41 214,88 229,40 255,14 258,03 265,98 278,29 50 100 150 200 250 300 10 20 30 40 50 60 70 80 90 100 2011 2012 2013 2014 2014 2015 Jun-16 Des-16 Jan-17 Jun-17 Loan (LHS) Government Securities (LHS) Total (RHS)
(%) USD bn 11,9 7,8 5,2 4,6 3,2 2,7 3,5 3,4 5,2 5,4 25,0 19,3 18,3 18,9 13,1 13,7 23,1 19,8 18,6 22,5 63,2 72,8 76,5 76,4 83,7 83,6 73,4 76,8 76,1 72,1 30,8 33,0 32,5 38,1 38,2 39,1 37,5 37,8 38,2 39,5 20 40 60 80 100 2011 2012 2013 2014 2015 Jun-16 Des-16 Jan-17 Mar-17 Jun-17 0-1 1-5 >5 Foreign Ownership to Total
30,8 33,0 32,5 38,1 38,2 38,9 39,1 37,5 37,8 37,5 38,2 39,0 39,1 39,5 32,6 30,5 33,8 30,8 37,9 31,3 38,9 39,9 34,9 34,5 35,5 35,0 34,6 40,1 36,63 36,53 33,70 31,04 23,95 29,81 21,95 22,5 27,27 28,03 26,22 26 26 20,4
20 40 60 80 100 2011 2012 2013 2014 2015 Jan-16 Jun-16 Dec-16 Jan-17 Feb-17 Mar-17 Apr-17 May-17 Jun-17 Foreign Holder Domestic Non Banks Domestic Banks
54
Owner ersh ship ip of IDR Tra radab able le Cen entr tral al Governm rnment ent Securit urities ies
1) Non Resident consists of Private Bank, Fund/Asset Manager, Securities Company, Insurance Company and Pension Fund. 2) Others such as Securities Company, Corporation, and Foundation. *) Including the Government Securities used in monetary operation with Bank Indonesia. **) net, excluding Government Securities used in monetary operation with Banks.
(IDR DR tn)
Source: Ministry of Finance
Descriptio iption Dec-14 14 Dec-15 15 Jun-16 16 Dec-16 16 Jun-17 17 Banks* 375.55 31.04% 350.07 23.95% 361.54 21.95% 399.46 22.53% 399.19 20.45% Govt Institu itutio tions s (Bank Indones esia ia** **) 41.63 3.44% 148.91 10.19% 150.13 9.12% 134.25 7.57% 175.89 9.01% Bank Indonesia (gross) 149.07 9.05% 157.88 8.90% 180.28 9.23% GS used for Monetary Operation
23.63 1.33% 4.39 0.22% Non-Banks 792.78 65.52% 962.86 65.87% 1135.18 68.93% 1239.57 69.90% 1377.15 70.54% Mutual Funds 45.79 3.78% 61.60 4.21% 76.44 4.64% 85.66 4.83% 91.56 4.69% Insurance Company 150.60 12.45% 171.62 11.74% 214.47 13.02% 238.24 13.43% 254.21 13.02% Foreig ign Holder ers 461.35 38.13% 558.52 38.21% 643.99 39.10% 665.81 37.55% 770.55 39.47% Foreign Govt's&Central Banks 103.42 8.55% 110.32 7.55% 118.53 7.20% 120.84 6.81% 131.94 6.76% Pension Fund 43.30 3.58% 49.83 3.41% 64.67 3.93% 87.28 4.92% 89.11 4.56% Individual 30.41 2.51% 42.53 2.91% 48.90 2.97% 57.75 3.26% 60.49 3.10% Others 60.51 5.00% 78.50 5.37% 86.72 5.27% 104.84 5.91% 111.23 5.70% Total 1,209.96 100% 100% 1,461.85 100% 100% 1,646.85 100% 100% 1,773.28 100% 100% 1,952.23 100.00%
55
Gover ernment ment Securit urities ies Real aliza izatio tion
(IDR mn mn)
Source: Ministry of Finance
Budget get 2017 Budget get Realiza lizatio tion (a.o .o. Jun. . 22, , 2017) % Realiza lizatio tion to Budget get 2017 Gov
ernmen ent t Securi rities ies Net 399,992,586 586 253,339,039 63.3 .34% Gov
ernmen ent t Securi rities ies Matu turin ing g in 2017 and d Buyback 284,842,264 264 141,754,317 49.7 .77% Issuance e Need d for
684,834,850 850 395,093,356 57.6 .69% Gov
ernmen ent t Debt t Securiti ities es (GDS) DS) 273,214,088 IDR Denom
inated ted GDS DS 213,173,000
107,130,000
105,650,000
393,000
ernatio tional l Bonds ds 60,041,088
47,197,500
12,117,580
726,008 Gov
ernmen ent t Isla lamic ic Debt t Securi rities ies 121,879,267 Dom
estic tic Gov
ernmen ent Isla lamic ic Debt Securiti ities es 81,910,267
65,872,957
14,037,310
2,000,000 Glo lobal l Suku kuk 39,969,000
*Adjusted with issuance related to cash management realization
56
Positi tive ve Response nse
Gover ernme nment nt Secu curi riti ties es Issu suan ance ce in 2016
Globa lobal l Conven venti tional l Bond Globa lobal l Sukuk kuk Euro ro-Den enom
inated ted Bonds ds Sam amura rai Bon
ds Tenure re 10 yr 30 yr 5 yr 10yr 7 yr 12 yr 3 yr 5 yr Pric icin ing g Date te December 8th, 2015 March 29th, 2016 June 14th, 2016 June 21st , 2016 Nom
inal US$ 2.25 bn US$ 1.25 bn US$0.75 bn US$1.75 bn EUR 1.5 bn EUR 1.5 bn JPY62 bn JPY38 bn Cou
pon Rate te 4.75% 5.95% 3.40% 4.55% 2.625% 3.750% 0.83% 1.16% Yiel eld 4.80% 6.00% 3.40% 4.55% 2.772% 3.906% 0.83% 1.16% Incom
ing Bid Bid US$8.1 .1 bn bn US$8.6 .6 bn bn EUR 8.4 .4 bn bn JPY100 bn bn
average incoming bids in 2016 was IDR18.81tn/auction, higher than 2015 (IDR14.05tn/auction);
average awarded bids in 2016 was IDR9.44tn/auction, higher than 2015 (IDR6.75tn/auction);
to cover ratio
government securities issuance in 2016 was 1.99 times (2015 was 2.08 times).
IDR bn bn Increasing Incoming Bids in 2016’s Government Securities Issuance
Incoming Bid 2016 Bid to Cover Ratio 2016 (RHS) Awarded Bid 2016
Source: Ministry of Finance
58
Ban ank Indones esia ia Policy cy Mix: Ju July ly 201 017
Holds the BI 7-day Repo Rate at 4.75% Deposit and credit growth are expected to increase, to reach the range of 9-11% and 10- 12%. The potential growth, however, are still shadowed by a number
domestic demand recovery prospects and developments in the banking consolidation. Continues to strenghten coordination with the central government and regional administrations, to keep inflation within it’s target corridor Continues to stabilise Rupiah exchange rates in line with the currency’s fundamental value, while maintaining market mechanisms Predicts 2017 domestic economic growth in the 5.0-5.4% range, supported by stronger export performance and investment
The e BI Board ard of Gov
ernors
gree eed on 19 19th
th and
d 20th
th July
ly 201 2017 to hold ld the e BI 7-days days Repo
te at at 4.75 75%, as well l as the e Depos posit it Facility lity at 4.00 00% % and d Lendin ding Facility ility at 5.50 50%
Monitors closely various global risks, especially coming from the US, including the planned FFR hike, the Fed’s plan to unwind its large balance sheet, and uncertainties in the fiscal policy.
59
Ban ank Indones esia ia Policy cy Mix Mix: : 2015-20 2017
14 14 Jan 2016
bps to 7.25%, DF & LF Rate at 5.25% & 7.75%
monetary
even further, ranging from 25bps to 45bps (O/N to 1Y) 19 Jan – 20 20 July 20 2017 Held BI 7-day RR Rate at 4.75%, DF Rate at 4.00% and LF Rate at 5.5 % 20 Oct 2016 Cut BI 7-day RR Rate to 4.75%, DF and LF Rate to 4.00% and 5.50% 19 19 Aug Aug 2016
day RR Rate and DF Rate at 5.25% and 4.5%
to 6.00%. 16 Jun 20 2016 16
& LF Rate at 4.5% & 7.0% respectively
(LTV) and financing-to-value ratio (FTV) on housing loans/financing
loans/financing
Requirement - Loan to Funding Ratio (RR-LFR) from 78% to 80%, with the ceiling maintained at 92%. The change was effective on Aug. 2016 18 18 Mar 2016 Cut BI Rate 25 bps to 6.75%, DF & LF Rate at 4.75% & 7.25% 17 Nov – 15 Dec 2016 Held BI 7-day RR Rate at 4.75%, DF Rate at 4.00% and LF Rate at 5.5 % 22 Sep 2016 Cut BI 7-day RR Rate to 5.0%, DF and LF Rate to 4.25% and 5.75%. 21 21 Jul 2016
maintained BI 7-day RR Rate, DF & LF Rate at 5.25%, 4.5% & 7.00% respectively.
financial market deepening by introducing new investment & hedging products in the financial market, strengthened monetary management strategies, & encouraged the real sector to make optimal use of repatriation funds to support the implementation of the 2016 Tax Amnesty Law 21 April 2016 16
6.75%, and maintained DF & LF Rate at 4.75% & 7.25% respectively.
rate from BI Rate into the 7 day (Reverse) Repo Rate to improve the effectiveness of monetary policy
change was effective
18 18 Feb 2016
bps to 7%, DF & LF Rate at 5% & 7.5%
rupiah denominated primary reserve requirement by 1%, from 7.5% to 6.5%, effective from
17 17 Nov 2015 Lowering IDR Primary RR by 50bps from 8.0% to 7.5%. Effective since 1 Dec 2015 26 26 Jun 2015
RR-LFR
banks SMEs loan in RR calculation 18 18 Jun 2015
Loan-to-Value (LTV) ratio
payments for automotive loans
60
3,0 3,5 4,0 4,5 5,0 5,5 6,0 6,5 7,0 7,5 8,0 Jan-16 Mar-16 May-16 Jul-16 Sep-16 Nov-16 Jan-17 Mar-17 Mei-17 Jul-17 LF Rate BI Rate BI-7Day RR Rate DF Rate
11,17 9,60 2,14 1,62 1,60
5,09
5,18 5,61 5,39 1,08 7,96
4,51 0,08
0,0 5,0 10,0 15,0 ZAR BRL INR THB KRW IDR EUR PHP MYR TRY Point to Point Average
Stab able le Monetary tary Environment ment Despite spite Chal alleng lenges es
Rupia iah Exc xchang nge Rate Rema main ins Compar parable ble to Peers
YTD 2017 17* vs. 2016 16
Inflatio lation n Continu tinues Und nder Controll lled Streng ngth thene ned Monet netary Polic icy Frame mewo work
Source: Bank Indonesia
Credit Growth th Suppo pporte ted by Macropr prud udentia ntial Polic icy
(%)
LF Rate: 7.00 LF Rate: 5.50 BI Rate: 6.50 BI 7Day RR Rate: 4.75 DF Rate: 4.50 DF Rate: 4.00
19 August ust 2016
The New Monetary Operation ion Framewo work (YoY) 4,37 3,13 2,17 10,64
4 9 14 19 1 3 5 7 9 11 1 3 5 7 9 11 1 3 5 7 9 11 1 3 5 7 9 11 1 3 5 7 9 11 1 3 5 7 9 11 1 3 5 2011 2012 2013 2014 2015 2016 2017 (%) CPI (%, yoy) Core (%, yoy) Volatile Food (%, yoy) Administered (%, yoy) *data as of June 30th, 2017
%
8,7% 8,5% 9,4% 8,3%
0% 5% 10% 15% 20% 25% 30% 35% 40%
1 3 5 7 9 11 1 3 5 7 9 11 1 3 5 7 9 11 1 3 5 7 9 11 1 3 5 2013 2014 2015 2016 2017
Total Growth Working Capital loans Consumption Loans Investment Loans
61
6 Meas asur ures es to Control
Inflatio tion in 2017
On On Janu January ary 25 25th
th, 2017, the Gov
Governm ernment nt and nd Bank ank Ind Indones nesia ag agree eed on
ix str trate tegic gic mea easur ures to to contr ntrol infla inflatio tion in in 2017 with within th the tar target et corri ridor of
well ll as as in in 2018 at at 3.5±1%), wh while ile al also settin tting the infla nflatio tion tar target ets for 2019-2021 at at 3.5±1%, 3±1% and and 3±1% respec ectiv tively ly. Those mea easur ures ar are nee needed ed to to add addres ess sever everal al oner nerous us domesti tic and and ex external ternal chall alleng enges th that dem emand and vigi igila lanc nce and and ea earl rly mitiga mitigatio tions. The external challenges mainly stem from rising international commodity prices, while the domestic challenges stem from ongoing energy reform through adjustments of electricity tariffs for 900VA subscribers as well as fuel prices as the global oil prices continues to
Maint intainin ining vola latile le food (VF) F) infla latio tion at 4-5% 5% by:
Strengthening infrastructure for food logistics in local areas, particularly warehousing for storage Developing a commodity flow data system, specifically for food commodity Utilising fiscal instruments and incentives to extend the local government’s role in price stability
Dampen enin ing the second-round effect ct
Administe istered ed Price adjust stmen ents Introduci cing Administe istered ed Price Sequen enci cing Estab ablishin lishing the Natio ional Infla latio ion Control Team Stren engt gthe henin ing central al and local governmen ment coordin inatio ion
Through Eighth National TPID Coordination Meeting in July 2017
Stren engt gthe henin ing the Bank Indonesia esia policy cy mix to maintain in macroecono conomic mic stability lity
Through Presidential Decree to strengthen the National Inflation Task Force (TPI) and Regional Inflation Task Forces (TPID)
Strengthening interregional cooperation Encouraging diverse food consumption in the community, especially of fresh chillies and alliums, by fostering product innovation in the processed foods industry Accelerating connectivity infrastructure development Improving planting patterns
Example: Controlling transportation fares Including the planned conversion of several direct subsidies to cash transfers (fertilizer, rice for the poor and 3kg LPG) 3kg
Source: Bank Indonesia
62
Improving ving the Effect ectivene iveness ss
Moneta tary ry Polic icy Tran ansm smissio ission
Bank Indones esia ia has institu tuted ted a Reformula ulatio tion
Monet netar ary Polic licy Operatio tions Framew ework rk which consis ists ts
3 pillar lars; (1) implementa ntatio ion
BI 7day Revers rse Repo Rate; (2) implement lementatio tion
reserv rve requir uirement nt averaging ing; and (3) contin tinue ue to implem lement ent money ey marke ket deepenin ening progr gram. Enhancement
monetary policy signal Enhancement
banking liquidity management Implem emen enta tatio tion
BI 7 Day Revers erse Repo Rate Implem emen enta tatio tion
Reserv rve Requir iremen ent (RR) Averag aging ing Reformula rmulatio ion
Moneta etary ry Polic licy Operatio iona nal Framew ework rk
Source: Bank Indonesia
Enhancement
instruments and transactions Implem emen enta tatio tion
Money ey Mark rket et Deepening ning Progr gram am
63
Enhan anceme cement nt
Monetary tary Oper eratio tions ns Fram amew ework
...posit sitive ve resul ults ts thus far
minutes.
minutes.
CURR RREN ENT JIBOR BOR (as per June 1st, 2016) PREVIOUS IOUS JIBOR BOR
O/N 1W 1W 2W 2W 3W 3W 1M 1M 3M 3M 6M 6M 12M 12M JIBO BOR IBMM Repo po FX Swap MO MO IBMM: Interbank Money Market MO: Monetary Operation
Domes mestic tic Mone ney Marke ket t Yiel ield Curve ve (2nd
nd week
k of July 2017)
Source: Bank Indonesia
Domestic ic mone ney mark rket yield ld curv rve tend nd to conv nver erge Mone netary ary
ion term rm stru ructu ture is being ing refer erred ed by mone ney mark rket rate tes
64
Introducing ucing Reser erve ve Requ quir irem ement ent (RR) Averaging aging
The Purpo rpose se
RR Averaging
Previo evious usly ly, RR ratio io is set at 6.5% (fixed) ed)
the TPF (Thir ird Part rty Fund) and to be maintain tain
daily ly basis. From 1 July 2017, the fulfilme ilment nt method
RR has been adjus usted ed to daily ily RR
5%
TPF and averag age RR
1.5%
TPF within in a fixed ed perio iod
1 2 3
To provid ide flexibilit ibility in liquid uidit ity management ent in
er to increa ease bank efficiency iency To functio tion as an inter eres est rate buffer er in
er to reduc uce inter eres est rate vola latilit tility in the money ey marke ket
$
To provid ide space for liquid idit ity placem ement nt in
er to boost financ ncial ial marke ket deepenin ening
Source: Bank Indonesia
65
Finan ancial cial Inter ermedia mediatio tion Improves ves in Ear arly 2017
The growth of banking loans has improved from the previous year and is expected to further expand by 9-12% this year. In the domestic capital markets, capital raising by corporations (particularly right issues and corporate bond issuance) remained strong.
Source: Financial Service Authority (OJK)
The growth th of financ ncin ing dis istrib tributed uted by multif tifin inanc nce compan panie ies in in May 2017 was still ill in an increasin ing trend nd Gross premi mium um reve venu nue in the domes mestic tic insur uranc nce indust ustry is also countin ntinuo uousl usly growing… Capita ital l raisin ing throug ugh rights ts issue ues & & corpo porate te bond nd issua uanc nce in H1
me perio iod last t year The growth th of bankin king loans ns was 8.71% % (yoy) in May 2017
IDR tn IDR tn IDR mn IDR tn 8.71% 0% 5% 10% 15% 20% 25% 1000 2000 3000 4000 5000 2012 2013 2014 2015 2016 Jan-17 Feb-17 Mar-17 Apr-17 May-17 Bank Loans YoY Growth (rhs) 9.24%
5% 15% 25% 35%
50 150 250 350 450 2012 2013 2014 2015 2016 Jan-17 Feb-17 Mar-17 Apr-17 May-17 Financing YoY Growth (rhs) 12.1 4.1 67.1 53.8 116.2 84.7 20 40 60 80 100 120 140 2012 2013 2014 2015 2016 Jan-Jun 2017 IPO Equity Rights Issue Corporate Bonds & Sukuk 147 50 100 150 200 250 300 350 400 2012 2013 2014 2015 2016 Jan-May17
66
Finan ancial cial Institutio titutions ns Remain ain Robust st an and Le Less ss Vulner erable able
Banking sector’s capital adequacy ratio (CAR) was maintained at a high level. As of May 2017 2017, CAR & Tier 1 Capita tal was 22. 22.86 86% % & & 20.08% % respec pectiv tively Risk-based ed capita tal (RBC) C) of the insurance e industr try also rema mains high gh, well above the mi minimu mum m thres esho hold (120%) Gearin ing g ratio of mu multifin inance comp mpanies es was 3.03 time mes (well below the ma maximu mum m requir ireme ement t of 10 time mes), ), provid idin ing g amp mple room m for future e growth th Profita itabil ility ty of the e banking g secto tor is relativ tivel ely stable
Domestic financial institutions exhibit generally robust condition. Capital adequacy is maintained well above the minimum requirements. Profitability and leverage are maintained at a sufficient level. Further, gearing (debt-to-equity) ratio of multifinance companies provides ample room for future growth.
Source: Financial Service Authority (OJK) 22.86 20.08 0,0 5,0 10,0 15,0 20,0 25,0 2012 2013 2014 2015 2016 Jan-17 Feb-17 Mar-17 Apr-17 May-17 % CAR Tier-1 Capital 503% 281% 150% 180% 210% 240% 270% 300% 400% 450% 500% 550% 600% 650% 700% May-16 Jun-16 Jul-16 Aug-16 Sep-16 Oct-16 Nov-16 Dec-16 Jan-17 Feb-17 Mar-17 Apr-17 May-17 RBC - Life Insurance RBC - General Insurance (rhs) 5.36 2.46 1 2 3 4 5 6 2012 2013 2014 2015 2016 Jan-17 Feb-17 Mar-17 Apr-17 May-17 % Net Interest Margin Return on Assets 3.03 1 2 3 4 2012 2013 2014 2015 2016 Jan-17 Feb-17 Mar-17 Apr-17 May-17
67
Adequa quate te Li Liquidit uidity, y, Man anag ageable eable Cred edit it Risks ks
Banks are equipped with adequate liquid assets to anticipate depositors’ withdrawal. Insurance industry also demonstrates an enhanced level of investment adequacy ratio. The non-performing loan/financing (NPL/NPF) ratio is also maintained below the threshold.
The ratio of liquid id assets s to deposits sits in the banking g secto tor was well ma maintained ed at a h high gh level vel. As of May 2017 2017, the gross & net NPL PL ratios of the banking g sector were e 3.07% & & 1.33% % respec pectiv tivel ely, ma maintained ed below the thresho eshold NPF ratio in the e mu multifi finance industr try was 3. 3.45 45% % as of May 2017 2017, , ma maintained ed well below the 5% thresho eshold Inves estmen tment t adequacy ratio in the insurance e industr try y is ma maintained ed above 100%
Source: Financial Service Authority (OJK) 88.85 18.58 6 10 14 18 22 26 60 70 80 90 100 110 Dec-16 Jan-17 Feb-17 Mar-17 Apr-17 May-17 Jun-17 % % Liquid Assets to Non-Core Deposits (lhs) Liquid Assets to Deposit (rhs) 116.80 125.10 90 100 110 120 130 140 May-16 Jun-16 Jul-16 Aug-16 Sep-16 Oct-16 Nov-16 Dec-16 Jan-17 Feb-17 Mar-17 Apr-17 May-17 % Life Insurance General Insurance 1.33 3.07 1 2 3 4 2012 2013 2014 2015 2016 Jan-17 Feb-17 Mar-17 Apr-17 May-17 % NPL Net NPL Gross 3.45% 0% 1% 2% 3% 4% 2013 2014 2015 2016 Jan-17 Feb-17 Mar-17 Apr-17 May-17
68
Man anag ageable eable Mar arket et Risk Amidst st Fluctu tuatio tions ns
Being exposed to market fluctuations, financial institutions demonstrated resiliency in dealing with such risks. Net open position of the banking sector remains low, while the investment value of domestic institutional investors (mutual funds, insurers, and pension funds) continues to increase. Net open n positio ition n in the bankin king secto ctor was kept pt far below low the maxim imum limit it (20%) %) The inve vestme tment nt value lue of insur urers & pens nsio ion n fund nds rema main ined in an increasing ng trend nd Multif tifin inanc nce companies’ exposures to foreign debt have generally been mitig igate ted throug ugh hedgin ing measur ures The movement of mutual funds’ net asset value (NAV) is in line with th that t of marke ket t index, but with th much ch lowe wer volatil tility ity
Source: Financial Service Authority (OJK) 2.12 1 2 3 4 5 2012 2013 2014 2015 2016 Jan-17 Feb-17 Mar-17 Apr-17 May-17 % 4.600 4.800 5.000 5.200 5.400 5.600 5.800 6.000 260 280 300 320 340 360 380 400 Jun-16 Jul-16 Aug-16 Sep-16 Oct-16 Nov-16 Dec-16 Jan-17 Feb-17 Mar-17 Apr-17 May-17 Jun-17 Jul-17 IDR tn NAV of Mutual Funds (lhs) IDX Stock Composite Index (rhs) 868 244 100 150 200 250 300 550 600 650 700 750 800 850 900 May-16 Jul-16 Sep-16 Nov-16 Jan-17 Mar-17 May-17 IDR tn IDR tn Investment of Insurers Investment of Pension Funds (rhs) 162 85 60 80 100 120 140 160 May-16 Jul-16 Sep-16 Nov-16 Jan-17 Mar-17 May-17 IDR tn Domestic Debt Foreign Debt
69
Cap apital ital Mar arket et Demo monstr nstrate te Streng ength thening ening Trend nd
In the middle of unfavorable global environment, the domestic capital markets continues its strengthening trend. The volatility of the markets is relatively low.
Source: Bloomberg, IBPA, Indonesia Stock Exchange, Ministry of Finance
Both th the stock ck & bond nd marke kets ts are in a streng ngth theni ning trend nd in July ly 2017 2017, with th a low w leve evel l of volatil tility ity Despite pite FFR R hike ke, the equi uity ty and gove vernm nment nt debt bt marke kets ts still ill attract ct nonresident nt inflows lows The IDX Stock ck Composite ite Index x continu tinues to streng ngth then n and is amo mong ng the best-pe performi ming ng indic ices in the region n (as of July ly 14th
th, 2017, ytd)
In line ne with th the stabil biliz izin ing IDR and improvin ving dome mestic tic prospe pects cts, the gove vernm nment nt bond nd yiel ields continu tinued to declin cline
34,60 8,65
9,49 5,24 5,26 6,90 3,83 15,28 14,12 19,95 10,10 19,16 2,26 11,24
10 20 30 40 TURK BRAZ RUS AS EURO JPN MAL CHIN PHIL SIN HKN INDO KOREA THAI WORLD
%
4.200 4.700 5.200 5.700 6.200 180 190 200 210 220 230 Jan-16 Feb-16 Mar-16 Apr-16 May-16 Jun-16 Jul-16 Aug-16 Sep-16 Oct-16 Nov-16 Dec-16 Jan-17 Feb-17 Mar-17 Apr-17 May-17 Jun-17 Jul-17 Comp Bond Index Comp Stock Index (rhs)
20 40 60 80 100 120 2015 Jan-16 Feb-16 Mar-16 Apr-16 May-16 Jun-16 Jul-16 Aug-16 Sep-16 Oct-16 Nov-16 Dec-16 Jan-17 Feb-17 Mar-17 Apr-17 May-17 Jun-17 Jul-17 IDR tn Gov't Debt Securities Equity 6 7 8 9 10 Jan-16 Feb-16 Mar-16 Apr-16 May-16 Jun-16 Jul-16 Aug-16 Sep-16 Oct-16 Nov-16 Dec-16 Jan-17 Feb-17 Mar-17 Apr-17 May-17 Jun-17 Jul-17 Yield (%) 5-yr Yield 10-yr Yield 20-yr Yield
70
Mai aintain taining ing Finan ancial cial Sys yste tem Stability ability
…maintaining resili ilienc nce in confr front nting ing possible le shocks and enhancin ancing financi ncial al system stabilit ity
Stren engt gthen enin ing finan ancial ial sector ector superv ervis ision ion
the soundness
financial institutions
coverage ratio for banks
risk management for financial institutions
capital requirement for banks
GCG for financial institutions and publicly-listed companies
Stren engt gthen enin ing & stru ructu turin ring financ ancial ial sector tor base sed
inte tern rnatio tional al sta tand ndar ards ds
supervision for all financial sectors
domestic systemically-important banks and capital surcharge
crisis management protocol and interagency coordination Financ ncia ial cong nglo lomerate tes account
for 66.96% %
the total assets
financial sector…
Improv
ing the inte tegr grate ted regu gula latio tion & supervision framework…
improvement has become even more important due to the dominance
financial conglomerates in the domestic financial sector.
has issued regulations
GCG, risk management, and minimum capital requirements for financial
will be followed by regulations
liquidity management, capital management, and intragroup transaction exposures.
Source: Financial Service Authority (OJK), March 2017
Financial Conglomerates 66,96% Others 33,04%
71
A A Compr preh ehens ensive ive Finan ancial cial Dee eepen pening ing Program am
... ...strateg tegy to tackle challenges in deepening Indonesia’s financial markets
Source: Bank Indonesia
Financia ial l Marke rket t Deepen epenin ing g Prog
First t Priori
ty: Conti tinuo nuous us Basis
Marke rket t Devel velopm
ent Coo
dinatio ion
Monitoring, match making, and solution:
Money y Market Encourage well-functioning money market (deep and efficient, risk mitigation, and market integrity), through:
nk Indonesia a Regul ulati ation n (PBI BI) ) on Negotiable able Certi tifi ficate ate of Deposit t (NCD) Enriching money market instruments, encourage banks to raise long term funding, and acts as an alternative investment for investors
nk Indonesia a Regul ulati ation n (PBI BI) ) on Commercial al Paper Alternative sources of financing for non-bank corporations, as well as an investment outlet for investors FX Market
lopment t roadmap dmap of Indo done nesia a CCP in OTC Derivati vative ves To support FX market development and reduce market segmentation.
ablish Local al Currenc ncy Settle lement nt Frame mework Reducing dependency on USD payment for international trade.
urage produc duct t developme ment nt to increas ase hedging ng Supply ly in domesti tic market To provide hedging instrument alternative for corporations to manage their risk exposure
Bonds
Bonds
notes
instruments
(ETP, etc)
Supp ppor
ting g Regu gula lation tions
Money y Broker Certi tifi ficati ation n of Deale aler and d Code de of Conduc nduct Streng ngth thening ng JISDOR
market
Inter er-agenc gency Coo
peratio tion On April 2016, the Minister of Finance, the Governor of Bank Indonesia, and the Chairman of the Board of Commissioners
Market (FK-PPPK). The three authorities have agreed to formulate “The National Strategy to Develop Indonesian Financial Market Towards 2025” which is expected to be concluded by the end of 2017/early 2018.
72
Progres ess
G Gene eneral al Mar arket et Repo Agreement eement (GMRA) A)
4 Banks nks 74 74 Banks ks 4 Banks ks 47 Banks ks IDR 0.0 IDR 1.0 – 4.6 tn tn Signin ing Transaction saction Daily Volume January ary 2016 March ch 2017
Source: Bank Indonesia
73
Contin tinuou
Program am
Cap apital ital Mar arket et Dee eepen pening ing
…continuously strengthened, including through capital market deepening initiative ives
The utiliza ilizatio tion of capit pital l marke rkets ts by domes estic tic cor
pora ratio tions (inclu ludin ding g financia ial l instit titution tions) demons
trates es an incre reasing trend
Stren engt gthen enin ing mark rket infras astructu ructure
Single Investor Identification (SID) coverage
electronic trading platform (ETP) in the debt market
integrated investment management system
the clearing and settlement process
capital market data warehouse
Enhan hancin ing the supply ly-side ide
public-offering requirements & procedures
financial market products (mutual funds, private equity funds, REITs, ABS)
municipal bonds
(harmonizing regulations with ASEAN Disclosure Standards established by ACMF)
Enhan hancin ing the deman and-side ide
the domestic investor base (conducting investor education programs)
mutual fund distribution channels, including the marketing methods
securities companies
Stren engt gthen enin ing govern rnance nce
market players’ capacity
GCG for publicly-listed companies
repo regulations and infrastructure
Source: Financial Service Authority (OJK), July 2017
12.1 4.1 67.1 53.8 116.2 84.7 20 40 60 80 100 120 140 2012 2013 2014 2015 2016 Jan-Jun 2017 IDR tn IPO Equity Rights Issue Corporate Bonds & Sukuk
74
Mac acropru rudentia dential Policy cy Mix to Support rt Growth th
Effective from August 29th, 2016, Bank Indonesia relaxed the Loan to Value Ratio (L (LTV TV) and Financing to Value Ratio (FT (FTV) on housing loans at 85-90% for the first mortgage lending facility, 80-85% for the second mortgage lending facility, and 75-80% for the third mortgage lending facility. The relaxation is only applicable to banks with nett tt NPL for total loan below 5% and gr gros
NPL for property loan/financing below 5%. Hou
g Loans and Financin ing g Based ed on Mura rabaha hah h and d Istis ishn hna Cont
racts ts
Proper erty ty type (m2) Lendin ing/F g/Financin ing Facil ility ity First Second Third House >70 m2 85% 80% 75% 22 - 70 m2
80% <21 m2
>70 m2 85% 80% 75% 22 - 70 m2 90% 85% 80% <21 m2
80% Home Shop/Office
80%
Hou
g Financin ing g Based ed on MMQ Q and d IMBT T Contr tracts ts
Proper erty ty type e (m2) Lendin ing/F g/Financin ing Facil ility ity First Second Third House >70 m2 90% 85% 80% 22 - 70 m2
85% <21 m2
>70 m2 90% 85% 80% 22 - 70 m2 90% 85% 80% <21 m2
80% Home Shop/Office
80%
The rationale is to stimulate domestic demand in order to drive domestic economic growth momentum while maintaining compliance to prudential principles.
Source: Bank Indonesia
1 2
Effective from August 24th, 2016, Bank Indonesia raised the lower limit of the primary reserve requirement’s loan financing ratio (GWM – LFR) from 78% to 80% with the upper limit unchanged at 92%, in order to support credit growth.
75
Finan ancial cial Secto ctor: r: Foste teri ring ng Dome mestic stic Growth th
…boosting domestic econo nomic ic activit itie ies and supporting ing the national nal economic mic develo lopmen ment
Fundin ding
infras astr tructu ture & priorit
econo nomic ic sec ecto tors rs
NBFI
in government bonds
equity funds for infrastructure financing
securities specifically designed for secondary mortgage financing
for farmers and fishermen
Capacit pacity building ilding
finan ancia ial instit titut ution ions
the capital
financial institutions to increase their financing capacity
the business lines
multifinance companies
requirements for rural banks based
their
zones
Dev evelop lopmen ent
finan ancial ial products ducts & serv rvic ices es
the distribution channels for financial products & services
sustainable finance regulations
KYC information from third parties
access to capital market as a source
funding (e.g. simplification
public
procedures)
market deepening initiatives
Dev evelop lopmen ent
Islam lamic ic finan ancial ial secto tor
the capital
Islamic financial institutions
the Islamic business units
commercial banks
Islamic financial product regulations (sukuk, mutual funds, asset-backed securities)
education & socialization
Islamic financial products & services
Source: Financial Service Authority (OJK)
76
BI’s Roles in Supporting Distribution
Non-Cash Cash Socia ial As Assis istan tance ce (NC NCSA) A)
BI supports ports govern rnment nt’s progr gram am
iftin ting social ial assist istan ance to tar arget eted ed non cash social ial assis ista tance nce disb sburs rsem emen ent throug
the electr tronic nic payme ment nt syst stem
the futur ure, electr ectron
ic mechan hanism ism disb sburs rsem ement nt will be also applied ied to LPG subsidy. idy. NCSA SA Prog
Family ly Hope Progr gram am (Progr gram am Keluar arga ga Harapan an
KH) Smart rt Indones esia ia Progr gram am (Progr gram am Indones nesia ia Pintar tar-PIP IP) Non Cash Food Assistanc nce
2016-2020
Pilot
Project
Gradu adual Implem lemen entatio tion
Inter erconnecte cted & inter eroper erable le payment system em
LPG Subsid idy
Full Implem lemen entatio tion
XXYYZZ 12345678
9876543210
77
Progr
ss
NCSA Progr
ams
Family ily Hope Prog
am (Prog
Keluar luarga Harap apan an
H) Pros
perou
Rice (Ber eras as Sejahte jahtera / Ras astr tra)
provides cash to very poor households. Rp 2 million /year will be granted for each household (hh). PKH will be granted every February, May, August, and November
3 million distributed on non-cash basis and the remaining in cash basis. However, in the 2nd semester of 2017 all PKH will be distributed on non-cash basis.
2.65 million hh (88,33% of 3 million hh).
protection program that is managed by the central government. It provides subsidized rice to low-income households. Rp 110 thousand/month will be granted for each hh as Non-Cash Rastra.
million hh (9% of total target 15.5 million hh) in 45 cities and 6 regencies. Non-cash Rastra can be used in certain stores: Toko Sembako, E-warong, and Rumah Pangan Kita.
granted to 881 thousand hh.
to 10 million families in 200 regencies in 2018.
Cash 50% Non- Cash 50%
January 2017
Non- Cash 100%
2nd Semester of 2017
PKH Target et
23% of total target of household.
78
Strong nger er Fundam amen entals tals Fac acing ng the he Headw adwind inds
197
35
5,62
1998 2008 Sep 16 82,4 12,1 6,8 1998 2008 Sep-15 30,0 3,8 2,8 1998 2008 Agu-15 17,4 50,2 1998 2008 Sep-15
Inflatio lation n Rate te (%) %) IDR Move veme ment nt (%) Non-Pe Performi ming ng Loan/NPL PL (% (%) Governm nment nt Debt bt/G /GDP Foreig ign n Reserve ves (USD bn)
100.0% 1998 98 27.4% 2008 08 28.1% May 20171 8.6x 1998 98 3.1x 2008 08 2.7x Q1 Q1-201 2017 116.8% 1998 98 33.2% 2008 08 34.1% Q1 Q1-201 2017
More Liqui uid Marke ket (%) %) Exte xterna nal l Debt t (Pub ubli lic c & Priva vate te) to FX Reserve ve Ratio io Exte xterna nal l Debt/GD t/GDP
Inflation controll lled ed within the target et range IDR still l apprecia ciated ed in H1 - 2017 17 NPL lev evel el is belo low the maximum thres eshold d of 5% Consisten ently ly well-maintained ned below 30% Significa cantly ly higher er than 1998 98 & 2008, 08, ample to cover er 8. 8.6 months of import and external al debt repay payment Significa cantly ly lower er than 1998 98 crisi sis Sligh ghtly ly high gher er than 2008, 08, but significa cantly ly lower er than 1998 98
June 17
12 123.09 09
June 17
4.37 (yoy)
May 17
3. 3.07 07
62 62 10,5 5,7 1998 2008 Jul-15
Over ernigh ght interbank nk money market rate is rela latively ly lower er
June 17
4.39 1.1 (ytd)
June 17
1 2017 year end position of debt/GDP ratio is projected based onGDP assumptions in APBN (Budget 2017)
79
Outlo look
Dome mesti stic Economy Remain ains Robust st
...d ...domes mestic ic econo nomic ic growt wth is predict icted to be highe her in 2017
2017 Econom
ic Outlo tlook
Economy to grow in the range of 5.0-5.4% (yoy) in 2017, supported by stronger export performance and investment. Inflation is predicted to be within the 2017 inflation target of 4±1%, with the current account deficit projected below 2.5% of GDP Credit is expected to grow 10-12% in line with expectations of expected economic gains and ongoing impact of previous monetary and
macroprudential policy easing.
2016 16 (Rea ealiz izat ation) ion)
Econom nomic ic Growth
5.02 02%
Infl flation ion
3.02 02%
CAD AD (% (% of
1.8% 8%
Credit it Growth
7.9% 9% 2017 17 5.0-5.4 5.4% 4.0±1% <2.5% .5% 10 10-12%
Globa bal Domestic tic Opport rtun unit ities ies
global economic growth
world trade volume
recovery process Challen lenges
FFR hikes
plan to shed its large balance sheet
the US fiscal policy
consolidation in the corporate and banking sectors
2017 Econom
ic Opport
unitie ities & & Challe halleng nges
Source : Bank Indonesia
81
The he Governm rnment ent has as Enac acte ted Var arious us Reform rms to Accel eler erate te Infrast astru ructur cture Provisio ion
Fiscal al Reforms rms Instit itut utio ional nal Reforms rms Regula ulatory ry Reforms rms
Source: Committee for Acceleration of Priority Infrastructure Delivery (KPPIP)
Viabilit ility Gap Fundin ing (VGF) KPPIP IP Direc ect Lending ing Issuance
MoF Reg. No. 223/2012. To increase project financial feasibility by contributing up to 49%
the construction cost Availabilit lability Paymen ent Land Revolv lving ing Fund Risk-sharing ring Guideline delines Issuance
regulatory framework for annuity payment scheme by the Government (MoF Reg. No. 190/2015 for Central Gov’r and MoHA Reg. No. 96/2016 for Regional Gov’t.) during the concession period after the project
by private sector in
to make the project bankable Issuance
MoF Reg. No. 220/2010. A revolving-fund sourced from State Budget, to accelerate land acquisition IIGF has issues risk allocation and mitigation guidelines for PPP project KPPIP is actively involved in accelerating delivery
priority infrastructure projects
na Mult lti Infras astr trukt uktur ur Merging between
and Gov’t Investment Center (PIP) to become an infrastructure funding company Indo done nesia ia Infrastruc tructur ture Guarante tee Fund (IIGF) IIGF has the potential to provide project guarantee for non-PPP projects PPP Unit Provide facilities to help GCA
preparing PPP project (PDF/TA) BLU LMAN The State Asset Management Agency is mandated to provide land fund for National Strategic Projects to ensure timely land acquisition process Issuance
Presidential
82/2015. Allow guarantee for direct lending to SOE to accelerate financial close process for infrastructure projects Land Acquisit itio ion Issuance
Presidential
148/2015. To stipulate land acquisition acceleration based
Law
Econo nomy Packag kages es Conduct deregulation for issues hindering infrastructure delivery and develop a task force under CMEA to ensure the effectiveness
economic packages implementation
82
Reforms Along the Project’s Life Cycle
...to enco cour urag age and accele lerate te infras astruc ructur ure project ct using ng PPP scheme me Governm rnment nt
Indone nesia sia
Project
Dev evelop lopmen ent Facility lity (PDF) PDF) Viab abil ilit ity Fundin ding Gap (VGF) F) Guar uarant ntee Fund Tax Facilitie lities Availab ailabil ilit ity Payme ment Land nd Acquis uisition ition Preparation Bidding Process Construction
Project development facility contributing to assist GCA on PPP project preparation (PDF&TA) Managing entity: KPPIP, PT SMI PT IIF, and Ministry of Finance A facility with contribution to construction cost to increase project financial viability Managing Entitiy: Ministry of Finance based
proposal Gov’t. commitment: 49% max. Per project cost
Guaranteeing Govt. contractual
under infrastructure concession agreements and Mof Regulation No 130/PMK. 08/2016 re: Govt guarantee for electricity project acceleration Managing entity: IIGF and MoF Govt’s comitment: US$ 450 mn
MoF Reg. No. 159/PMK. 010/2015 re: tax holiday for pioneer sector, such as base metal, oil refinery, basic petrochemical, machinery, renewable energy, & telco equipment
will be further expanded Managing entitiy: Ministry of Finance A scheme in which concessionaires receive sum of money periodically from central or regional government after the completion of an asset. MoF Regulation, and MoHA Regulation on Availability Payment has been ratified. Managing entity: Ministry of Finance & Ministry of Home Affairs A facility to support land acquisition for infrastructure projects particularly projects that involve private sector Managing enitiy: Ministry of Finance, Ministry of Agrarian and Land Spatial/BPN and BLU-LMAN Gov’t. commitment: US$ 12 mn (2016) Source: Committee for Acceleration of Priority Infrastructure Delivery (KPPIP)
83
Effort rts to Accel eler erate te Infras astru tructu cture Provisio sion
Regu gula latio ion improvem ement ent to to accel elerate land procu curemen ment proce cess ss
about the land acquisition duration for the Government Contracting Agencies and the Investors. The Law sets an estimated 583 days maximum time to complete the land acquisition process.
Regulation No. 71 of 2012 on Land Acquisition Implementation for Developing Public Facilities, which has been revised into the Presidential Regulation No. 30
funding for a land acquisition which can be reimbursed by the Government following the completion of land acquisition process. With this Regulation, the land acquisition process is expected not to be delayed by the unallocated budget or the delay on the budget disbursement.
Land Procurem rement t Proces ess s as Stipula lated ted in Law No. 2 of 2012
Law No
was succes essfull lly applied plied in in: 1. 1. Pa Pale lembang – In Indr dralaya sect ection ion of
the Tr Trans Sumater era Toll ll Roa
2. 2. Java va Nor
th Line Dou
le Track Rail il Project
Source: Committee for Acceleration of Priority Infrastructure Delivery (KPPIP)
84
Effort rts to Accel eler erate te Infras astru tructu cture Provisio sion
…the establishment
Indone nesia ia Asset Manag agemen ment Agency ncy (LMAN) AN)
Source: Ministry of Finance
On On Dec ecem ember er 12 12th,
th, 2016, Ind
Indone nesia ia Asset Manag nagem ement Agency ency (Le Lembag baga Mana anaje jemen Aset Neg egar ara/ a/LM LMAN) has bee been launc launched ed to to optimiz timize th the use of
tate asset
LMAN should uld plan lan for funding funding and nd utiliza utilizatio tion of
land nd bank banks as as we well ll as as pay compen ensatio tion for land acquis isitio ition to to support rt the government’s infras astr truc uctur ure develo lopment ent progr gram am
Mandate
1. Government Regulation No.27/2014
the Management
State/Region Property 2. Finance Minister Regulation No.219/PMK/2015
the Governance and Organization
State Asset Management 3. Finance Minister Regulation No.1319/KMK.05/2015
the Appointment
Indonesia Asset Management Agency as Government Agency to Implement Financial Management
Public Service Agency
Legal al Basis
Management
Funding for National Strategic Project
ex-Pertamina: LNG Badak Bontang, LNG Arun, and Tarogong Land
ex-Indonesian Bank Restructuring Agency (BPPN) Other portfolio: Asset
ex-Asset Management Company (PPA) and ex- Contractor Cooperation Contract (KKKS)
Portfolio io Assets
85
Und nder President sidentia ial Reg. . No.3/2 3/2016 j.o j.o. . the Presid sidential ential Reg. . No.
58/20 /2017, 245 45 proj
cts and nd 2 prog
ams are listed ted as PSN
PSN includ udes es 15 s sectors
at projec ect level el and 2 sectors
at program am level el
7
IRIGASI
Proje ject
Electricity 1 PROGRAM Small- Medium Airplane 1 PROGRAM
74 74 12 12 6 4 7 54 54 9 3 3 30 30 8 10 10 23 23
61 24 27 13 15
Projects Proyek
93 93 10 10 1 12 12 2
Projects Programs
US$49.0 Bn US$43.4 Bn US$13.0 Bn US$34.2 Bn US$100 Bn US$0.8 Bn US$81.9 Bn
Projects Projects Projects Project s Projects Projects Projects Projects Projects Projects Projects Projects Projects ROAD RAILWAY SEAPORT AIRPORT INDUSTRI-AL ZONE HOUSING HOUSING WATER & SANITA- TION IRRIGA- TION DAM TECH- NOLOGY OIL REFINERY SMELTER National
Projects Projects Projects Projects Projects Projects1
Project FISHERY
Exchange rate: US$ 1 = IDR 13,000
1
Project SEA DIKE
Progr gram am
86
PSN may ay receive ive pri rivil vileg eges es as stipula pulated ted in the Presid sident entia ial Reg. . No.
2016 j.o j.o. . the Presid sidential ential Reg. . No.
/2017
01 01 02 03
Determination of National Strategic Projects
04 05 06 07 08 09 10 10 11 12
Permit & Non- permit Completion Spatial Planning Land clearing acceleration Local Content Utilization Government Guarantee Provision Projects Monitoring via KPPIP IT System SOE’s Assignment Problems and Hindrance Completion Accelerate Goods and Service Procurement Settlement of Legal Issues Acceleration of Non- State Budget Projects
Additional Facilities Existing Facilities
87
Progres ess
245 45 Natio ional al Strate tegic gic Projects ts
SECTORS RS LOCATION IONS
tera 61 61
93 93
ntan 24 24
& Nusa Tengga gara 15 15
wesi 27 27
uku & Papua ua 13 13
nal 12 12 2% 53% 5% 40% 5 projects are completed 130 projects are under construction1 12 projects are during transaction 100 projects are in preparation
Roa
Com Communi
tion Natio tional l Bord rder ers Econo
ic Zones es Irr rriga igatio ion
74 74 4 3 30 30 7
Hou
g Ener ergy gy
Fisherie ies/ Marit itim ime
Water er Supp pply ly Airpo rport Sea dike
3 12 12 1 9 8 1
Seapor por t Railw ilway Dams Smel elte te r Power er Aircra rcraft t indu dustr tr y
10 10 23 23 54 54 6 1 1 Pro rogres gress of Natio ional al Strateg tegic ic Pro roje jects (as of June 201 2017) The Estimate ated Inves estment ent Cost of National nal Strateg tegic ic Pro roje jects
Priv ivate te (IDR2,414 tn tn) SOE (IDR1 R1,258 tn tn) State Budget et (IDR5 R525 tn tn)
IDR 4,197 97 tn tn
Notes:
calculated for 245 NSP.
unknown investment cost. Source: Committee for Acceleration of Priority Infrastructure Delivery (KPPIP)
1Including one electricity program under construction
category (39% of electricity program has reached construction per April 2017)
88
Progres ess
3 30 Pri riori rity ty Projects cts
1. Balikpapan-Samarinda Toll Road 2. Manado-Bitung Toll Road 3. Panimbang-Serang Toll Road 4. Trans-Sumatera Toll Road (8 Sections) 5. SHIA Express Railway 6. MRT Jakarta South-North Line 7. Makassar-Parepare Railway 8. Kuala Tanjung International Port Hub 9. Bitung International Port Hub 10. Karangkates IV & V (2x250MW) Hydro-Electric Plant 11. Kesamben (37MW) Hydro-Electric Plant 12. Lodoyo (10MW) Hydro-Electric Plant 13. Inland Waterways Cikarang-Bekasi-Laut (CBL) 14. Light Rail Transit (LRT) South Sumatera 15. Integrated LRT Jakarta-Depok-Bogor-Bekasi 16. National Capital Integrated Coastal Development (NCICD) Phase A 17. Jakarta Sewerage System 18. West Semarang Water Supply System 19. High Voltage Direct Current (HVDC) 20. Sumatera 500 kV Transmission Line 21. Central-West Java 500 kV Transmission Line 22. Batang, Central Java Powerplant 23. Indramayu Powerplant 24. Mine to Mouth Powerplant South Sumatera 8-10 25. Bontang Refinery 26. Revitalization of the Existing Refineries (Balikpapan, Cilacap, Balongan, Dumai, Plaju) 27. New Port Development in West Java (North Part) 28. Tuban Refinery 29. Palapa Ring Broadband 30. East Kalimantan Railway Transactio tion Prepa paratio tion Reassess essed ed
8
5
9
18 18 17 17 13 13 23 23
25 25 26 26
27 27 28 28
30 30
16 16 10 10
1
3
2 4
6
7 4 4 4 4 4
4 4 15 15
14 14 20 20
21 21 22 22
29 29 29 29 29 29 29 29 29 29 29 29 29 29 29 29 29 29 29 29
11 11 12 12 19 19
24 24
Constructio tion
From the Nationa ional Strateg egic ic Proje jects, ts, the Gov
ernm nmen ent has selecte lected a list
30 Priority iority Proje ject to be the focus us
infrastr tructu ture deliv livery ry in the begin ginning ing
2016. 6.
Source: Committee for Acceleration of Priority Infrastructure Delivery (KPPIP)
89
Progres ess
3 30 Pri riori rity ty Projects cts
Recen ent t Miles esto tones es Prog
ess of 30 Prio iori rity Project
ly 2017) Fundin ding g Schem eme e of 30 Prio iority ity Project
13 projects are in construction 3 projects are in transaction 9 projects are in preparation 5 projects are reassessed
1
Priv ivate te (IDR7 R770 tn tn) SOE (IDR3 R325 tn tn) State Budget et (IDR2 R255 tn tn)
Consultant team
OBC PHI Bitung has been established, PT Mott MacDonald Indonesia, PT Deloitte Konsultan Indonesia, dan PT Hanafiah Ponggawa & Partners KA-ANDAL assessment process is completed after fulfilling administrative pre-requirements including letter from Spatial Planning Director General, Seaport Transport Director General and project’s inclusion in National Port Master Plan. PPP has been agreed as the financing scheme by the main stakeholders Governor regulation
regarding the assignment to
Jakarta was published.
15 projects reassessed include HVDC; Mine Mouth South Sumatera 8,9,10 Plant;
Karangkates IV & V, Kesamben and Lodoyo Plants.
Bitu tung ng Inte terna nationa ional Port rt Hub Cilac lacap ap Refine inery ry Rev evitaliza italizatio tion Wes est Semar aran ang Wate ter Supply ly Jak akart arta MRT (Sou
th-Nort North Line ne)
Source: Committee for Acceleration of Priority Infrastructure Delivery (KPPIP)
10% 43% 30% 17%
90
Energy gy Secto ctor: r: the he Progres ess
35.000 000 MW Program am
No No Phase MW MW % 1 Operating 758 2 2 Construction 14,593 41 3 Signed Power-purchase Agreement 8,150 23 4 Procurement 5,355 15 5 Planning 6,970 19 17 Dec ‘14
Cabinet t Meeting ing “There’s electricity crisis in Indonesia, requires construction
Jan ‘15
Aver erage ge economi mic growth th of 6.7% % requir ires es 7,000 MW / year or 35,000 MW / 5 years (Kepmen ESDM No. 0074/2015 on RUPTL 2015-2024)
Jan ‘15
Debottl tlen enec eckin ing g through gh regulatio tion:
supply cooperation & joint utilization of the electrical network among license holders.
No.3/2015, concerning Procedures
Purchasing Electrical Power and benchmark prices for Electrical Power through the Direct Selection & Appointment.
16 Mar ‘15 4 May ‘15 June‘17
Cabinet t Meeting ing Progress of 35,000 MW Launchi hing g 35.000 MW by the President in Goa Beach Sanden DIY The progres ess so far:
Source: KPPIP
Sulawesi si PLN: 2,000 MW Private: 1,470 MW Transmission: 5,275 ckt.km Substation: 4,390 MVA Maluku PLN: 260 MW Private: 12 MW Transmission: 653 ckt.km Substation: 620 MVA Papua PLN : 220 MW Private: 0 MW Transmission: 364 ckt.km Substation: 460 MVA Kalim imanta tan PLN: 900 MW Private: 1,735 MW Transmission: 5,604 ckt.km Substation: 3,500 MVA Nusa Tenggara PLN: 670 MW Private: 0 MW Transmission: 2,347 ckt.km Substation: 1,410 MVA Sumate tera PLN: 1,100 MW Private: 8,990 MW Transmission: 18,729 ckt.km Substation: 35,521 MVA Jawa & Bali PLN: 5,000 MW Private: 13,697 MW Transmission: 9,185 ckt.km Substation: 66,265 MVA
35,000 MW Prog
tributio tion
Source: PLN
91
Accel eler eratio tion
35.00 000 MW Program am
Gov
ernm nmen ent PT PLN
EPC C Power erpla plant t and d Transmis issio ion PLN Subsidia idiary (Joint
ture) e) Indepen ependen ent Power er Prod
er
Stren ength gthen Equity ty 2B 2B 1
Gov
ernmen ent t Supp ppor
t (outs tside ide Guara rantee) tee)
Local l Con
tent t Obligation on the usage of local content through an open book system, price guideline, reverse engineering or other methods to maximise the local content.
2A 2A
Assign ignmen ent SJKU* U* Minis istry try of Finance
Strength then PLN‘s Balanc nce Sheet
*)SJKU=Surat Jaminan Kelayakan Usaha/ Business Viability Guarantee Letter The Gov
ernmen ent t has issued ed Pres esiden identia tial l Regu gula latio ion No.
tric icity ity Infrastru tructu ture e Accel eler eratio tion to accel eler erate te power er proj roject ects Prov
isio ion of Electri tricity ity Refin inancin ing Hedgin ging Financia ial l Asset et Optim imiz izatio ion Direct Lending Direct Lending Bond issuance by PT PLN Company Tax Holiday PT PLN’s divident allocation Loan from independent lenders Asset Revaluation Other types
Equity Injection by the Government
Source: Committee for Acceleration of Priority Infrastructure Delivery (KPPIP)
92
Sign gnificant ificant Progres ess
I Infras astr tructu ucture Projects cts
Databas ase Project information such as map, track, existing study and latest project status. An integr grated ted IT system with monitoring capacity for stakeholders, so that they can have real time data ta. Platform rm data
that is efficient and functional using a user-friendly framework. Record decisions related to projects and synchronize ize the implementation schedule that can be utilized by stakeholders.
KPPIP developed an integrated IT System for monitoring
national strategic and priority projects, providing database on projects’ latest status which can be effectively utilized for monitoring and decision-making purposes. Impr prov
ing g Monitor itorin ing g System tem on Infrastru tructu ture e Project
Roads
Trans-Sumatr tra Toll Road Merah h Putih ih Bridge idge, Ambon
Dams
Jatig igede de Dam (Opera ratio tional)
Transp nsportatio tion
Jakarta ta MRT Project2
Drinki nking ng Wate ter Proce cessin ing
Umbulan Drinkin king Water Provi visio sion System, East t Java
1 Source: Committee for Acceleration of Priority Infrastructure Delivery (KPPIP) 2 Not funded from National Budget
Terminal 3 Ultima imate te Soeka karno-Hatta tta2 New Tanjung Priok k Port t Project2 Nop Go Golia iat t Dekai, i, Papua
93
Inves estm tment ent in Iron Ore, e, Alumin mina an and Bau auxite ite Smel elter er
Exis istin ting g Iron
e Refin iner ery Facility ility
No. Compan any Produc uct Ore Input ut Capac acit ity (ton) Con
e Input ut Capac acit ity (ton) Investment (USD mn) Progress Completio ion Date 1 PT DPS Sponge iron 1.100.000 220.000 40 100% 2012 2 PT MJIS Sponge iron, slab, billet 3.300.000 660.000 150 100% 2013 3 PT SBP Cold Bricket Iron 240.000 65.800 120 100% 2017 No. Compan any Produc uct Ore Input ut Capac acit ity (ton) Con
e Input ut Capac acit ity (ton) Investment (USD mn) Progress Completio ion Date 1 PT SILO Sponge iron 8.000.000 6.300.000 170 61% 2021 2 PT RS Sponge iron 3.200.000 264.000 6,9 0% 2020
Completed but not operating
No. Compan any Produc duct Input ut Capac acit ity y (ton) n) Investment (US$ mn) Progress Completio ion n Date 1 PT Indonesia Chemical Alumina Chemical Grade Alumina 851.725 0,49 100% 2013 2 PT Well Harvest Winning Smelter Grade Alumina 3.000.000 (Phasa 1) 6.000.000 (Phase 2) 1,1 Phase 1 : 100% Phase 2 : 0% 2016 (Phase 1) 2017 (Phase 2)
Upcom
ing g Iro ron Ore e Refin iner ery Facility ility Existin isting g Alumin mina and d Bau auxit xite e Refin inery ery Facilit ility Completed and operating
Source: Ministry of Energy and Mineral Resources, July 2017
94
Inves estm tment ent in Nickel ckel Smel elter er
Source: Ministry of Energy and Mineral Resources, July 2017
95
Finan ancing cing Nee eeds an and Sche hemes mes
95
Source: Ministry of Finance
145. 5.9
SOE SOE
Private vate 234. 4.8 88.8 .8 Financ ancing ng Needs ds Gov’t t Budg dget Financ ancing ng Gap Gap 399. 9.6 6 164.8 4.8 *(USD D bn bn) ) 41,3 ,3% 58,7% ,7% 22,2 ,2% 36,5 ,5% 100% 0%
mainly for projects that are economically feasible but financially are not.
(electricity, toll roads, oil, etc.) to leverage public funding channeled through capital injections (PMN) and empower SOEs
economically and financially feasible.
financially feasible.
infrastructure projects
government provide a number of financial facilities, such as:
Infrastru tructu ture Financin ing g Need d 2015-2019 2019 Gen ener eral l criter iteria ia for
ing g schem emes es Financia ial l Facilities ilities Prov
ided to SOEs Infrastr tructu ture e Proj
ects PPP schem eme e and d facilities ilities pro rovided vided to PPP Pro roject ects
96
Man anag agem ement ent
C Conting tingent ent Li Liab abilities ilities
Credit edit Guarantee tee PPP PPP Guarantee tee Busin ines ess Viability ility Guarantee tee Power er (Elect ectri ricity) ity) – Full credit guarantee for PLN’s default on its payment obligation (FTP 1 10,000 MW, 35GW) Water er – 70% guarantee of PDAM’s principal payment obligation Infrastru tructu ture - Full credit guarantee on SOE’s default (for lending from international financial institution) & guarantee for PT SMI (local infrastructure financing) Toll ll roa
Karya’s payment obligation (Sumatra Toll Road Development) Power er (Electricity) – Guarantee on the viability of PLN to fulfill Purchase Contract Electricity & guarantee against political risk Infrastru tructu ture – Guarantee on the obligation
to the Agreement
No No. Central al Government Guar arantee for Infrastruct uctur ure Programs Guar aran antee Docum uments Commit itted Guar aran antee Amoun unt (USD bn bn)1 Exposur ure/ Outstanding (USD bn bn)1 1 Coal Power Plant 10,000MW Fast Track Program (FTP 1) 36 6,98 3,47 2 Clean Water Supply Program 10 0,02 0,01 3 Direct Lending from International Financial Institution to SOEs 2 1,10 0,23 4 Sumatra Toll Road Development 3 0,20 0,07 5 Renewable energy, Coals & Gas Power Plant 10,000 MW (FTP 2) 12 11,91 1,47 6 Public-Private Partnerships (PPP) 5 5,81 0,83 Total al 68 68 26,03 03 6,08 As % of GDP 2.8% 0.7%
For the period 2017 – 2020, the e Maximu mum m Guarantee ee Limi mit t is set at 6% of GDP GDP In compliance with the guarantee limit, with projected 2020 GDP of IDR 18,000tn (eq. USD 1,349bn), the capacity for guarantee issuance during 2017-2020 is IDR 1,083tn (eq. USD 81bn) – cumulative
Gov
ernmen ent t Guarantee tee Prog
tfolio lios 2008 - Pres esen ent Guarantee tee Prog
ed on Guara rantee tee Cla lassif ific icatio tion
97
Gover ernment ment Finan ancia cial Fac acilities ilities for PPP Proje jects cts
Financ ncial ial Facilit ilities ies to Attrac act More Priv ivate te Part rtic icip ipatio tion
Those financial facilities were instrumental in supporting the execution of PPP projects, indicated by the signing of financial close
Viabilit ility Gap Fund (VGF) Proje ject Develo lopment ent Facilit ility (PDF) Governm ernmen ent Guarante ntees es (dir irec ectly ly by MoF or through gh IIGF) Financ ncing ing from PT
and
Availabilit lability Paymen ent Schemes es More Fundin ing Schemes es are
the Pipelines lines
Project Financing funded by the priv ivate te secto tor through the granting of concessions for an
Government/SOE (based on the policy of the Government) to the private sector to be
Project Financing funded by any source of funds other than Government’s budget, e.g. long term management funds (insurance, repatriated funds from tax amnesty, pension funds, etc.), private equity investors and infrastructure funds. Supported & facilitated by National Development Planning Ministry/Bappenas.
several years
Sche heme me Character teristic istics Sche heme me Character teristic istics
LCS (Limited ited Concessio ion Scheme) e) PINA (Non-Gov Governm ernment nt Budget et Infras astr truc uctur ure Financ ncing) ing)
98
Progress ess
P PPP Infrast astru ructur cture Proje jects ts
No No Projec ect Name me Projec ect Cost (IDR R tn tn) Financia ial Facil ilities ities Status 1 Central Java Power Plant 40 Guarantee (MoF & IIGF) FC on June 6th, 2016; Construction 30%; COD Target: May 2020 2 Palapa Ring – West Package 1.28 PDF, IIGF Guarantee & AP FC on August 11th, 2016; COD target: February 2018 3 Palapa Ring – Central Package 1.38 PDF, IIGF Guarantee & AP FC on September 29th, 2016; COD target: March 2018 4 Palapa Ring – East Package 5.13 PDF, IIGF Guarantee & AP FC on March 29th, 2017; COD target: September 2018 5 Umbulan Water 2.1 PDF, VGF & IIGF Guarantee FC on August 30th, 2016; COD target: July 2019
Succes essful ful Proje jects ts Reaching ing Finan ancial ial Close in 2016 and 2017
No No Projec ect Name me Projec ect Cost (IDR R tn tn) Financia ial Facil ilities ities Status 1 Batang–Semarang Toll Road 11 IIGF Guarantee PPP & guarantee contracts signed on April 27th, 2016 2 Manado–Bitung Toll Road 5.1 IIGF Guarantee PPP & guarantee contracts signed on June 8th, 2016 3 Samarinda–Balikpapan Toll Road 9.9 IIGF Guarantee PPP & guarantee contracts signed on June 8th, 2016 4 Pandaan–Malang Toll Road 5.9 IIGF Guarantee PPP & guarantee contracts signed on June 8th, 2016 5 Serpong–Balaraja Toll Road 6.0
6 Jakarta–Cikampek Elevated Toll Road 14.8 Co guarantee (MoF & IIGF) PPP & guarantee contracts both signed on December 5th, 2016 and February 22nd, 2017 7 Krian–Legundi-Krian Toll Road 9.0 Co guarantee (MoF & IIGF) PPP & guarantee contracts both signed on December 5th, 2016 and February 22nd, 2017 8 Serang–Panimbang Toll Road 5.3 Co guarantee (MoF & IIGF) PPP & guarantee contracts signed on February 22nd, 2017 9 Cileunyi–Sumedang-Dawuan Toll Road 8.2 Co guarantee (MoF & IIGF) PPP & guarantee contracts signed on February 22nd, 2017
Signed PPP PP Proje
in 2016 and 2017
Source: Ministry of Finance, as of July 2017
99
New Guar aran antee tee Sche hemes mes for Non-PPP PP Projects cts
The Government had issued Pres esid identi ential al Re Regula ulatio tion No No 82 82/2015 and Minis inistr try of
inanc nce Re Regu gula latio tion No No 189/2015 to provide guarantee for SOE Direct Lending from IFIs for the Development of Infrastructure Projects. Guarant antee ee
SOE Direc ect Lending ing from Interna rnatio tional nal Financ ancial ial Institut tutio ions ns (IFIs Is) Guarant antee ee for Regio ional al Infrastr tructur ture Financ ncin ing Provis isio ion State finan ance soundnes ness Fiscal al sustainabiliy nabiliy Best practic tice
fiscal al risk managem ement ent The
this guarantee is to provid ide credit edit enhanc ncem emen ent in terms
low inter erest rate and long tenor finan ancing ing, with 3 main prin incip iples les:
The Government had issued Min inis istry try
Fin inance Regu egulati tion
No No 174 174 of
2016 to provide guarantee to PT SMI
the assignment
regional infrastructure financing provision, by loan to local governments that is transferred from PIP to PT SMI, and new loan channeled by PT SMI to the local government. Based
Gov Govern rnmen ent Regu egulation tion No No. 95 95/2015 2015 and Min inis istry try
Fin inance Reg egulation tion No No. 232 232/2015 2015, Minister of Finance assigns PT SMI (Sarana Multi Infrastruktur) to carry
local government, as previously carried
by PIP (Government Investment Center). The objective is to give give sti timulus to to the the accel eleration ion
lo local in infrastr tructure re dev devel elop
ent through the ease of access to infrastructure financing and to boost local economic growth, as well as to provide alternative financing schemes in
to meet local infrastructure development needs and to reduce reliance
state/local budget.
100
Progress
SOE’s Projects
Prog
ess of Pro roject ects Benef efiti iting g fro rom Guarantees tees on SOE Loa
No No Sectio ions Length th (Km) Proje ject Cost (IDR bn bn) Status us (as
Mar arch 10 10th
th,
2017) 1 Medan-Binjai 17 2.74 Construction progress: 54.18% Land Acquisition: 89.91% 2 Palembang-Indralaya 22 3.30 Construction progress: 52.68% Land Acquisition: 97.68% 3 Bakauheni-Terbanggibesar 140 16.79 Construction progress: 23.88% Land Acquisition: 78.14% 4 Pekanbaru-Dumai 131 16.21 Construction progress: 41.02% Preparation for DED 5 Terbanggibesar-Pematangpanggang 100 11.86 Preparation 6 Pematangpanggang-Kayuagung 85 10.08 Preparation 7 Kisaran-Tebingtinggi 60 6.99 Survey and Planning 8 Palembang-Tanjungapiapi 90 14.29 Survey and Planning The Government issued government guarantees to loans of PT. Hutama Karya in the development of Trans-Sumatera Toll Road, as comprise as follow:
101
Progress
SOE’s Projects
Prog
ess of Pro roject ects Benef efiti iting g fro rom Guarantees tees on SOE Dire rect t Lendin ding
No No Proje ject Name Proje ject Cost (IDR mn mn) Lender er SOE Status us 1 Sumatera Power Transmission and Distribution 600 ADB
Guarantee is effective 2 Sumatera Power Distribution 500 World Bank
Guarantee is effective 3 The Enhancement
Electricity Grid 330 IDB
Preparation
guarantee issuance (recommendation to the Minister
Minister for Approval)
Other er Guarantees tees That at Hav ave e Been Provided
ts
No No Progr gram am Guarant antee ee Commit ited ed (IDR bn bn) SOE Number
Guarant antee ees 1 Fast Track Program 1 6.98
36 2 Fast Track Program 2 11.91
12 3 Clean Water Supply Program 0.02 PDAM 10