A new metric to describe the efficiency of data communication - - PDF document

a new metric to describe the efficiency of data
SMART_READER_LITE
LIVE PREVIEW

A new metric to describe the efficiency of data communication - - PDF document

FINAL WORKSHOP OF GRID PROJECTS PON RICERCA 2000-2006, AVVISO 1575 1 A new metric to describe the efficiency of data communication networks. Elena Marchei 1 , Sandro Meloni 2 , Saverio Di Blasi 1 ,Vittorio Rosato 3,4 1 Ente per le Nuove


slide-1
SLIDE 1

FINAL WORKSHOP OF GRID PROJECTS “PON RICERCA 2000-2006, AVVISO 1575” 1

Abstract— This work has been focussed on the

characterization of the congestion transition,

  • ccurring on model networks when traffic

volume increases above a given threshold, and on its dependence on the network’s topology. We have attempted to describe the transition using a number of quantities which might be measured

  • n the different network’s components. We have

evaluated several quantities and showed how they behave above and below the congestion

  • threshold. In particular we were interested in

defining quantities which could provide each network’s node a certain ”awareness” of the global state of the network. Synthetic Internet- like and Random networks have been generated by using well-established growth mechanisms; data traffic behavior on the networks has been simulated by using either a simple traffic model (hereafter referred to as Traffic-Model) which reproduces the basic features of the traffic protocols and the NS2 tool which allows to simulate the whole TCP/IP stack. Data traffic undergoes a phase transition from a low-traffic phase of normal behaviour to a congested phase, characterized by a rapid increase on the value of the average delivery time of data packets and a sharp reduction of the Quality of Service, which accounts also for the number of effectively delivered data packets. We propose the use of a new metric to individuate the onset of the congestion transition. The proposed quantity, referred to as "node's temperature" allows to integrate, in an unique value, information on the local and the global state of data traffic. Node temperature can also be used to implement new adaptive routing strategies able to prevent (or delay) the congestion transition.

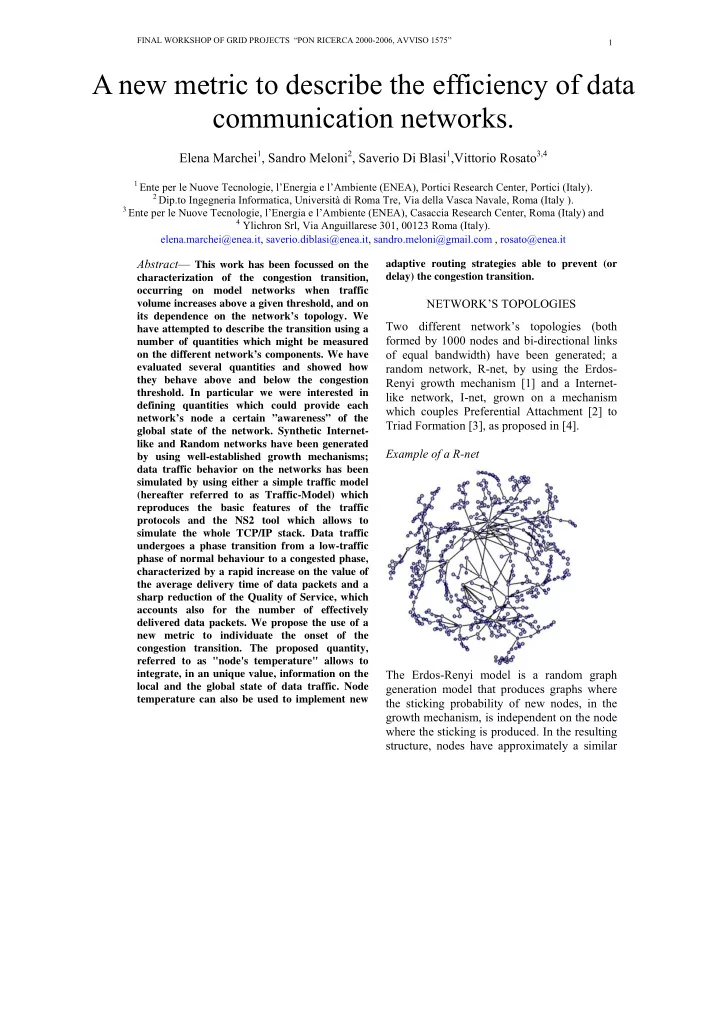
NETWORK’S TOPOLOGIES Two different network’s topologies (both formed by 1000 nodes and bi-directional links

  • f equal bandwidth) have been generated; a

random network, R-net, by using the Erdos- Renyi growth mechanism [1] and a Internet- like network, I-net, grown on a mechanism which couples Preferential Attachment [2] to Triad Formation [3], as proposed in [4]. Example of a R-net The Erdos-Renyi model is a random graph generation model that produces graphs where the sticking probability of new nodes, in the growth mechanism, is independent on the node where the sticking is produced. In the resulting structure, nodes have approximately a similar

A new metric to describe the efficiency of data communication networks.

Elena Marchei1, Sandro Meloni2, Saverio Di Blasi1,Vittorio Rosato3,4

1 Ente per le Nuove Tecnologie, l’Energia e l’Ambiente (ENEA), Portici Research Center, Portici (Italy). 2 Dip.to Ingegneria Informatica, Università di Roma Tre, Via della Vasca Navale, Roma (Italy ). 3 Ente per le Nuove Tecnologie, l’Energia e l’Ambiente (ENEA), Casaccia Research Center, Roma (Italy) and 4 Ylichron Srl, Via Anguillarese 301, 00123 Roma (Italy).

elena.marchei@enea.it, saverio.diblasi@enea.it, sandro.meloni@gmail.com, rosato@enea.it

slide-2
SLIDE 2

FINAL WORKSHOP OF GRID PROJECTS “PON RICERCA 2000-2006, AVVISO 1575” 1

degree and the degree distribution is a poissonian distribution. Example of an I-net The Internet network has been established to display a topology which is far from being

  • random. It belongs to the class of “scale-free”

networks, where nodes with higher degree have stronger ability to grab links added to the

  • network. In the growth process, nodes with

higher degree have a larger probability to link with new nodes. This mechanisms produces a probability distribution of nodes P(k) ~ k-γ where γ is a constant whose value is typically in the range 2<γ<3. To better mimic the Internet topology, one must add to this mechanism a mechanisms called “triad formation” which allows to generate scale-free networks with a high clustering coefficient TRAFFIC-MODEL Each node of the network represents a router and it has a buffer of a limited size (in terms of number of packets which it can contain) able to host data packets waiting to be delivered; to a first approximation, buffers have equal size for all the nodes of the network. With a specific frequency, nodes send a small data packet which flows along the network via the shortest path (a fixed-path routing is primarily established to rule the packets path). They are hosted in the node’s buffer, if buffer contains previously arrived packets which must be handled with priority, or dispatched toward to next node if the buffer nodes is empty. Buffers, in fact, handle data packets with a FIFO (First-In-First-Out) policy. If a data packet arrives at a node whose buffer is full, it is dropped and, in a first approximation, it is lost. Simulations

  • f

data traffic have been performed by selecting a value λ measuring the traffic intensity: λ represents the frequency of emission of a new data packet by each node. λ = 0.1 will thus indicate that each node has a probability of 10% to generating, at each simulation time-step, a new data packet, directed towards a generic j node. NETWORK SIMULATOR NS2 AND ENEA-GRID NS2 is a discrete event simulator that together with its companion Nam, the Network Animator, form a very powerful set of tools for study

  • f

the real networks [www.isi.edu\nsnam\ns]. NS2 allows to study e.g. wired and wireless (local and satellite) networks; create various routing algorithms; traffic sources like web, ftp, telnet, cbr, stochastic traffic; failures, including deterministic, probabilistic loss, link failure; various queuing disciplines. When used in NS2, both R-net and I-net models have been designed with a propagation delay of 30ms (which could be representative

  • f the times of signal processing) and queues

type Drop-Tail, whose policy is to serve packets arriving with criterion FIFO (First In First Out) . Each node of the network is, at the same time, both source and destination. The couples source-destination time are generated in random way. We have used, as transport protocol, an agent connectionless UDP (User Datagram Protocol) and, as application traffic, a source with a rate constant CBR (Constant Bit Rate). Simulations of data traffic have been performed by selecting a value of the source rate λ as packets per second. To evaluate the network efficiency, we have used a unix script that allows us to launch several simulations on different Linux hosts of ENEA-GRID. Each job runs simultaneously in

slide-3
SLIDE 3

FINAL WORKSHOP OF GRID PROJECTS “PON RICERCA 2000-2006, AVVISO 1575” 1

batch mode. The input parameters, used to automatically vary source rate, change for each simulation. The output files are stored in a unique AFS (Andrew File System) volume and are visible from all hosts on which the distributed geographic file system is configured. In the custom traffic simulator, described in [4] we have designed a simple point-to-point connection mechanisms where packets are routed by a deterministic or a probabilistic routing protocol connecting shortest paths, still with a buffer FIFO policy. ANALISYS OF NETWORK’S EFFICIENCY Simulations have been performed by starting from empty networks. The results of Traffic- Model are then compared with the simulation results coming from the tool NS2. We have focussed our attention on different quantities related to the network function and

  • efficiency. The efficiency of the network to

sustain a given traffic will be estimated through the evaluation of the average delivery time <T> of data packets which is defined as follows: where ti is the delivery time of the effectively delivered i-th packet; Nd data packets are delivered out of the Ns packets effectively sent (the difference among these numbers is the total number of packets dropped because the limited buffer sizes). The Quality of Service (QoS), which accounts for both the delivery time and the number of packets which are dropped, can be defined as follows: where Tth is the minimum time needed, by a data packet, in average, to arrive from the

  • rigin node to the destination one.

ANALISYS OF PRELIMINAR RESULTS The first step of our work was to assess the qualitative correctness of the Traffic-Model to reproduce an effective TCP/IP data flow. We compared the results of Traffic-Model to those

  • btained by using NS2 tool which resulted to

be qualitatively similar. In both the Traffic-Model and the NS2 tool, the network’s traffic undergoes a phase transition at certain λ values. Above a given threshold, the delivery times, both for Random network and Internet-like network (Appendix A), becomes increasingly large and, as consequence, the efficiency of the networks, the Quality of Service decreases (Appendix B). The future step is to use a new metric to individuate the onset of congestion transition. The idea is to evaluate a further quantity, referee to as “ node’s temperature ” which measures the effects of the traffic load that the node can sustain, let’s us call this quantity node’s temperature . At a given simulation time ti, we could define,

  • n each node, the following quantity:

where is the current number of packets in the node’s buffer; lB is the total length of the buffer; <∆Tj >

, (j = 1, nB) is the average

”age” of the packets contained in the node’s buffer, and Tth is the minimum time needed, in average, to arrive from the origin to the destination nodes. The value is able to capture the state of node’s congestion: if .≈ 0, the node is a in a ”unstressed” state (buffer empty), while > 1 indicates a buffer almost full and the network begins to be in the congestion phase. We can say that the simulations performed with the NS2 tool assessed the quality of the proposed model which has been, in first

slide-4
SLIDE 4

FINAL WORKSHOP OF GRID PROJECTS “PON RICERCA 2000-2006, AVVISO 1575” 1

approximation, used to calculated the node’s temperature. A first result by simulating the Internet-like network, is shown in the figure below:

  • Fig. 1:

Variation

  • f

the efficiency mean temperature of the Internet-like network as a function of packet emission λ for the Traffic-Model.

The analysis of average temperature <Θ> shows the network behavior: for 0 <<Θ> <1 the network is in the free flow state and <Θ>> 1 the network is in the congestion state. We can say that the node's temperature is a clear indicator of the network status. The next step will be to use <Θ> to implement new adaptive routing strategies able to prevent (or delay) the congestion transition. REFERENCES [1] P. Erdös, A. Rènyi, Publicationes Mathematicae 6 (1959) 290 [2] A.-L. Barabàsi, R. Albert, Science, 286 (1999) 509 [3] P. Holme, B.J.Kim, Phys. Rev. E 65 (2002) 026107 [4] V. Rosato, L. Issacharoff, S. Meloni, D. Caligiore, F. Tiriticco, Physica A 387 (2008) 1689 APPENDIX A AVERAGE DELIVERY TIME

0,001 0,01 0,1 1 λ 1 10 100 1000 10000 <T>

  • Fig. 2-Traffic-Model: Variation of average delivery

time as a function of the rate of packet emission λ for Random network. Data are in log-log scale.

1 10 100 1000 λ 0,1 1 <T>

  • Fig. 3-NS2: Variation of average delivery time as a

function of the rate of packet emission λ for Random

  • network. Data are in log-log scale.

1e-05 0,0001 0,001 0,01 λ 1 10 100 1000 10000 <T>

  • Fig. 4-Traffic-Model: Variation of average delivery

time as a function of the rate of packet emission λ for Internet-like network. Data are in log-log scale.

slide-5
SLIDE 5

FINAL WORKSHOP OF GRID PROJECTS “PON RICERCA 2000-2006, AVVISO 1575” 1

1 10 100 1000 λ 0,1 1 10 100 <T>

  • Fig. 5-NS2: Variation of average delivery time as a

function of the rate of packet emission λ for Internet- like network. Data are in log-log scale.

APPENDIX B QUALITY OF SERVICE

0,001 0,01 0,1 1 λ 10

  • 4

10

  • 3

10

  • 2

10

  • 1

1 QoS

  • Fig. 6-Traffic-Model: Variation of the Quality
  • f service as a function of the rate of packet

emission λ for Random network. Data are in log-log scale.

1 10 100 1000 λ 0,01 0,1 1 QoS

  • Fig. 7-NS2: Variation of the Quality of service

as a function of the rate of packet emission λ for Random network. Data are in log-log scale.

1e-05 0,0001 0,001 0,01 λ 10

  • 4

10

  • 3

10

  • 2

10

  • 1

1 QoS

  • Fig. 8-Traffic-Model: Variation of the Quality
  • f service as a function of the rate of packet

emission λ for Internet-like network. Data are in log-log scale.

1 10 100 1000 λ 0,001 0,01 0,1 1 QoS

  • Fig. 9-NS2: Variation of the Quality of service

as a function of the rate of packet emission λ for Internet-like network. Data are in log-log scale.