
SLIDE 1
2014-5-27 Takanori Nakano
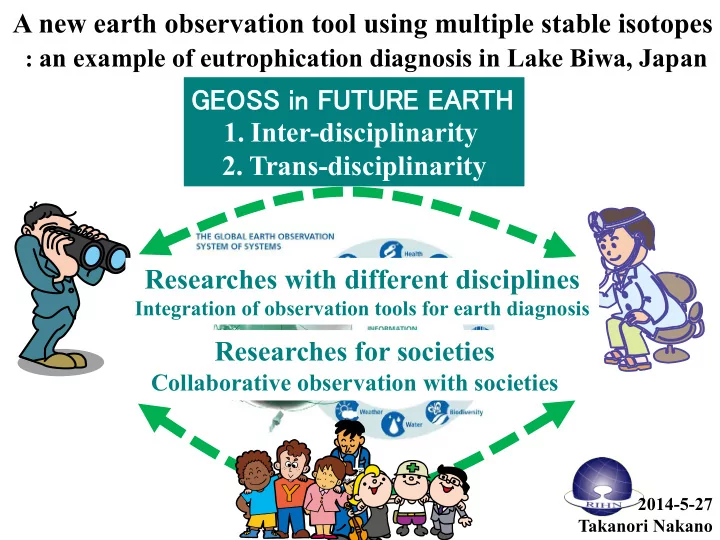
A new earth observation tool using multiple stable isotopes : an example of eutrophication diagnosis in Lake Biwa, Japan
西条市役所
環境衛生課GEOSS in in F FUTURE EARTH
- 1. Inter-disciplinarity
- 2. Trans-disciplinarity
Researches with different disciplines
Integration of observation tools for earth diagnosis
Researches for societies
Collaborative observation with societies