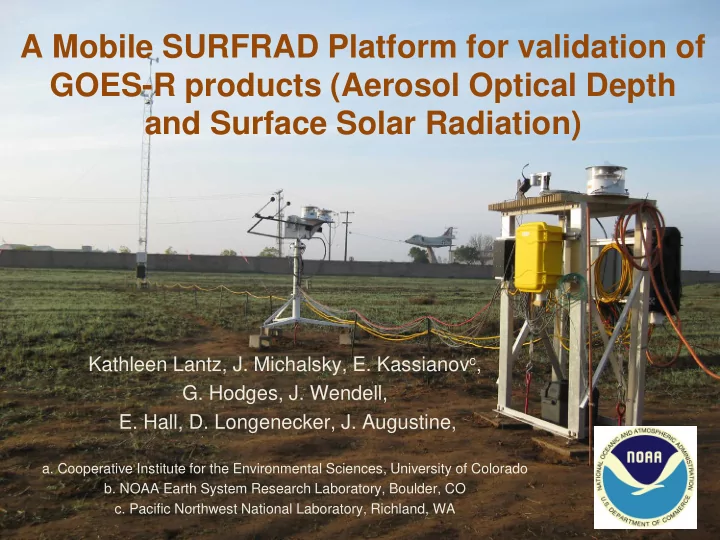
SLIDE 1 A Mobile SURFRAD Platform for validation of GOES-R products (Aerosol Optical Depth and Surface Solar Radiation)
Kathleen Lantz, J. Michalsky, E. Kassianovc,
- G. Hodges, J. Wendell,
- E. Hall, D. Longenecker, J. Augustine,
- a. Cooperative Institute for the Environmental Sciences, University of Colorado
- b. NOAA Earth System Research Laboratory, Boulder, CO
- c. Pacific Northwest National Laboratory, Richland, WA
SLIDE 2 Outline
- Description of instruments and measurement
products on the mobile-SURFRAD platform
- Where we’ve been and where we are going with our
mobile SURFRAD platform
- Overview of NASA DISCOVER-AQ
- Preliminary results from DISCOVER-AQ
- What we would like to accomplish now and in the
future with our mobile platforms
SLIDE 3 NOAA SURFRAD Network
On going, high quality surface radiation and aerosol
- bservations are necessary for
addressing climate research, air quality, and renewable energy. A mobile SURFRAD platform has been built and tested to address local and regional scale research to augment our longer term network. SURFRAD (Surface Radiation Budget Network) Mission Statement: Provide accurate, continuous, long-term measurements of the Surface Radiation Budget (SRB) in different representative climatic regions.
SLIDE 4 Instrumentation suite on table (in-coming):
- Global solar – Sum and Precision Spectral Pyranometer (PSP)
- Diffuse solar – blocked 8-48 Pyranometer on tracker
- Direct solar – Normal Incidence Pyrheliometer (NIP)
- Thermal Infrared – Precision Infrared Radiometer (PIR)
- Spectral total, direct, diffuse irradiance – MFRSR
(415, 500, 615, 673, 870. 940, 1625 nm)
- Aerosol Properties – MFRSR
- Cloud fraction – Total Sky Imager (TSI)
Instrumentation suite on tower (out-going):
- Upwelling Solar - PSP
- Upwelling Thermal Infrared - PIR
- Spectral surface albedo – MFR*
- Wind, temperature, pressure, RH
* m-SURFRAD and Table Mountain site only
PIR Blocked 8-48 NIP MFRSR Total Sky Imager Precision spectral pyranometer (PSP) 10 m Tower Tracker
SURFRAD Measurements
SLIDE 5 GOES-R Launch : Geostationary Environmental Operational Satellite for more timely and accurate weather observations and forecasts. GOES-R is scheduled for launch in 2015 into the GOES-West position. GOES-R Improvements: The Advanced Baseline Imager (ABI).
- 3 times more spectral information
- 4 times the spatial resolution
- > 5 times faster temporal coverage
GOES-R Overview
GOES-R Baseline Products: Aerosol Optical Depth (AOD) Surface Downward SW Radiation GOES-R Option 2 Products: Surface Downward LW Radiation Surface Upward LW Radiation Surface Albedo Vegetation Index Green Vegetation Fraction Aerosol Particle Size
Partners: NOAA/NESDIS/STAR: Itsvan Lazslo, Shobha Kondragunta
SLIDE 6
Mobile SURFRAD Platform Deployments
Recent Campaigns: DOE ARM TCAP; Cape Cod, MA, July 2012 – August, 2012. NASA DISCOVER-AQ, Central Valley, CA; January – February, 2013 Upcoming: NASA DISCOVER-AQ, Houston, TX; January – February, 2013 DOE-NOAA Solar Forecasting Project, NCAR Team, Xcel Electric, San Luis Valley, CO DOE-NOAA Solar Forecasting Project, IBM Team, Tuscon Electric, Tuscon, AZ
SLIDE 7 DISCOVER-AQ A NASA Earth Venture program funded mission PI(s): James Crawford and Ken Pickering Deriving Information on Surface Conditions from Column and Vertically Resolved Observations Relevant to Air Quality. SITES: 2010: Baltimore, MD 2013: Central Valley, CA 2013: Houston, TX 2014: TBD (Denver/Atlanta?)
DISCOVER-AQ Science Mission
Courtesy of J. Crawford Team
OVERVIEW: Main Objective: Improve air quality information derived from satellites using a comprehensive set of measurements on aircraft and on the ground that measure in-situ, column, and vertically resolved quantities. (20 Ground sites, 12 Flights (PB-3 and
B200)
SLIDE 8 Assessment: Worst O3, short- term particulate, and long-term particulate. U.S. Cities:
- 1. Bakersfield-Delano, CA
- 2. Los Angeles-Riverside, CA
Phoenix, AZ Porterville, CA
- 3. Hanford, CA
- 4. Fresno, CA
- 5. Pittsburgh, PA
- 6. Birmingham, AL
- 7. Cincinnati, OH
- 8. Louisville, KY
- 9. Modesto, CA
U.S. Most Polluted Cities Year-round:
American Lung Association 2011 DISCOVER-AQ Central Valley Motivation
SLIDE 9 415 nm 500 nm 670 nm 614 nm 870 nm
Asian Dust
SURFRAD AOD Climatology MODIS AOD
Augustine et al., 2009
Ruiz-Arias et al., 2013
Main point: SURFRAD AOD climatology show larger AOD in the eastern U.S than the western US, where MODIS AOD shows the opposite. Question: What are the causes for these differences in AOD between satellite calculations and ground-based column measurements?
SLIDE 10 Main point: Correlations between MODIS AOD and surface PM2.5 vary widely across the U.S. with poorer correlations being more typical in the west. Question: What are the causes for the poorer correlations in the west? Credit: IDEA Team, http://www.star.nesdis.noaa.gov/smcd/spb/aq/
Correlation – MODIS AOD and surface PM2.5
SLIDE 11 Correlations between Satellite and Ground-based AOD and PM2.5
Correlations between Satellite AOD, ground-based AOD, and PM2.5 depend on several key factors:
- Relative Humidity (RH)
- Planetary Boundary Layer Height (PBL)
- Aerosol size and composition (coarse/fine; chemical composition)
- Most satellites can’t distinguish between aerosols close to the
ground and higher in the atmosphere
- Bright surfaces such as snow and desert sand
- Clouds can obscure the view
References: Hoff R. and Christopher, S. (2009); Remote Sensing of Particulate Pollution form Space: Have we reached the promise land?, J. Air Waste Man. Assoc., 59, 645-675 [and references therein]. Engel-Cox, R. Hoff, A.D.J. Haymet (2004), Recommendations on the Use of Satellite Remote Sensing Data for Urban Air Quality, J. Air Waste Man. Assoc., 54, 1360-1372. Green M., S. Kondragunta (2012), Comparison of GOES and MODIS AOD to AERONET AOD and IMPROVE PM2.5 mass at Bondville, IL, J. Air Waste Man. Assoc., 54, 1360-1372.
SLIDE 12
Two Air-Pollution Events
Event 1: Peak January 21, 2013 Event 2: Peak February 4, 2013
Question: What is different about these two pollution events?
SLIDE 13 Aerosol Optical Properties during two pollution events
Event 1: Peaks around January 21, 2013 Event 2: Peaks around February 4, 2013
MFRSR aerosol retrieval references:
- E. Kassianov, et al, Retrieval of aerosol microphysical properties using surface Multi-Filter Rotating Shadowband Radiometer
(MFRSR): Modeling and observations, J. Geophys. Res. 2005.
- E. Kassianov, et al., Aerosol single-scattering albedo and asymmetry parameter from MFRSR observations during the ARM
aerosol IOP 2003, Atmos. Chem. Phys., 2007.
- J. Michalsky et al., Comparison of UV-RSS spectral measurements and TUV model runs for clear-sky for May 2003 ARM IOP,
- Atmos. Chem. Phys., 2008.
SLIDE 14 Air Pollution events
Summary: A closer look at the aerosol properties during the second pollution reveals interesting diurnal changes. The SSA and g are decreasing indicating less scattering (more absorbing) aerosol and smaller aerosols as the day progresses. Changes in the size distribution show a decrease in the coarse mode compared to the fine mode as the day progresses. Diurnal changes in aerosol properties may reflect changes in relative humidity or aerosol type/composition. Preliminary comparisons between SURFRAD MFRSR and AERONET CIMEL retrievals (AOD, ωo and g) show they agree within the uncertainty of the measurements.
Pollution Event 2: Aerosol Optical Properties
SLIDE 15
FUTURE: Evaluate satellite radiation products with SURFRAD radiation products (e.g. SW up-welling radiation, Surface albedo, NDVI). Evaluate correlation between AOD SURFRAD, AOD MODIS, and PM2.5 (e.g daily average and at different times of day, with respect to aerosol optical properties, aerosol composition, transport, relative humidity, boundary layer height). Evaluate effect of changes in ground spectral albedo and NDVI on correlation of satellite derived radiation products and aerosol optical properties and with SURFRAD products. Calculate aerosol properties (e.g. AOD, spectral aerosol single scattering albedo, asymmetry parameter, size distribution) and compare and evaluate with respect to co-located ground and aircraft measurements of in-situ and the column, e.g AERONET SSA, nephelometer, aerosol composition. Calculate aerosol direct radiative forcing (DRF) (MSRSR aerosol microphysical properties and surface radiation budget measurements (SRB)).
What’s Next?
SLIDE 16
Future Deployments
Recent Campaigns: DOE ARM TCAP; Cape Cod, MA, July 2012 – August, 2012. NASA DISCOVER-AQ, Central Valley, CA; January – February, 2013 Upcoming: NASA DISCOVER-AQ, Houston, TX; September, 2013 DOE-NOAA Solar Forecasting Project, NCAR Team, Xcel Electric, San Luis Valley, CO DOE-NOAA Solar Forecasting Project, IBM Team, Tuscon Electric, Tuscon, AZ
SLIDE 17 Acknowledgements
Pictured: Gary Hodges, Kathy Lantz, Emiel Hall Not Pictured: Joe Michalsky, E. Kassianov, Jim Wendell, Dave Longenecker, John Augustine
Thank you
SLIDE 18 Pollution Event 1
SURFRAD AOD MFRSR
AOD is significantly larger in event 2 (compared with PM2.5). Note AOD scale changes from 0.4 to 1.2 from top to bottom. The Angstrom coefficient increases from pollution event 1 to event 2 from 1.3 to 1.6. This indicates larger particles in pollution event 1.
Pollution Event 2
SURFRAD AOD SURFRAD AOD
SLIDE 19
Correlation – SURFRAD AOD and surface PM2.5
Previous literature correlations of PM2.5 and AOD range from 0.4 – 0.98 [Hoff and Christopher, 2008]. Correlations improve significantly when taking into account RH and PBL height.
SLIDE 20 Spectral Surface Albedo NDVI - Normalized Difference Vegetation Index
Normalized Difference Vegetation Index – A simple indicator of live green vegetation and to monitor plant growth. Spectral Surface albedo –
SLIDE 21
Beijing, Jan 13, 2013
SLIDE 22 Courtesy of H. Kim, S. Chou, C. Parworth, Q. Zhang, UC Davis
Fresno-Garland Site Chemical Composition from UC Davis
SLIDE 23
Earth’s Energy Budget
Surface Radiation Budget (White boxes)
SLIDE 24
GOES-R and Ground-based MFRSR wavelength bands
GOES-R Bands MFRSR Bands
415, 500, 615, 673, 870, 940, 1625 n
SLIDE 25 DISCOVER-AQ SCIENCE OBJECTIVES
Science Objective 1: Relate column observations to surface conditions for aerosols and key trace gases. Expected outcome: Improved understanding of the extent to which column
- bservations (as observed from space) can be used to diagnose surface conditions.
Science Objective 2: Evaluate the influence of emissions, relative humidity, boundary layer height and mixing, synoptic transport, and chemistry on surface and column measurement correlations. Expected outcome: Improved understanding of meteorology and chemistry as it influences the interpretation of satellite observations for testing and improving models. Science Objective 3: Examine horizontal scales of variability affecting satellites and model calculations Expected outcome: Improved interpretation of satellite observations in regions of steep gradients, improved representation of urban plumes in models, and more effective assimilation of satellite data by models
DISCOVER-AQ Science Objectives
SLIDE 26
PB-3 and B200 Aircraft Aerosol Measurements
SLIDE 27
Ground-Based Aerosol measurements
NASA Aeronet – Cimel sunphotometer Millersville, University – tethered balloon PM2.5 Penn State NATIVE – Aerosol Lidar NASA GSFC - Pandora AOD
SLIDE 28
SLIDE 29 Participants
http://discover-aq.larc.nasa.gov/
SLIDE 30 TCAP Campaign: Two Column Aerosol Project A DOE Atmospheric Radiation Measurement (ARM) program funded mission PI(s): Larry Berg, Richard Ferrare, Chris Hostetler SITE: Cape Cod, MA DATES:
Ground-based: July 2012 – June 2013 Flights: Summer 2012 and Winter 2013
TCAP Campaign
Do diurnal aerosol changes affect daily average Radiative Forcing (as measured during TCAP)? E. Kassianov et al., 2013.
SLIDE 31 PM2.5 – Primary, Annual < 12 μg/m^3, Annual arithmetic mean, average over 3 years PM2.5 – Secondary, Annual < 15 μg/m^3, Annual arithmetic mean, average over 3 years PM2.5 – P/S, 24-hour < 35 μg/m^3, 98th percentile, average over 3 years PM10 – P/S, 24-our < 150 μg/m^3, Not to exceed more than once per year on avg over 3 yrs
PM Standards
SLIDE 32
DISCOVER-AQ Central Valley Motivation NASA/GSFC Giovanni Visualization of AirNow PM2.5 Data, Jan-Feb, 2007. Main point: PM2.5 is typically very high over the San Joaquin Valley, CA and is highest in the winter in this region.
SLIDE 33
- Surface radiation budget (SRB)
- Global, direct, and diffuse downwelling SW (incoming)
- Downwelling LW radiation (incoming)
- Total, direct, and diffuse spectral solar irradiance (415, 500, 673, 870, 940,
1625 nm)
- Up-welling SW and LW radiation (out-going)
- Up-welling spectral solar irradiance (out-going)
- Photosynthetically active radiation (PAR), UVB Radiation*
- Aerosol Properties (415, 615, 675, 870, 940, 1625 nm)
- Spectral aerosol optical depth (τor AOD)
- Aerosol Angstrom Coefficient (Å)
- Aerosol Size Distribution
- Aerosol single scattering albedo (ω0 or SSA), Asymmetry parameter (g)
- Spectral Surface albedo (i.e. mobile SURFRAD, Table Mountain, CO)
- Normalized Difference Vegetation Index (NDVI)
- Meteorology – Temperature, Pressure, RH, wind speed/direction
SURFRAD Products