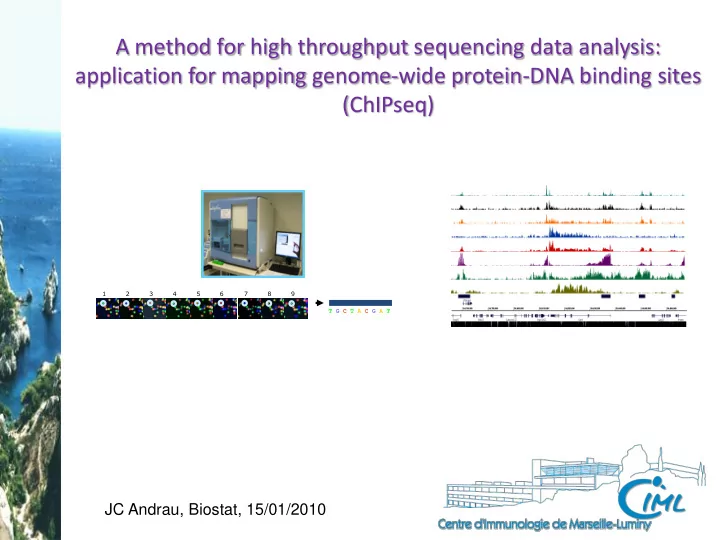

A method for high throughput sequencing data analysis: application for mapping genome-wide protein-DNA binding sites (ChIPseq) 1 2 3 4 5 6 7 8 9 T G C T A C G A T JC Andrau, Biostat, 15/01/2010
High thoughput sequencing applications Human gene mapping Genome Qualitative (SNP) and quantitative (amplification) genetic variations sequencing de novo sequencing of model organisms and pathogens Identification and analysis of non coding RNAs (miRNA, etc.) Transcriptome Monitoring gene expression in covering all the alternative (RNAseq) messengers to a given locus in a variety of contexts Epigenetic marks mapping and identification of regulatory sequences of gene Protein-DNA expression (ChIP-seq) interaction
ChIP-seq: Solexa procedure PCR + size exclusion (gel extraction) Loading in flowcell and cluster amplification Image acquisition and base calling
Sequencing and alignment • Sequencing extremities of DNA fragments • RAW data files (sequences) • Aligned against a reference genome – MAQ – Solexa…
First steps of data analysis
First steps of data analysis
DNA fragments VS sequences • Only extremities of DNA fragments are sequenced Binding Site • Enriched regions don’t represent exact binding site • In-silico process to elongate the tags + Strand - Strand
Elongation process Overlap Strand + Strand - Shifting (bp)
Score per nucleotide
Score per nucleotide
Further analysis
Artefacts removal and normalisation • An input experiment helps to localize problematic regions in alignment (duplications, reference genome…) – We shouldn’t see enrichment in input – These regions were removed from all datasets • Based on the average of the scores in the whole genome, we can estimate the BG level and then rescale all experiments according to this level • Last step consists of subtracting the input from the datasets in order to reduce the variations effects and the background in the data
Pipeline for ChIPseq data Analysis Artefact and multiple matches Conversion to gff format in R removal - ChIP, QCs, sequencing and original file genesis - Alignment against a reference genome (Eland) Data analysis and visualisation Elongation of tags, merge of Input or mock data set substraction, both strands and data bining data normalisation
ChIPseq and ChIP-on-Chip
CTD phosphorylations and transcription The CTD is a heptapeptide repetition ( Y S P T S P S)n of the largest Pol II subunit conserved from yeast (26x) to human (52x). ? Recruitment Initiation Elongation (productive)
TSS profiling of CTD and S5P overlaps with sense/antisense transcription Pol II Binding around TSSs Binding level Core et al, Science 2008
Clustering indicates several populations of initiating Pol II around TSS K mean clustering of top 20% Pol II S5-P 1 1 2 3 4 2 Right to 3 TSS 4 5 5 6 7 Centered 6 7 8 9 10 8 Left to 9 TSS 10
Many thanks to… PF lab, CIML Marseille Romain Fenouil Fred Koch Pierre Cauchy Pierre Ferrier CNG Evry Ivo Gut Marta Gut GSF Cancer Institute, Munich Dirk Eick Martin Heidemann Corinna Hintermair
Recommend
More recommend