
SLIDE 1
1 1
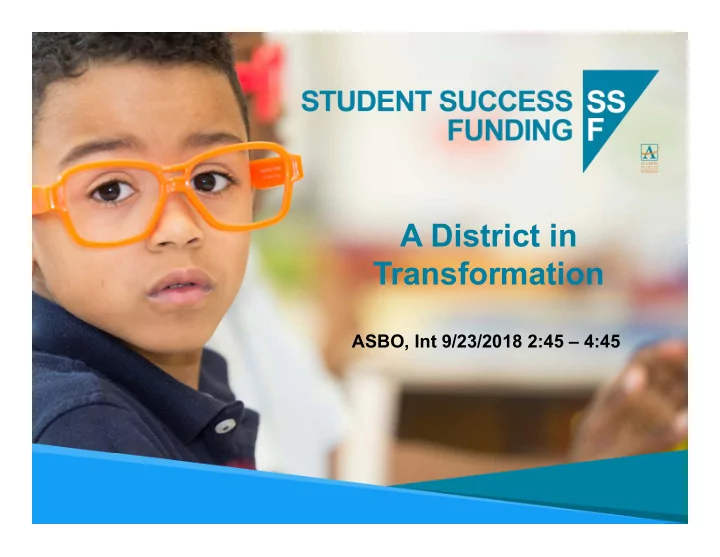
A District in Transformation
ASBO, Int 9/23/2018 2:45 – 4:45
A District in Transformation ASBO, Int 9/23/2018 2:45 4:45 1 1 - - PowerPoint PPT Presentation
A District in Transformation ASBO, Int 9/23/2018 2:45 4:45 1 1 Agenda Introductions Student Based Budgeting Overview of Atlanta Public Schools Identifying the Issue Finding a Solution Implementation
1 1
A District in Transformation
ASBO, Int 9/23/2018 2:45 – 4:45
2 2
Agenda
3 3
Introductions
Lisa Bracken Chief Financial Officer Atlanta Public Schools Betty Chang Manager Education Resource Strategies, ERS
4
your district? Three topics to cover today:
5
ERS is a national non-profit that partners with district, school, and state leaders to transform how they use resources (people, time, and money) so that every school prepares every child for tomorrow, no matter their race or income.
6
First thing to know is that SBB goes by many names
Across districts, we’ve seen:
New DOE pilot calls it:
SBB
7
Districts implement SBB to improve funding equity, transparency, and flexibility
The staffing process is antiquated and there is no transparency about who gets what and why. The district does not treat all school equally and struggles with equity. Some schools are given extra funding and positions. We still have too much of the haves and have not situation with how things are given out or allocated. Things we often hear from school leaders before SBB:
8
Flexibility/School Empowerment School leaders define the resources they need to drive student achievement “Principals own their budgets”
SBB is a different way of funding schools
Equity Resources are distributed equitably based on student need “Dollars follow the student” Transparency Clear and easily understood rules for where, how, and why dollars flow “The formula tells you what you get”
8
9
Traditional School Budgeting: The central office decides how much funding schools receive and how the funding is spent.
9
But, how is SBB different than how schools are traditionally funded?
Traditional School Budget: Staff 40 teachers 3 Assistant Principals 2 Counselor 1 Secretary Etc … Non-Staff $15,000 for instructional supplies $5,000 for athletic supplies Etc …
Note: This simplified example is provided for illustration only. Numbers shown are not intended to reflect recommended weights or budgets for schools.
10
Enrollment Weight Total All students 750 1.0 = $4,250 $3,187,500 Below Proficient 400 0.10 = $425 $170,000 Economically Disadvantaged 550 0.05 = $212 $116,600 ELL 200 0.20 = $850 $170,000
TOTAL : $3,644,100
SBB Allocation for Example School A:
Schools receive $s, not staff and programs
10
Under SBB, districts develop a formula that determines how much funding each school receives based on its enrollment and student need…
Note: This simplified example is provided for illustration only. Numbers shown are not intended to reflect recommended weights or budgets for schools.
11
FTEs Avg Salary Total Classroom Teacher 42.0 $60,000 $2,520,000 Assistant Principal 2.0 $80,000 $160,000 Stipends for Teacher Leaders 5 $8,000 $40,000 Etc…
TOTAL : $3,644,100
11
… and school leaders, supported by central office, decide how to spend those dollars to best meet student needs SBB Budget for Example School A:
Additional funding for my below proficient students allowed me to purchase two additional teacher FTEs and lower class sizes to 18 in 9th grade ELA and Math…
... I also moved to a distributive leadership model in my school so I spend less
assistant principals), and more on stipends for my teacher leaders. I’m also considering….
Note: This simplified example is provided for illustration only. Numbers shown are not intended to reflect recommended weights or budgets for schools.
12
Over the past decade, ERS has supported 12 systems in the design and implementation of SBB
Current State Work Past State Work Current District Work Past District Work Past or current SBB work
Atlanta Denver Prince George’s County Baltimore Indianapolis Rochester Boston Nashville Santa Fe Cleveland Newark Shelby County
13 13
APS by the Numbers
14 14
15 15
16 16
Operating Models
notify the Ga DOE that it would operate as:
17 17
Charter System
Supporting school and cluster neighborhood strategic plans
Cluster plans align instructional programming across schools and define the future direction of each neighborhood
the implementation of a signature program (International Baccalaureate, STEM, and College & Career Prep)
OUR OPERATING MODEL
18 18
Charter System Basics
Being a Charter System gives APS and our schools freedom to try new ideas with flexibility from state education rules to student achievement.
District-wide Innovations
Central office will work on improving systems, resources, talent management, support to schools, etc.
School Innovations
Schools and Go Teams (Local School Governing Teams @APS) will work on designing solutions that fit the school’s specific needs.
19
Flexibility & autonomy are means to an end, not ends themselves…
If we… Build the capacity of school-based leadership teams and empower them… So that… We will be positioned to achieve our mission of ensuring
ready for college & careers. Then… They will make decisions that best meet the needs of their unique school communities…
Schools must look and feel different as a result of flexibility & autonomy if we expect the strategy to produce different outcomes for students
20 20
A good allotment model should…
21
Funding systems like SSF can help districts accomplish greater:
Flexibility School leaders define the resources they need to drive student achievement “Principals own their budgets” Equity Resources are distributed equitably based on student need “Dollars follow the student” Transparency Clear and easily understood rules for where, how, and why dollars flow “The formula tells you what you get”
22 22
24 pages include:
23 23
Challenge: Transparency
Sometimes written in “our language”… Or doesn’t answer “why?” or “so? How much do I get?”
24 24
While there is flexibility in
allocations are used as earned and flexibility is not exercised to it’s fullest extent.
25 25
Challenge: Equity…
School A School B One additional K teacher, One additional K para, One additional clerk, one additional AP = School B earns an additional $282,000
Enrollment School A School B Gr KDG 125 126 Gr 01 131 131 Gr 02 135 135 Gr 03 140 140 Gr 04 140 140 Gr 05 128 128 Total 799 800
799 students 800 identical students
Per Pupil School A= $7,891 Per Pupil School B= $8,234
26 26
Challenge: Equity 2…
School A School B One Principal, One Assistant Principal, One Secretary, One Clerk, and One Media Specialist Per School= $454,331
Enrollment School A School B Gr KDG 111 71 Gr 01 118 51 Gr 02 134 55 Gr 03 131 64 Gr 04 129 74 Gr 05 107 46 Total 730 361
730 students 361 identical students Difference of 369 students
“One Per” per pupil = $622 “One Per” per pupil = $1,259
27 27
Challenge: Equity 3…
School A School B
Enrollment School A School B Gr KDG 126 126 Gr 01 131 131 Gr 02 135 135 Gr 03 140 140 Gr 04 140 140 Gr 05 128 128 Total 800 800
100% FRL, Below 60% CCRPI High population of ELL, High Mobility
28 28
Equity Challenge #4- Ad-hoc exceptions
“Squeaky wheels” Principals advocate for the resources to support new initiatives on an ad hoc basis Rolling over old structures Starting staffing & budgeting processes with whatever the district did last year
29 29
The result of these challenges is that funding levels vary across schools
$- $2,000 $4,000 $6,000 $8,000 $10,000 $12,000 $14,000 $16,000
$pp
$pp by school
$pp School Level Median Median $10.4K Max=1.8x Min Median $9.9K Max=1.9x Min Median $9.0K Max=1.5x Min
30 30
And that variance is not tightly aligned with student need
$0 $2,000 $4,000 $6,000 $8,000 $10,000 $12,000 $14,000 $16,000 0.1 0.2 0.3 0.4 0.5 0.6
$pp Need Index*
$pp versus school need
* Need index represents the additional funding districts typically spend on students in poverty, English language learners and students with disabilities.
Schools with a similar need index range in funding from $7.4k to $14.8k
31 31
32 32
SSF Taskforce
Taskforce includes 32 members
Systems
Additional Feedback from: Associate Superintendents Senior Cabinet Expanded Cabinet
33 33
Allotment Methods
34 34
What Student Weighted Funding is…
35 35
Might this be a good fit for APS?
36 36
37 37
What it’s not…
A voucher system A free‐for‐all
A methodology for what you DO with the funds
Magic
38 38
Dashboard
Weights:
Grade Level Performance Poverty Special Ed Special Ed Substitutes Core Teachers Facilities, Transportation, Utilities
What is in the allocation:
School Administration Fine Arts, PE, World Language
39 39
What do other’s include? (On/Off)
40 40
To lock or unlock?
41
41
Districts have opted to weight different student characteristics in their SBB formulas
Atlanta (SY1819) Baltimore (SY1718) Boston (SY1718) Cleveland (SY1718) Denver (SY1617) Indianapol is (SY1718) Nashville (SY1819) San Francisco (SY1718) Shelby County (SY1819) Poverty X X X X X X ELL X X X X X X SWD X X X X Grade Weight X X X X X X X Low Performance X X X X X X High Performance/ Gifted X X X X X Other Weights Dropout Prevention Mobility, Attendance SWD Supplies Mobility
42 42
Questions to Answer…
(Signature, Turnaround, etc)?
43 43
Student Success and Accountability
What do you measure when schools are implementing so many differing initiatives? How do you measure it? When? Multiple years to determine success… Measuring student success…
44 44
45 45
Successful implementation requires a multi‐ faceted approach to school empowerment
School empowerment comes from deliberate alignment of autonomy, accountability & support. Past efforts nationally to improve outcomes through greater autonomy have failed because of inadequate or misaligned approaches to accountability & support
Autonomy Accountability Support
46
the fall for all principals during Expanded Cabinet
flexibilities that principals have, as well as regulations, guidelines, and best practices for how to use resources
allocations information, budgeting functionality, and embedded checks
central office support, including weekly communication memos, throughout the budget window
supportive, and less compliance‐oriented, meeting structure In preparation for the SSF transition, APS provided support to principals and central office staff in several ways:
47 47
Unlocked does not mean Complete Autonomy…
48 48
Common definitions:
Centralized/ “Hold Tight”
Areas with shared agreements and accountability; decisions are made and/or expectations set by district leadership.
Flexibility
Areas where freedom is provided for customization and differentiation in the implementation of district (and cluster) initiatives; “guardrails” set by district.
Autonomy
Areas where school based leadership teams have complete freedom to determine the approach that best meets the needs of their school communities.
Unlocked Locked
49 49
A Complete SSF Formula strikes a balance between Equity and Stability
Equity Stability
Stability Strategies:
level of services
year
50 50
With baseline supplement or transition strategy Greater stability means that a smaller portion of the pie goes towards equity‐ the dollars allocated through need‐based supplements and base funding No baseline supplement or transition strategy
Poverty ELL Special Education Performance Grade Level Base Weight Baseline supplement/Transition … Poverty ELL Special Educatio n Performance Grade Level Base Weight
Total Pool=$250M Equity: $250M Stability: $0 Total Pool=$250M Equity: $225M Stability: $25M
51 51
Baseline Services
Principal Assistant Principal Secretary Counselor Head Custodian Media Specialist School Clerk Nurse Social Worker (.2 ES, .4 MS/HS) ISS Monitor (MS and HS) Registrar (HS) Graduation Coach (HS) .5 Athletic Director (HS) Base Flex Allocation (1.0 Teacher salary) Additional Flex per pupil Cluster Funds Signature Funds Supplies per pupil Substitute Funds per teacher General Education Teacher Allotments (by grade level, rounded up for planning / extended core)
Grade Level Funding Level K-3 21 4-5 23 6-8 24 9-12 25
52 52
Transition Strategy
Gain Cap – 3.5% Loss Limits – 2.5% or no greater than 3.0 FTE
A Transition strategies ensures schools do not see large swings year over year (not subject to changes in enrollment) and creates a temporary cap on what percentage of per pupil funding a school can lose or gain in one year
Other strategies to offset losses include leveraging foundations, the Partnerships Office, special revenue and grant opportunities, etc. We are also recommending to allow schools to carryover 10-15% of their unused non-personnel allocations to the following fiscal year to offset future year losses or to accrue funds.
53
In FY19, APS increased transparency by budgeting 61% of all funds on school budgets, $256M of which was distributed through the SSF formula
SSF Allocation Overview: Total Allocation
56% 3% 41%
SY 2017-18
SY 2017-18 APS Allocations
Central and Centrally Managed Resources School Flow- Through Resources Resources on School Allotments
$379M $393M $256 M $137 M
40% 21% 39%
SY 2018-19
SY 2018-19 APS Allocations
Central and Centrally Managed Resources Allocated
("Locked") Allocated through SSF ("Unlocked")
Note: In FY19, all flow-through funds were allocated outside SSF or absorbed into central. $137M includes $4.5M in hold-backs for FY19 and funding for schools not funded through SSF Source: APS financial data SY 17-18 and SY 18-19, ERS Analysis
54
In addition to the $256M of unlocked resources, schools had flexibility in the use of some of the “locked” resources
SSF Allocation Overview: Total Allocation
“Unlocked” Resources $256M
Core teachers (including K) Extended core Principals/Aps School admin (including clerks, secretary, registrar, and program admin) Gifted Gen ed paras (including K and non-instructional) Counselors & social workers Graduation coaches Media specialists Athletic directors ISS Monitors New textbooks Substitutes Base, flex, cluster, and
“Locked” Resources $137M
EIP/REP teachers** Signature funds** Turnaround funds** Title funds** CTE positions ESOL positions SWD positions Nurses ROTC Custodians SROs Evening/summer school Schools not funded through SSF **Flexibility within resources exists, even though distributed outside of SSF formula
65% 35%
SY 2018-19
SY 2018-19 School Based Resources "Locked" Resources "Unlocked" Resources
Source: APS financial data SY 18-19, ERS Analysis
55
APS unlocked a higher percent of school recourses than comparison districts using SSF
SSF Allocation Overview: Total Allocation
40% 65% 59% 49% 74% 42% 21% 35% 41% 51% 26% 58%
39%
APS Total Budget 1819 APS School-based 1819 Cleveland 1516 Indianapolis 1718 Baltimore 1516 Shelby County 1819
Central Allocated
("Locked") Allocated through SSF ("Unlocked")
Walton FY18 Goal: 28% Atlanta FY1819 Resources
% of School resources distributed through SSF by district
*Locked includes allotments to schools not funded through SSF and special funds, such as Title, Turnaround, and other designated funds Source: APS financial data SY 18-19, ERS Analysis
56
Through engagement with an SSF taskforce and conversations with district leadership, APS landed on the following formula:
SSF Allocation Overview: Total Allocation
Distribution Total $ Description Student Weights
$246.7M
(96.3%)
Funds distributed through eight need-based weights:
1. Base weight $4,339/pp 2. Grade level $217-2,604/pp 3. Poverty $1,950-2,600/pp 4. Gifted Supplement $2,603/pp 5. Gifted $2,603/pp 6. Incoming Performance $216-433/pp 7. ELL $433/pp 8. Special Education $130/pp Small School Supplement
$5.5M
(2.1%)
Funds distributed through a weight to supplement small schools ($1,735/pp)
Dual Campus Supplement
$1.6M
(0.6%)
Supplements provided to schools who operate on two sites to fund additional associated costs
Baseline Supplement
$1.3M
(0.5%)
Supplements provided to schools whose allocation falls below a defined threshold based on the set of resources that a school needs in order to provide basic educational programming
Transition Cap Policy
$1.1M
(0.4%)
Supplements or withholdings based on the max that a school can gain or lose from one year to the next. In FY19, schools whose allocation exceeded a 2.5% loss or a 3.0% gain were capped.
Source: APS financial data SY 18-19, ERS Analysis
57
Of the $247M through weights, only $57M are towards weights that target student level needs
167.9 21.9 40.7 11.6 2.2 1.1 0.7 0.6 5.5 246.7 252.2 $0 $50 $100 $150 $200 $250 $300
Dollars Distributed through SSF Weights ($M) SSF Allocation Overview: Weights
Source: APS SY19 Financial data, ERS Analysis
Funds Targeting Student Need Funds Targeting Student Need
58
BUT….
Many equitable allocations remained locked for the first year including…
59
With a loss limit of 2.5%, and a gain limit of 3.5%, Atlanta’s transition policies are more conservative than other districts that recently implemented SSF
SSF Allocation Overview: Supplements & Caps
In Year 1 Loss Limit Gain Limit Atlanta 2.5% 3% Cleveland 10% 20% Nashville* 0% No limit Indianapolis 6% (or 2 FTE) 3% Memphis 5% 5% In Years 2+ Loss Limit Gain Limit Cleveland 10% 10% Nashville 3% 24% Indianapolis 6% 3%
*Nashville saw an increase in funding to ensure that no schools experienced a loss in the first two years
60
To what extent did SSF address equity challenges?
Drivers of Funding Inequity Status in SSF System “Magic” student allocations Issue mitigated
Per-school allocations Issue mitigated
Allocations based on only a subset of needs Issue mitigated
Other ad-hoc exceptions reward “squeaky wheel” and prioritize stability over equity Issue mitigated
magnitude of exceptions
supplements prioritize stability over equity
61
Summary
through the previous allotment formula
through the previous allotment formula
3.5%
62
Pre‐Work for Roll‐out
Superintendent to review every school budget
gaps were identified for each school
in Title I, losses in enrollment, and losses through SSF) and where instructional programs will be greatly impacted, additional review will be conducted by CFO and Deputy Superintendent
62
63
Elementary Schools: EXAMPLES
School Name Cluster Direct Cert FY2019 Projected Net Percentage Comments
Boyd Elementary School Douglass 84% 439 1.30% High poverty allocation Barack and Michelle Obama Academy Jackson 80% 236 ‐1.09% Very low enrollment Fain Elementary School Douglass 76% 446 ‐1.72% Benefited from "magic student" clerk, counselor allotment, and high cushions at most class sizes. Usher‐Collier Heights Elmentary School Douglass 73% 461 1.05% High poverty allocation Dunbar Elementary School Jackson 73% 376 0.43% Midline to high poverty + midline to low enrollment = minimal weighted attributes Towns Elementary School Douglass 72% 300 1.88% High poverty allocation Dobbs Elementary School South Atlanta 72% 455 1.03% Midline to high poverty + midline to low enrollment = minimal weighted attributes Scott Elementary School Douglass 72% 379 1.14% High poverty allocation Heritage Academy Elementary South Atlanta 72% 462 3.03% High poverty allocation Cascade Elementary School Mays 71% 365 1.02% High poverty allocation Peyton Forest Elementary School Mays 71% 521 2.15% High poverty allocation Finch Elementary Carver 71% 475 2.85% High poverty allocation Perkerson Elementary School Carver 70% 389 2.31% High poverty allocation Miles Intermediate Mays 70% 564 3.50% High poverty allocation
64
Elementary Schools : EXAMPLES
School Name Cluster Direct Cert FY2019 Projected Net Percentage Comments Deerwood Academy School Therrell 55% 683 3.42% High poverty allocation Parkside Elementary School Jackson 52% 580 0.86% High poverty allocation West Manor Elementary School Mays 52% 301 3.18% High poverty allocation Toomer Elementary School Jackson 49% 488 ‐2.50% Low poverty allocation Burgess‐Peterson Elementary School Jackson 41% 427 ‐2.50% Low poverty allocation Bolton Academy North Atlanta 39% 559 ‐0.60% Midline to low poverty + midline to high enrollment = minimal weighted attributes Garden Hills Elementary School North Atlanta 36% 480 ‐2.50% Low poverty allocation Rivers Elementary School North Atlanta 16% 772 ‐2.10% Low poverty allocation Smith Elementary School North Atlanta 9% 941 ‐1.62% Low poverty allocation Springdale Park Elementary School Grady 6% 724 ‐2.14% Low poverty allocation Brandon Elementary School North Atlanta 5% 1022 ‐2.50% Low poverty allocation Morningside Elementary School Grady 5% 964 0.42% Low poverty allocation offset by large enrollment; fell below the "magic student" threshold of 1000 (see Brandon) Lin Elementary School Grady 4% 670 ‐2.50% Low poverty allocation Jackson Elementary School North Atlanta 2% 670 ‐0.46% Low poverty allocation
65
Middle Schools : EXAMPLES
School Name Cluster Direct Cert FY2019 Projected Net PercentageComments Sylvan Hills Middle School Carver 72% 570 ‐0.67% Midline to high poverty + midline to low enrollment = minimal weighted attributes; benefited from "magic student" AP at 500 Harper‐Archer Middle School Douglass 71% 230 ‐2.50% High poverty allocation+ significantly declining enrollment John Lewis Invictus Academy Douglass 71% 644 3.50% High poverty allocation Young Middle School Mays 69% 873 3.50% High poverty allocation King Middle School Jackson 68% 779 3.46% High poverty allocation Brown Middle School Washingt
67% 502 ‐2.50% Midline to high poverty + midline to low enrollment = minimal weighted attributes; benefited from "magic student" AP at 500 Long Middle School South Atlanta 65% 759 0.18% High poverty allocation Bunche Middle School Therrell 59% 869 3.50% High poverty allocation Inman Middle School Grady 20% 1060 ‐2.50% Low poverty allocation Sutton Middle School North Atlanta 19% 1555 ‐2.48% Low poverty allocation
66
High Schools : EXAMPLES
School Name Cluster Direct Cert FY2019 Projected Net Percentage Comments Douglass High School Douglass 64% 930 2.36% High poverty allotment Booker T. Washington High School Washingto n 61% 722 ‐2.50% Midline to high poverty + midline to low enrollment = minimal weighted attributes Mays High School Mays 55% 1407 3.50% Midline to high poverty allotment + larger than average enrollment South Atlanta High South Atlanta 55% 850 ‐1.40% Midline to high poverty + midline to low enrollment = minimal weighted attributes Therrell High School Therrell 51% 846 ‐2.50% Midline to high poverty + midline to low enrollment = minimal weighted attributes Carver Early College High School Carver 46% 468 ‐2.50% Midline to low poverty + midline to low enrollment = minimal weighted attributes Maynard H. Jackson, Jr. High School Jackson 46% 1239 ‐1.59% Midline to low poverty + midline to high enrollment = minimal weighted attributes Grady High School Grady 20% 1346 ‐2.50% Low poverty allotment North Atlanta High School North Atlanta 16% 1936 0.55% Low poverty allotment offset by very large enrollment
67
Flexibility & autonomy are means to an end, not ends themselves…
If we… Build the capacity of school-based leadership teams and empower them… So that… We will be positioned to achieve our mission of ensuring
ready for college & careers. Then… They will make decisions that best meet the needs of their unique school communities…
Schools must look and feel different as a result of flexibility & autonomy if we expect the strategy to produce different outcomes for students
68 68
Moving Towards Equity, Balancing Stability
$- $2,000 $4,000 $6,000 $8,000 $10,000 $12,000
0.20 0.30 0.40 0.50 0.60 0.70 0.80 0.90
Per Pupil Challenge Index
Current Proposed Linear (Current) Linear (Proposed)
With the new model, you start to see school allocations moving closer to a midline based on the challenge index and you see a tilting of the lines towards a more equitable distribution where schools with the greatest challenge receive additional funds. The tilt is subtle due to the transition policy and because many “need-based” allocations such as ESOL, Special Education, and Turnaround are still outside of this funding formula and allocated on top of these base allocations.
69
The majority of principals reported making changes in order to differentiate student supports
Other changes reported include:
specialist, etc.)
37% 56% 30% 89%
Increased time for teacher collaboration and feedback Increased expert support for teacher coaching/feedback and meeting facilitation Increased time to support and develop expertise of instructional admin/expert support Changed structures to differentiate student supports (including changes to class size, student or teach load, or time spent in small, flexible groupings, etc.)
% Principals Reporting Changes Made to Support the Following Resource Priorities
Source: Post-Staffing Conference Principal Survey & CLL Survey, March 2018; ERS Analysis
70 70
71 71
Lessons Learned
72
It’s not just SSF!
Enrollment
FY2018 Levelling Hold‐Harmless
with small class‐size cushions were held‐harmless
were held‐harmless to a certain position loss limit
the allocation is being absorbed in FY2019
73
It’s not just SSF!
Title I
Holdback
pending revenue outcome
73
74
SSF is the How… not the What
decentralization, additional “switches” and “dials” are added to the dashboard
refine the tool
either “buy-back” those services from the central office or identify other ways to meet those needs
basis; mandatory fixed cost at CLL are then charged back to the departments
schools
to be maintained and distributed
75 75
Leveling
multiple sets of challenges
that decreased a prorated (hold-harmless) amount was taken
under SSF, they might have built their budgets differently (less “people- heavy”, a contingency budget, etc.)
76
Compared to similar questions in the fall, a post‐budget survey found principals had a clearer understanding of how their budgets were calculated, and rated support from CLL more highly
23% 44% 5% 41% 5% 70% 49% 52% 0% 41% 55% 23% 30% 0% 10% 20% 30% 40% 50% 60% 70% 80% 90% 100% Fall Winter Fall Winter Fall Winter
% of principal responses (N=39 fall, 27 winter)
Strongly Agree Agree I truly felt supported during this budgeting
had a questions, people went over an beyond to assist. My staffing conference was WONDERFUL....It truly felt supportive. I understood how my school’s allocation was impacted by the student need characteristics in my school, and why these changes were made to all schools When I needed support from central office, I was generally able to find the correct person and a resolve my question/issue within an appropriate time frame When working with multiple departments, I received consistent guidance and answers to help me
strategic priorities
Source: Post-Staffing Conference Principal Survey & CLL Survey, March 2018; ERS Analysis
77
And responses were similarly positive to additional questions we asked.
44% 41% 70% 52% 55% 30% 0% 10% 20% 30% 40% 50% 60% 70% 80% 90% 100%
I understood what flexibilities I had with my budget this year I understood what I was responsible for including in my budget this year I received timely responses to my questions from my Associate Superintendent
% of principal responses (N=27)
Strongly Agree Agree
The budgeting process was great. I like the new autonomy and flexibility with my budget and school program. The budget department along with HR assisted with immediate feedback and clarity.
Source: Post-Staffing Conference Principal Survey & CLL Survey, March 2018; ERS Analysis
78
CLL staff responses indicate a number of strengths in the budgeting process
20% 21% 27% 47% 57% 40% 0% 10% 20% 30% 40% 50% 60% 70% 80% 90% 100% For resources related to my department, I understood what flexibilities principals had with their budgets this year For resources related to my department, I understood what principals were responsible for including in their budget this year I was able to respond to principals’ questions in a timely manner (within 48- hours)
% of CLL responses (N=15)
Strongly Agree Agree The budget guidance document was a good idea. I believe the
conversations were very key to ensure alignment of thought process and data….it is easier to explain to someone else what has been thoroughly explained to you.
Source: Post-Staffing Conference Principal Survey & CLL Survey, March 2018; ERS Analysis
79
And also highlight areas for improvement around trust, support, and collaboration between CLL and principals
20% 7% 20% 20% 33%
0% 10% 20% 30% 40% 50% 60% 70% 80% 90% 100%
I was able to be a thought- partner to principals on challenges raised about resources related to my department Principals proactively reached
resources related to my department Most principals I interacted with were leveraging flexibilities responsibly and aligned to APS' theory of action
% of CLL Responses
Principals made certain decisions based on dollars versus looking at students and services required
Source: Post-Staffing Conference Principal Survey & CLL Survey, March 2018; ERS Analysis
[It would be great] if there was a way to implement a confirmation or spot check into the process Meetings with CLL staff and Principals would be helpful - there were few
in the work together [We should] conduct a training for associate sups to ensure their understanding of each area
80
What we’ve learned from a decade of supporting districts in implementing SBB:
2. Supporting principals around strategic school design is critical.
in how Central Office and schools engage with each
4. But change can happen and for many districts, the process of implementing SBB was transformative in and of itself.
81
Check out our Introductory Guide to help determine whether SBB is right for your district:
Our Intro Guide covers:
Action
Successfully Implement SBB
support SBB
82
Learn more at our SBB Toolkit! www.erstrategies.org/SBB
Guides
Implementing SBB Tools
SBB
83
www.erstrategies.org/signup @ERStrategies www.erstrategies.org
VISIT SUBSCRIBE LIKE + FOLLOW
84 84
Questions and Discussion
85 85
Appendix
86
Weights
Grade Level
class
“investments in Pre‐K through 3rd grade to ensure all students are reading by the end of 3rd grade.”
Prior Academic Performance:
beginning level on milestones from the 2016‐2017 school year applied to total enrollment –Middle, .10
86
87
Weights
Poverty:
2016‐2017 school year.
average 55%; 74% of schools above 50%
average 58%; 80% of schools above 50%; offset by higher weight in beginning performance
average 46%; 55% of schools above 50%; higher weight required to be impactful
87
88
Weights
English Language Learners: 2016‐2017 student record submission to the Georgia Department of Education
in addition to SSF Special Education: 2016‐2017 student record submission to the Georgia Department of Education
in addition to SSF
88
89
Weights
Gifted: (2016‐2017 student record submission to the Georgia Department of Education)
funds to continue existing gifted programs Gifted Supplement: (2016‐2017 student record submission to the Georgia Department of Education)
than 5%, gifted weight applied to the incremental enrollment up to 5%; ensures base funding so all schools can purchase a reasonable portion of a gifted allotment
89
90
Weights
Small School Supplement, .40: Schools below a certain threshold receive an additional weight applied to each incremental student between the schools enrollment and the threshold amount to ensure school viability in a per pupil allotment
90