
SLIDE 1
September 19, 2019
Fourth Quarter 2018
Financial Results
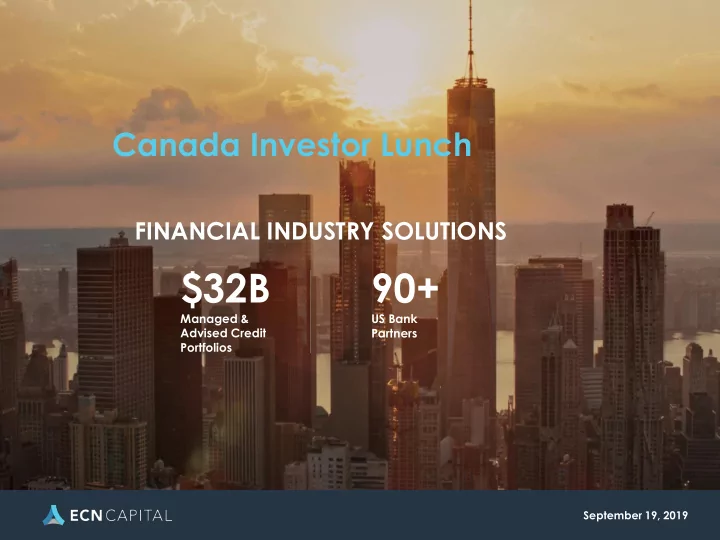
Canada Investor Lunch
FINANCIAL INDUSTRY SOLUTIONS
$32B
Managed & Advised Credit Portfolios
90+
US Bank Partners
90+ Managed & US Bank Advised Credit Partners Portfolios - - PowerPoint PPT Presentation
Fourth Quarter 2018 Canada Investor Lunch Financial Results FINANCIAL INDUSTRY SOLUTIONS $32B 90+ Managed & US Bank Advised Credit Partners Portfolios September 19, 2019 FINANCIAL INDUSTRY SOLUTIONS Disclaimer Certain information
September 19, 2019
Financial Results
Managed & Advised Credit Portfolios
US Bank Partners
Certain information in this presentation is forward-looking and related to anticipated financial performance, events and strategies. When used in this context, words such as “will”, “anticipate”, “believe”, “plan”, “intend”, “target” and “expect” or similar words suggest future outcomes. Forward-looking statements relate to, among other things, ECN Capital Corp.’s (“ECN Capital”)
capital expenditures; anticipated cash needs, capital requirements and need for and cost of additional financing; future assets; demand for services; ECN Capital’s competitive position; expected growth in originations; and anticipated trends and challenges in ECN Capital’s business and the markets in which it operates; and the plans, strategies and objectives of ECN Capital for the future. The forward-looking information and statements contained in this presentation reflect several material factors and expectations and assumptions of ECN Capital including, without limitation: that ECN Capital will conduct its operations in a manner consistent with its expectations and, where applicable, consistent with past practice; ECN Capital’s continued ability to successfully execute
the continued availability of adequate debt and/or equity financing and cash flow to fund its capital and operating requirements as needed; and the extent of its liabilities. ECN Capital believes the material factors, expectations and assumptions reflected in the forward-looking information and statements are reasonable but no assurance can be given that these factors, expectations and assumptions will prove to be correct. By their nature, such forward-looking information and statements are subject to significant risks and uncertainties, which could cause the actual results and experience to be materially different than the anticipated results. Such risks and uncertainties include, but are not limited to, operating performance, regulatory and government decisions, competitive pressures and the ability to retain major customers, rapid technological changes, availability and cost of financing, availability of labor and management resources, the performance of partners, contractors and suppliers. Readers are cautioned not to place undue reliance on forward-looking statements as actual results could differ materially from the plans, expectations, estimates or intentions expressed in the forward-looking statements. Except as required by law, ECN Capital disclaims any intention and assumes no obligation to update any forward-looking statement, whether as a result of new information, future events or otherwise.
FINANCIAL INDUSTRY SOLUTIONS
2
ECN Capital’s audited consolidated financial statements have been prepared in accordance with International Financial Reporting Standards (“IFRS”) as issued by the International Accounting Standards Board and the accounting policies we adopted in accordance with IFRS. In this presentation, management has used certain terms, including adjusted operating income before tax, adjusted operating income after tax, adjusted operating income after tax EPS and managed assets, which do not have a standardized meaning under IFRS and are unlikely to be comparable to similar measures presented by other organizations. ECN Capital believes that certain non-IFRS Measures can be useful to investors because they provide a means by which investors can evaluate ECN Capital’s underlying key drivers and operating performance of the business, exclusive of certain adjustments and activities that investors may consider to be unrelated to the underlying economic performance of the business of a given period. Throughout this presentation, management used a number of terms and ratios which do not have a standardized meaning under IFRS and are unlikely to be comparable to similar measures presented by other organizations. A full description of these measures can be found in the Management Discussion & Analysis that accompanies the financial statements for the quarter ended June 30,
SEDAR (www.sedar.com) and is available under the investor section of the ECN Capital’s website (www.ecncapitalcorp.com). This presentation and, in particular the information in respect of ECN Capital’s prospective originations, revenues, operating income, adjusted operating income, adjusted operating income EPS, and intrinsic value illustration may contain future oriented financial information (“FOFI”) within the meaning of applicable securities laws. The FOFI has been prepared by management to provide an outlook on ECN Capital’s proposed activities and potential results and may not be appropriate for other purposes. The FOFI has been prepared based on a number of assumptions, including the assumptions discussed above, and assumptions with respect to operating costs, foreign exchange rates, general and administrative expenses and expected originations growth. ECN Capital and management believe that the FOFI has been prepared on a reasonable basis, reflecting management’s best estimates and judgments, however, the actual results of operations of ECN Capital and the resulting financial results may vary from the amounts set forth herein and such variations may be material. FOFI contained in this presentation was made as of the date of this presentation and ECN Capital disclaims any intention or obligation to update or revise any FOFI contained in this presentation, whether as a result of new information, future events or otherwise, unless required pursuant to applicable law.
FINANCIAL INDUSTRY SOLUTIONS
3
4
INTRODUCTION SERVICE FINANCE TRIAD FINANCIAL SERVICES KESSLER GROUP CONCLUSION Q&A
4
FINANCIAL INDUSTRY SOLUTIONS
Presenter: Steve Hudson
FINANCIAL INDUSTRY SOLUTIONS
5
FINANCIAL INDUSTRY SOLUTIONS
6
wound down its legacy portfolio assets and invested in three asset light services companies
which it originates, manages and advises on prime credit portfolios for its bank customers (“Partners”)
assets that require highly specialized expertise, industry knowledge and relationships, which provide significant barriers to entry
FINANCIAL INDUSTRY SOLUTIONS
7
Value Add Solutions Provider to the US Financial Industry
diversifications
institutions on prime consumer assets
Large Identifiable Market Opportunity
institution customers – over 10k to target
Attractive Financial Profile – Visible Growth and Profitability
segments
Top Flight, At-Risk Management Team
rooted in specialty finance
High Barriers to Entry
to establish
+ Triad)
Seamless, Technology-Enabled Dealer to Consumer Experience
digital application and near-instant decisioning
FINANCIAL INDUSTRY SOLUTIONS
3 2 6 5 4 1
8
Presenter: Mark Berch
9
FINANCIAL INDUSTRY SOLUTIONS
10
Mark Berch President
Finance
spent more than 20 years as a principal founder and
Care, International Chemical and Supply, and United Restoration, LLC
Association of Professionally Accredited Contractors (NAPAC)
FINANCIAL INDUSTRY SOLUTIONS
11
utilizes a technology-driven platform to originate prime & super-prime loans to finance home improvement projects
party servicer in all 50 states and D.C.
manufacturers and trade associations across the US
and sound lending practices and compliance
life insurer - zero objections or negative comments during formal examinations
Note: Use of the term “Loan” and “Borrower” in this presentation is for ease of reference only. Financings are in the form of retail installment contracts (“RIC”)
regulatory exams loans originated to date partnerships with financial institutions
Zero objections
network of dealer relationships nationally
~10K $4B+ 22
FINANCIAL INDUSTRY SOLUTIONS
12
Overview
management team with average industry tenure of 20+ years
Boca Raton, FL
consumer lender in all 50 states
team achieving industry leading performance
scale
Experienced Leadership and Proven Management Team Name/Title Industry Experience SFC Experience Mark Berch President 35 years 14 years Ian Berch COO 33 years 14 years Steven Miner Legal & Compliance 10 years 10 years Eric Berch CFO 33 years 14 years Gary Lobban VP Servicing 30 years 14 years Chuck Upshur VP Business Dev 15 years 7 years Gilbert Rosario VP IT Infrastructure 15 years 5 years FINANCIAL INDUSTRY SOLUTIONS
✓ Kitchen Remodels
13
✓ Roofing / Insulation ✓ Paint / Siding / Stucco ✓ Windows / Doors Shutters ✓ Basement Refinishing ✓ Water Heaters ✓ Duct Work ✓ Flooring ✓ Bathroom Remodels ✓ Solar Equipment
4 6 7 9 5 10 3
✓ HVAC ✓ Gutters
1 2 11 4 3 2 1 6 9 5 10 11 7 8 8 12 12 FINANCIAL INDUSTRY SOLUTIONS
Consumer contacts dealer Dealer provides an estimate and facilitates credit application process SFC underwrites the credit application Retail installment contract (“RIC”) docs executed Job completion and customer satisfaction verified Financial Institution purchases (Buyer) RIC from SFC SFC funds Contractor SFC services the RIC for the buyer
Business Flowchart
Origination
sales finance programs and continuously adding new partners
without sacrificing the quality of the portfolio
to submitting credit applications, continuously monitored and annually renewed, including credit reports, financial statements and manufacturers warranty
Underwriting
Financial Institution Partners via pre-determined credit criteria and master loan purchase agreement
underwriting practices
been formally examined by state and federal regulators without
RIC Purchase & Management
US financial institutions
best-in-class servicing
integrates loan origination, servicing, payment processing, asset management and reporting
portfolio management
Capital Reinvested
FINANCIAL INDUSTRY SOLUTIONS
14
15
✓ Proven platform capable of driving higher sales finance volume with no hidden fees ✓ Increases sales by facilitating credit in real-time at the point-of-purchase ✓ Diverse product offerings that are compelling to consumers ✓ Unique payment process provides staged funding and faster payment ✓ Focus on superior customer service ✓ Consultative approach to help dealers grow their business ✓ Seamless, efficient online dealer enrollment; zero integration required
Total Dealers Why Dealers Choose SFC FINANCIAL INDUSTRY SOLUTIONS
4,627 4,976 5,264 5,506 5,959 6,524 6,966 7,363 7,932 8,359 8,608 8,872 9,576 10,043
Process, Price & Platform
16
Compliance Attractive Yields Safety & Soundness Partner Challenges Service Finance Solutions
to drive risk adjusted returns
quality to meet regulatory requirements
ROA
average FICO score of ~766
the highest standards
requirements
continual regulatory review
able to meet strict regulatory requirements
decisions at Service Finance
category, geography & multiple top- tier vendor partners
during formal examinations
FINANCIAL INDUSTRY SOLUTIONS
Exclusive manufacturer agreements that drive network of ~10,000+ dealers built over 10+ years is a paramount barrier to entry Origination Power of the Network
access to dealer networks
promotion
scale, diverse loan originations at a low cost
significant portfolios of highly attractive loan
To replicate SFC’s network would be time consuming and costly Dealer Underwriting and Monitoring
partnerships are credit losses and regulatory risk
and ongoing dealer monitoring ensures loans are suitable for banks
continuous review and annual renewal ensures high-quality dealer base
FINANCIAL INDUSTRY SOLUTIONS
17
18
FINANCIAL INDUSTRY SOLUTIONS
1 Consistent pricing – having no changes in dealer fees over the last 12 months 2 Hidden fees can include but are not limited to interchange, card activation, minimum volume, ACH etc. 3 Options available for most every consumer credit type – no menus and no limitations 4 All providers have online consumer credit applications, however SFC’s trails in functionality and user friendliness 5 SFC’s new requirements, effective October 15, 2018, requires no work order, verification, and/or proof of ownership
19
FINANCIAL INDUSTRY SOLUTIONS
1 Source: Home Improvement Research Institute Forecast Update September 2019; Does not include Labor costs 2 Source: US Census, 2018 Lightstream Home Improvement Survey 3 Source: Modernize Homeowner Survey Index: Q4 2018
$0 $100 $200 $300 $400 2000 2001 2002 2003 2004 2005 2006 2007 2008 2009 2010 2011 2012 2013 2014 2015 2016 2017 2018 2019E 2020E 2021E 2022E
Total Home Improvement Market
(US$ Billions)1
Professional Market Consumer Market
$10 $30 $50 $70 $90 $110 $130 2000 2001 2002 2003 2004 2005 2006 2007 2008 2009 2010 2011 2012 2013 2014 2015 2016 2017 2018 2019E 2020E 2021E 2022E
Addressable Professional Market
(US$ billions)1
2020E $125.7B 2020E $417.1B
homeowners spend $5,000 or more2
thereafter1
at $125.7B in 20201
20
1 Source: Home Improvement Research Institute Forecast Update September 2019; Does not include Labor costs 2 ECN estimates; SFC origination estimate at the midpoint of 2019 guidance range of $1.6 Billion - $1.8 Billion
Service Finance $1.7 Greensky $5.0 Wells Fargo $2.5 Synchrony $1.0 EnerBank $0.8 Total $11.0 Total Addressable Market $124.6 Top 5 Est Originations $11.0 Additional Opportunity $113.6 2019 Estimated Addressable Market 2019E Top 5 Originations ($B)2 2019E Addressable Professional Market $124.6B1
2019E Top 5 Lenders $11B2
$11B or ~9% of the available market2
financed with cash, credit cards and/or HELOC’s
segment; expected grow to up to 20% market share within the next five years
FINANCIAL INDUSTRY SOLUTIONS
21
FINANCIAL INDUSTRY SOLUTIONS
Origination growth without changing credit profile; consistent underwriting profile drives continued funding partner acceptance
Huge market opportunity - taking share from cash, credit cards & HELOCs
$101 $165 $360 $547 $812 $1,288 $1,700 $0 $200 $400 $600 $800 $1,000 $1,200 $1,400 $1,600 $1,800 2013 2014 2015 2016 2017 2018 2019E
Originations (US$ millions)1
0.13% 0.19% 0.38% 0.53% 0.73% 1.08% 1.36% 0.00% 0.20% 0.40% 0.60% 0.80% 1.00% 1.20% 1.40% 2013 2014 2015 2016 2017 2018 2019E
% Share of Addressable Professional Market1
22
FINANCIAL INDUSTRY SOLUTIONS
programs and make market share
financing solutions through its dealer network
grew a financing program for Owens Corning which has seen tremendous growth
100,000 150,000 200,000 2014 2015 2016 2017 2018 2019E
Owens Corning Originations ($000)
by displacing competing financing solution providers
earned an exclusive contract to offer installment financing to the Lennox dealer network
financed volume for Lennox and increased the average ticket size by almost 2x
100,000 150,000 200,000 250,000 300,000 350,000 400,000 2014 2015 2016 2017 2018 2019E
Lennox Originations ($000) Take Share - Lennox Make Share – Owens Corning
23
FINANCIAL INDUSTRY SOLUTIONS
The home improvement market has demonstrated resilience through economic conditions, as expenditures have increased steadily even through most recessionary periods
Recession Start2 Recession End2 Total Expenditures Start ($B) Total Expenditures End ($B) % Change
1969:Q4 1970:Q4 13.5 14.8 9.1% 1973:Q4 1975:Q1 18.5 21.3 15.1% 1980:Q1 1980:Q3 43.8 45.4 3.7% 1981:Q3 1982:Q4 46.8 45.3
1990:Q3 1991:Q1 114.2 112.2
2001:Q1 2001:Q4 162.7 169.1 4.0% 2007:Q4 2009:Q2 266.3 236.4
Average Growth (Excluding Great Recession) 4.5% Average Growth (Including Great Recession) 2.3% 1 Data from 1962-1996 from American Housing Survey; data from 1997 and beyond from Harvard Joint Centre for Housing Studies LIRA Index 2 Recessions as defined by the National Bureau of Economic Research
100.0 150.0 200.0 250.0 300.0 350.0 1963:Q1 1966:Q2 1968:Q3 1970:Q4 1973:Q1 1975:Q2 1977:Q3 1979:Q4 1982:Q1 1984:Q2 1986:Q3 1988:Q4 1991:Q1 1993:Q2 1995:Q3 1997:Q4 2000:Q1 2002:Q2 2004:Q3 2006:Q4 2009:Q1 2011:Q2 2013:Q3 2015:Q4 2018:Q1
Four-Quarter Moving Total Home Improvement Expenditures ($B)1 The only material correction occurred during the Financial Crisis, which was preceded by a well above trend spike in volume as a result of easy housing credit Even so, the home improvement market only fell to trend and then resumed growth
Pre-financial crisis spike from easy credit corrected only to long-term trend
33.0% 26.0% 25.0% 8.0% 5.0% 3.0% 800-850 760-799 720-759 700-719 680-699 680 or Lower
SFC FICO DISTRIBUTION
1
FINANCIAL INDUSTRY SOLUTIONS
24
25
FINANCIAL INDUSTRY SOLUTIONS
Note: Data for Core loans only; Loans are sold to funding partners without recourse
Consistent underwriting profile focused on prime & super prime lending results in low absolute losses for financial partners Cumulative Net Loss Curves by Vintage1
Total Loan Portfolio Servicing Assets $2.0BN1
Funded ~$10,977 W.A. Life ~30 months
since ECN’s January Investor Day
FINANCIAL INDUSTRY SOLUTIONS
Current Partners Banks Life Insurance Cos Possible Partners Pension Plans
Top 10 Partners Purchase Commitments Jan 2019 Inv Day Purchase Commitments Today % Change
Top 10 $1,330MM $2,250MM ~+70%
26
SFC Performance vs. Original Investment Projections (US$, millions) Original Projection1 6/8/2017 Actual/Forecast Originations Outperformed by % 2017 $740 $818 +10.5% 2018 $1,111 $1,288 +15.9% 2019E $1,407 $1,600 - $1,800 +13.7% - 27.9% Managed Portfolio Outperformed by % 2017 $1,040 $1,122 +7.9% 2018 $1,400 $1,768 +26.3% 2019E $1,780 $2,500 - $2,700 +40.4% - 51.7%
1. Original projection provided in Service Finance Acquisition presentation dated 6/8/2017 https://www.ecncapitalcorp.com/content/uploads/ECN-Capital-Acquisition-of-Service-Finance.pdf
FINANCIAL INDUSTRY SOLUTIONS
27
28
Other Highlights: ✓ Originations, revenue, and adj op income before tax up in excess of 20% 2019 YTD1 ✓ Profitability – Expected EBITDA margins of ~69% in 2019 ✓ Recurring revenues – long-term servicing revenue now ~50% of total revenues ✓ Efficiency - Revenue and Adj oper income before tax per employee continues to scale (left chart) ✓ Financial partner commitments +~70% in 2019 ✓ Rolling out new national manufacturer partners – Take Share & Make Share
FINANCIAL INDUSTRY SOLUTIONS
1.Through Q2 2019 $50 $150 $250 $350 $450 2015 2016 2017 2018 2019E
Scalable Efficiency - Per Employee Profitability (US$, 000s)
Revenue Per Employee Adj Net Income Before Tax Per Employee
Select Metrics (US$ millions) 2018 2019 Forecast Range Originations 1,288 1,600 1,800 Managed & advised portfolio (period end) 1,768 2,500 2,700 Income Statement (US$ millions) 2018 2019 Forecast Range Revenues 82.0 96 101 EBITDA 56.1 66 70 Adjusted operating income before tax 51.3 62 66 EBITDA margin 69% ~69% ~69%
~32% at the midpoint
market ~$125B
midpoint represents ~1.4% of the addressable market
just ~8% of the addressable market; enormous market opportunity
tax forecast increase by ~25% at the midpoint
29
Q2-2019 FINANCIAL RESULTS
Presenter: Don Glisson, Jr.
30
FINANCIAL INDUSTRY SOLUTIONS
31
Don Glisson Jr. CEO
Services.
number of industry and community awards during the last ten years, including being named by The Manufactured Housing Institute (MHI) as the National Lender of the Year
NASDAQ publicly traded Bank and the largest community Bank in Northeast Florida.
for his efforts on behalf of the Manufactured Housing Industry.
FINANCIAL INDUSTRY SOLUTIONS
32
company; 1959
states providing primarily prime and super-prime loans to consumers for manufactured homes
50 banks and credit unions
national network of dealers and manufacturers
2019
growth potential
longer duration asset and increased servicing penetration
active today partnerships with financial institutions network of dealer relationships nationally
47 States 50+
Longest Tenured US MH Finance Company
3,000K+
FINANCIAL INDUSTRY SOLUTIONS
33
Overview
management team with average tenure of 25 years with Triad
Jacksonville, FL
strategically located across the country
spread between offices
achieving industry leading performance
Experienced Leadership and Proven Management Team Name/Title Industry Experience Triad Experience Don Glisson
CEO
35 years 35 years Michael Tolbert
Executive Vice President
23 years 13 years Seth Deyo
Chief Financial Officer
29 years 18 years Danielle Howard
Chief Compliance Officer
29 years 18 years Ross Eckhardt
President Midwest
43 years 43 years Anthony Glass
SVP-Servicing
20 years 20 years FINANCIAL INDUSTRY SOLUTIONS
34
and then assembled at the building site in sections
single family housing stock
1.
The cost of construction is considerably less
2.
The time to construct is usually considerably less
meet demand
neighborhood architectural styles
factory
FINANCIAL INDUSTRY SOLUTIONS
35
Total US Housing Starts and Sales1 US Residential Housing Market1
500 1000 1500 2000 2500 1988 1990 1992 1994 1996 1998 2000 2002 2004 2006 2008 2010 2012 2014 2016 2018 Thousands of Units Total Housing Starts New One Family Houses Sold (US)
Total US housing stock value of ~$33TN2
~139MM
Housing Stock Units
~83MM
Single Family Units
~9MM
Manufactured Housing Units
FINANCIAL INDUSTRY SOLUTIONS
36
monthly basis than alternatives
equivalent site-built housing or apartment rental
closing costs at an average of $2,500 vs. $1,250
federal and state regulation
prior to shipment
$1,228 $1,167 $728
2 Bedroom Apartment 3 Bed/2 Bath Site- Built Home 3 Bed/2 Bath Manufactured Home Monthly Cost of Living FINANCIAL INDUSTRY SOLUTIONS
37
Origination Under- writing Sale + Servicing
and manufacturers
account
Creating value for consumers, dealers and bank partners with MH finance
FINANCIAL INDUSTRY SOLUTIONS
38
Three Business Verticals
~30% of Originations ~70% of Originations
Description
underwriting, and originating MH loans
RECOURSE
servicing fee and completes underwriting / origination services for a flat fee Statistics (average 2018)
Description
manufactured homes
awaiting final onsite completion (<30-days duration)
drive additional MH Loan growth
3x faster than dealers not using floorplan
market share
Description
credit unions for the sale of originations
risk, however, they establish a reserve account with the lending partner as a first-loss pool
Statistics (average 2018)
Manufactured Housing Loans Managed Only Floorplan
High credit quality secured consumer loans Assist third parties in Servicing/Originating Provide dealers with floorplan financing
FINANCIAL INDUSTRY SOLUTIONS
Consumer selects a home from a retailer Consumer submits loan application to Triad Triad underwrites the credit application Loan documents executed Job completion and customer satisfaction verified Funds disbursed to retailer Triad services the loan for the buyer
Business Flowchart
Origination
established network of dealers and manufacturers
Floorplan Finance and being a neutral partner
maintaining Safe and Sound Lending Practices
Training, and Collection practices available in Appendix
Underwriting
Financial Institution Partners via pre-determined credit criteria
underwriting practices
formally examined by state and federal regulators without
Loan Purchase & Management
portfolio management
niche asset
FDCPA compliant
Register, Delinquent Summary, and more
Capital Reinvested
FINANCIAL INDUSTRY SOLUTIONS
39
40
FINANCIAL INDUSTRY SOLUTIONS
Manufacturer % of Total1 Manufacturer 1 10.9% Manufacturer 2 10.7% Manufacturer 3 9.7% Manufacturer 4 7.1% Manufacturer 5 5.0% Manufacturer 6 4.6% Manufacturer 7 3.7% Manufacturer 8 3.6% Manufacturer 9 3.6% Manufacturer 10 2.6% Manufacturer 11 2.4% Manufacturer 12 2.2% Manufacturer 13 2.2% Manufacturer 14 1.7% Manufacturer 15 1.6% Manufacturer 16 1.5% Manufacturer 17 1.2% Manufacturer 18 1.1% Manufacturer 19 1.0% Manufacturer 20 1.0% All Other Manufacturers 22.6% Total 100.0%
Manufacturers
financing partner for the manufactured housing industry since 1959
penetrated network of manufacturers across the industry
the full range of available product options for consumers nationwide
build homes coast to coast in the continental U.S.
manufacturer loyalty and drives additional growth in MH
41 Funding Partner % of Total1 Length of Relationship (Years)
A – Bank 14.6% 14 B – Credit Union 7.2% 9 C – Credit Union 6.4% 4 D – Bank 5.7% 2 E – Credit Union 5.5% 5 F – Credit Union 4.5% 13 G – Credit Union 4.4% 13 H – Bank 3.5% 14 I – Bank 2.9% 6 J – Credit Union 2.4% 3 K – Credit Union 2.3% 13 L – Credit Union 2.3% 13 M – Credit Union 2.1% 7 N – Bank 2.1% 19
Total Loan Portfolio Loans Outstanding $2.3BN
Funded ~$50,000 W.A. Life 93 months
FINANCIAL INDUSTRY SOLUTIONS
Current Funding Partners Banks Credit Unions Additional Future Partners Life Insurance Cos
42
FINANCIAL INDUSTRY SOLUTIONS
43
Note: performance statistics measured in units
Time Tested Portfolio Performance
0.0% 0.5% 1.0% 1.5% 2.0% 2.5% 3.0%
Historical Performance
30+Delinquency NCO 1.0% 1.2% 1.4% 1.6% 1.8% 2.0% 2.2% 2.4% 2.6% 2.8% 3.0% Jan Feb Mar Apr May Jun Jul Aug Sep Oct Nov Dec
Year-over-Year Performance (30+ Delinquency)
2017 2018 2015-2017 Avg
FINANCIAL INDUSTRY SOLUTIONS
Credit Crisis peak annualized charge-offs of just 1.3% (after recovery)
44
Other Highlights since the transaction: ✓ Broadly diversified funding model continues – 50+ active financial partners ✓ Built Floorplan business which is increasing MH market share ✓ Fully serviced assets have grown to ~40% from ~26% at the time of the transaction ✓ Adjusted operating income
✓ EBITDA margin outperforming
Triad Performance vs. Original Projections (US$, millions)
Projection from Original Deal 10/25/2017 Actual/Forecast Adj Op Income Outperformed by % 2018 $15.2 $19.9 +30.9% 2019E $18.4 $22.0 - $25.0 +19.5 – 35.8% Originations Outperformed by % 2018 $525 $525
$586 $600 - $620 +2.3% - 5.8% EBITDA Margin Increased by % 2018 43.4% 44.2% +0.8% 2019E 44.8% ~47% - ~50% +2.2% - 5.2%
FINANCIAL INDUSTRY SOLUTIONS
KEY HIGHLIGHTS
at the midpoint
share
for increasing shipment rates as an affordable housing solution
leading to increased ongoing revenue streams
in 2019 at the midpoint
expand
increase
Select Metrics (US$ millions) 2018 2019 Forecast Total originations 525 600 620 Floorplan line utilized 78 100 110 Managed & advised portfolio (period end) 2,166 2,500 2,600 Income Statement (US$ millions) 2018 2019 Forecast Revenue 49.6 55 60 EBITDA 21.9 26 30 Adjusted operating income before tax 19.9 22 25 EBITDA margin 44% ~47% ~50% 45
FINANCIAL INDUSTRY SOLUTIONS
46
Presenter: Scott Shaw
FINANCIAL INDUSTRY SOLUTIONS
47
FINANCIAL INDUSTRY SOLUTIONS
Scott Shaw CEO and President
side Howard Kessler
across KG’s business verticals
creating a backlog of annuity income streams across the credit card, payments and related consumer finance businesses
48
services industry leader that has shaped and transformed the payments industry
premier manager, advisor and structuring partner to credit card issuers, banks, credit unions and payment networks
business services platform with deep, long-term bank relationships
solutions, though its service offerings and expertise now include a full range of retail financial services products
model with repeat clients and long-term contracts
partners to Service Finance / Triad
financial institutions with credit card portfolios
25+
Managed & Advised Portfolio Assets
$28BN+
revenue streams
70%
FINANCIAL INDUSTRY SOLUTIONS
Co-brand credit card partnerships created
6,000+
49
Overview
management team with average tenure of ~20 years with KG
management who have 15+ years experience (average tenure) working directly with clients across each business vertical
MA
Experienced Leadership and Proven Management Team Name/Title Industry Experience KG Tenure FINANCIAL INDUSTRY SOLUTIONS
Scott Shaw CEO & President 30+ years 27 years Howard Kessler Chairman Emeritus 40+ years 40+ years Dax Cummings
25+ years 10 years Carl Erickson
25+ years 14 years Steve Eulie EVP Product Strategy 25+ years 2 years Pat Burns EVP Credit 25+ years <1 year
50
Business verticals develop end-to-end solutions for bank clients
Advisory, transaction services and investment focused on co-brand and partnership credit card portfolios
Advisory Services
Transactional Services
Investment & Management
At-risk investment, advisory and execution of direct marketing for credit cards, deposits, high-yield savings, unsecured loans, etc.
Origination / Growth Funding
marketing for US and international clients, enabling them to overcome common challenges:
Advisory Services
capabilities
Long-term contracted relationships with major financial institutions to manage and advise on co-branded credit cards and partnership portfolios
Development
inception Restructuring
enhancement opportunities
satisfaction Dissolution
transitions by developing creative structures to achieve both buyer’s and seller’s
Strategic Partnerships Portfolio Advisory & Investment Risk-Based Marketing Advisory and Funding
Created over 6,000 partnerships with balances in excess of $150 billion Brokered over 500 portfolios totaling
Invested over $800 million generating 4 million+ new customer relationships
FINANCIAL INDUSTRY SOLUTIONS
% of YTD 2019 Total Revenue: 66% % of YTD 2019 Total Revenue: 20% % of YTD 2019 Total Revenue: 14%
51
companies, payment networks, major affinities and other
protection via guaranteed cash flow streams for the next 5+ years
clients
extended globally and across many verticals
KG’s continued growth and success is enabled by a transformative approach and team of professionals who constantly assess market developments and opportunities Differentiators Industry Footprint
Top 12 Largest US Banks by Assets Top 25 US Regional Banks By Assets
50% | 50% 52% | 48%
Top 15 US Credit Card Issuers by Balances
KG Clients Other 33% | 67%
FINANCIAL INDUSTRY SOLUTIONS
1990s and 2000s Today Business
services Clients
Products Supported • Partnership credit card
Revenue / Contracts
commitments
Market Position & Perception Hub for partnership credit card programs Hub for partnership credit card programs and retail banking product strategy development, growth funding & execution
52
FINANCIAL INDUSTRY SOLUTIONS
53
$- $200,000 $400,000 $600,000 $800,000 $1,000,000 $1,200,000 Date Jan-70 Feb-72 Mar-74 Apr-76 May-78 Jun-80 Jul-82 Aug-84 Sep-86 Oct-88 Nov-90 Dec-92 Jan-95 Feb-97 Mar-99 Apr-01 May-03 Jun-05 Jul-07 Aug-09 Sep-11 Oct-13 Nov-15 Dec-17
Total Revolving Credit US
US$ (000,000s)
Recessions Beginning Balance Ending Balance % Change 1969 Q4 1970 Q4 $ 3,210 $ 5,130 59.8% 1973 Q4 1975 Q1 $ 10,946 $ 13,206 20.6% 1980 Q1 1980 Q3 $ 56,164 $ 53,806
1981 Q3 1982 Q4 $ 57,921 $ 70,461 21.7% 1990 Q3 1991 Q1 $ 227,119 $ 243,907 7.4% 2001 Q1 2001 Q4 $ 693,224 $ 735,093 6.0% 2007 Q4 2009 Q2 $ 951,303 $ 927,383
Financial Crisis Peak Dec-08 $ 1,003,997 Trough Apr-11 $ 789,857 Total Change $ (214,140)
balances have been resilient
balance/new product) and the financial crisis balances grew on average by 7.7% through recessions
peak, but this period marked an extraordinary consumer recession FINANCIAL INDUSTRY SOLUTIONS
Revolving balances have generally been resilient through most cycles with the exception of the Financial Crisis from 2008-2011
Source: All Revolving Credit - Federal Reserve Bank Consumer Credit Outstanding – Revolving G.19 https://www.federalreserve.gov/releases/g19/HIST/cc_hist_r_levels.html
54
FINANCIAL INDUSTRY SOLUTIONS
KG responds to industry challenges – helping clients during both strong economic cycles and in downturns
Source: The Nilson Report – Credit Card Balances
55
FINANCIAL INDUSTRY SOLUTIONS
KG has identified several opportunity buckets for the next downturn to continue providing solutions for partners during all stages of economic cycle
Marketing Budget Compression
Non-strategic / High-loss Portfolios
Strategic Realignment
correspond to strategy
Subprime Lending Entry & Expansion
Strategic Partnerships
Opportunity Bucket Applicable KG Vertical Impact to Clients
Portfolio Advisory & Investment Strategic Partnerships Portfolio Advisory & Investment Risk-Based Marketing Advisory and Funding Risk-Based Marketing Advisory and Funding Portfolio Advisory & Investment
56 The Kessler Group’s customers are predominantly large, federally-regulated financial institutions with investment grade credit ratings
KG credit risk limited to counterparty exposure
Entity Primary Strategic Division Debt Rating Length of Relationship (Years) Annual Fees Earned
A Strategic Partnerships Baa1 (BBB)
Senior Unsecured
15+ $15-20MM B Strategic Partnerships A1 (A+)
Senior Unsecured
10+ $10-15MM C Strategic Partnerships Baa3
Senior Unsecured
15+ $2-5MM D Strategic Partnerships n/a
Senior Unsecured
10+ $3-7MM E Portfolio Advisory A3 (A-)
Senior Unsecured
35+ $2-10MM F Portfolio Advisory A3 (A-)
Senior Unsecured
15+ $1-10MM G Portfolio Advisory A3 (BBB+)
Senior Unsecured
20+ $1-3MM H Risk-Based Marketing BBB+ (BBB+)
Senior Unsecured
2+ $2-5MM I Risk-Based Marketing Aa1 (AA-)
Senior Unsecured
2+ $3-5MM J Risk-Based Marketing Baa3
Senior Unsecured
1 $1-3MM K Multi-Channel Marketing A1 (A+)
Senior Unsecured
25+ $5-10MM
FINANCIAL INDUSTRY SOLUTIONS
57
Highlights since the transaction: ✓ 2018 adjusted operating income before tax exceeded estimates at the time of the transaction ✓ Original guidance for 2019 was raised in Q1 2019 ✓ Accomplished management transition ✓ ECN purchased the minority interest resulting in 96% ownership ✓ Optimized existing annuity relationship with a significant client resulting in ~$83 million cash payment and exclusivity on new mandates ✓ Successfully shifting business emphasis to longer-term predictable earnings streams - ~80% of revenue YTD 20191
FINANCIAL INDUSTRY SOLUTIONS
1. Through Q2 2019
Income Statement
(US$ millions)
20181 2019 Forecast Range Revenue 62.2 86 90 EBITDA 35.7 46 49 Adjusted operating income before tax (100%) 34.3 44 48 Adjusted operating income before tax (ECN share) 26.4 42 46 EBITDA margin ~57% ~53% ~54%
KEY HIGHLIGHTS
improved operating results
agreement with significant long-term client performing ahead of expectations
continue to add new relationships and long-term contracts given current pipeline
income ~$200 million
2019 with a strong pipeline for the remainder of the year
generate net revenue of ~$15 million in 2019
58
FINANCIAL INDUSTRY SOLUTIONS
59
Presenter: Steven Hudson
FINANCIAL INDUSTRY SOLUTIONS
60
Financial Institution Partnerships Manufacturer & Dealer Network Sustainability & Durability Low-Risk Loan Origination
Strong Regulatory Framework
FINANCIAL INDUSTRY SOLUTIONS
61
Strategic use of balance sheet for “foundation” products; incremental originations New loan products “on- message”; no FICO creep lower to drive originations Take & make share strategies gaining traction Financial Partners
1 3 4 2
incremental origination & managed assets
core
FINANCIAL INDUSTRY SOLUTIONS
adjustments for loan performance, interest rate changes, prepayment, etc.
checks, complaint examination, experience and license verification, credit checks for key personnel and financial statement review
program/product mix, complaints and compliance, loan performance and are re-certified each and every year
compliance
federal pre-emption
disclosures and execute loan documents
to the funding of a loan confirming the consumer is satisfied and that they understand the terms and conditions of the loan
ECN Business Services Companies Clawback on Origination Fee/Transaction Fee None Servicing Fee Contribution Significant & Growing Recourse:
None
None
None Dealer Processing Fees None Loan Types Variety of rate, payment, and duration options Project Types All Licensing Nationally licensed
62
FINANCIAL INDUSTRY SOLUTIONS
Adjusted Net Income (US$ millions) 2019 Service Finance $62 $66 Kessler Group (96%) $42 $46 Triad Financial Services $22 $25 Continuing Ops Adj Op Income before Tax $126 $137 Corporate operating expenses ($19) ($20) Corporate depreciation ($2) ($2) Corporate interest ($11) ($13) Total ECN adjusted operating income before tax $94 $102 Tax – Non-Cash ($21) ($23) Total ECN adjusted net income $74 $80 Preferred Dividends ($13) ($13) Adjusted net income (after pfds) $61 $67 EPS US$ $0.25 $0.28
KEY HIGHLIGHTS
+10% at the midpoint at Q1 2019
reiterated
$42-$46 million in Q1 2019
reduced corporate opex
No cash taxes paid in 2019
tax eliminated for full year it would add ~$0.01 to 2019 guidance
63
FINANCIAL INDUSTRY SOLUTIONS