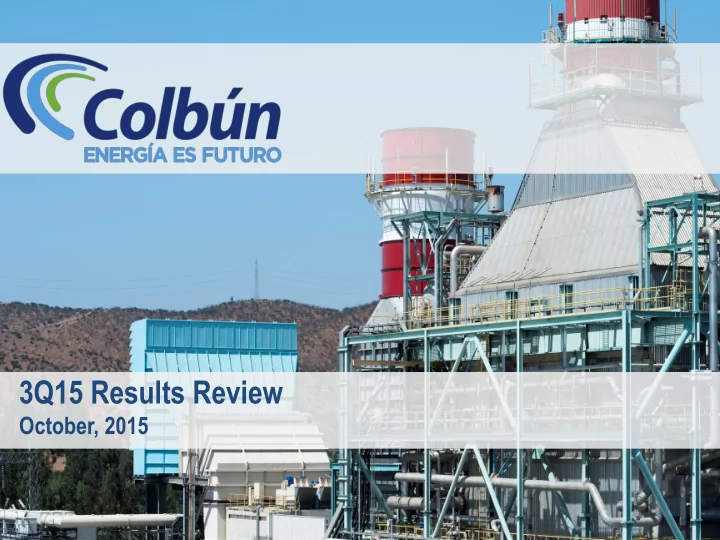

3Q15 Results Review October, 2015
2 AGENDA 1. HIGHLIGHTS 2. FINANCIAL REVIEW 3. GROWTH OPTIONS 4. RECENT EVENTS
3 HIGHLIGHTS FOR 3Q 2015 Hydro Generation EBITDA Revenues 1 2 3 (GWh) (MMUS$) (MMUS$) 1,816 5% 55% 1,724 181 4% 351 117 337 3Q14 3Q15 3Q14 3Q15 3Q14 3Q15 4 5 6 Net Income Efficient Capacity over Net Debt (MMUS$) Commitments (%) (MMUS$) 316% 6% 76 33% 87 82 1,167 780 18 3Q14 3Q15 3Q14 3Q15 3Q14 3Q15
4 AGENDA 1. HIGHLIGHTS 2. FINANCIAL REVIEW 3. GROWTH OPTIONS 4. RECENT EVENTS
5 PHYSICAL SALES AND GENERATION BALANCE ANALYSIS Sales Volumes 3Q14 3Q15 YoY Key Drivers of 3Q15 GWh Regulated Customers 1,849 1,636 (12%) Free Customers 1,197 1,106 (8%) Sales reduction: Total Commitments 3,046 2,741 (10%) Contracts maturity: Conafe and Codelco Spot Market Sales 147 456 210% 3,193 3,197 0% Total Energy Sales Lower demand from customers Spot Market Partly offset by higher sales in the spot 3Q14 3Q15 YoY GWh market Sales 147 456 210% 24 0 - Purchases Lower hydroelectric generation , offset by Net Spot Market 123 456 270% higher natural gas generation at a competitive cost. Generation 3Q14 3Q15 YoY GWh Zero diesel generation 1,816 1,724 (5%) Hydroelectric Thermal – Gas 536 868 62% Thermal – Diesel 216 0 - 672 651 (3%) Thermal - Coal - 27 - Eolic - Punta Palmeras Total Own Generation 3,240 3,270 1%
6 EBITDA ANALYSIS Key Drivers of 3Q15 US$ million 3Q14 3Q15 YoY Lower sales given by the contracts Revenues 351.2 337.0 (4%) maturity and lower average monomic price Raw Materials and (213.8) (136.0) (36%) Consumables Used Personnel and other (20.5) (20.1) (2%) Non-recurring income from the Blanco operating expenses power plant loss of profit insurance EBITDA 117.0 180.9 55% payment (MMUS$21.5 million) . EBITDA Margin (%) 33% 54% Reduction in thermal generation costs (US$/MWh) given by renegotiated gas supply agreements and lower international fuel prices
7 NON-OPERATING INCOME ANALYSIS (SUMMARY) 3Q14 3Q15 YoY US$ million Key Drivers of 3Q15 Financial Income 1.7 1.4 (18%) Higher Exchange Rate Differences Financial Expenses (22.2) (22.2) (0%) loss given by CLP/US$ volatility 1.0 0.9 Results of Indexation Units (12%) (4.4) (11.4) Exchange Rate Differences 161% Non-recurring income from the Share of profit (loss) from equity- 1.0 2.3 137% accounted associates Blanco power plant physical damage Other non-operating income/expense 1.6 10.5 576% insurance payment (21.3) (18.4) (14%) NON-OPERATING INCOME
8 NET INCOME ANALYSIS Key Drivers of 3Q15 3Q14 3Q15 YoY US$ million Higher Net Income driven mainly by NET INCOME 18.2 75.7 316% higher EBITDA margin
9 AGENDA 1. HIGHLIGHTS 2. FINANCIAL REVIEW 3. GROWTH OPTIONS 4. RECENT EVENTS
10 SEARCHING FOR INVESTMENT OPPORTUNITIES IN THE REGION Special focus in Colombia and Perú Growing electricity consumption Well established regulatory framework Diversification: Hydrological conditions Generation technologies Access to fuel sources Regulatory Risks
11 LA MINA NCRE, CONSTRUCTION SITE 34 MW of Installed Capacity and 190 GWh of expected annual generation
12 COLBÚN HAS SEVERAL GROWTH OPPORTUNITIES Projects in Chile San Pedro - Hydroelectric Project 160-170 MW of Capacity 950 GWh of expected annual generation Santa María II – Coal-fired Project 350 MW of Capacity 2,500 GWh of expected annual generation
13 AGENDA 1. HIGHLIGHTS 2. FINANCIAL REVIEW 3. GROWTH OPTIONS 4. RECENT EVENTS
14 RECENT EVENTS In September a medium-term natural gas supply agreement was reached with ENAP for the 2016- 2019 period. Colbún obtained a reserve regasification capacity in the Open Season process of GNL Quintero. Regasification Contracted Gas Generation: Metrogas and ENAP (GWh) Capacity (GWh) 4,000 3,350 3,500 3,000 2,500 2,500 2,500 2,500 2,000 2,000 2,000 1,500 1,000 500 - 2015 2016 2017 2018 2019 2020-2040
This document provides information about Colbún S.A. In no case this document constitutes a comprehensive analysis of the financial, production and sales situation of the company. To evaluate whether to purchase or sell securities of the company, the investor must conduct its own independent analysis. This presentation may contain forward-looking statements concerning Colbun's future performance and should be considered as good faith estimates by Colbún S.A. In compliance with the applicable rules, Colbún S.A. publishes on its Web Site (www.Colbún.cl) and sends the financial statements of the Company and its corresponding notes to the Superintendencia de Valores y Seguros, those documents should be read as a complement to this presentation. INVESTOR RELATIONS TEAM CONTACT Miguel Alarcón María Elena Palma malarcon@colbun.cl mpalma@colbun.cl +(562) 2 460 4394 +(562) 2 460 4450 11
More recommend