
3/5/2020 1
General threats to water quality and human health from proposed municipal wastewater discharges by the City of Blanco
By Raymond Slade, Jr, Certified Professional Hydrologist
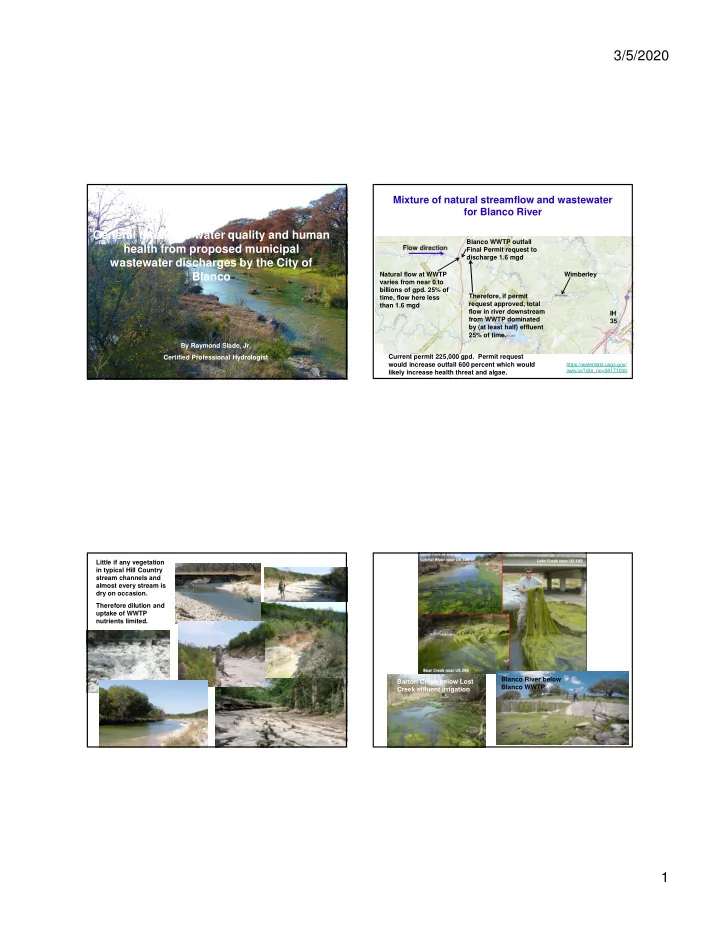
Mixture of natural streamflow and wastewater for Blanco River
https://waterdata.usgs.gov/ nwis/uv?site_no=08171000
Natural flow at WWTP varies from near 0 to billions of gpd. 25% of time, flow here less than 1.6 mgd IH 35 Blanco WWTP outfall Final Permit request to discharge 1.6 mgd Therefore, if permit request approved, total flow in river downstream from WWTP dominated by (at least half) effluent 25% of time. Wimberley Current permit 225,000 gpd. Permit request would increase outfall 600 percent which would likely increase health threat and algae. Little if any vegetation in typical Hill Country stream channels and almost every stream is dry on occasion. Therefore dilution and uptake of WWTP nutrients limited. Barton Creek below Lost Creek effluent irrigation Blanco River below Blanco WWTP