
SLIDE 1
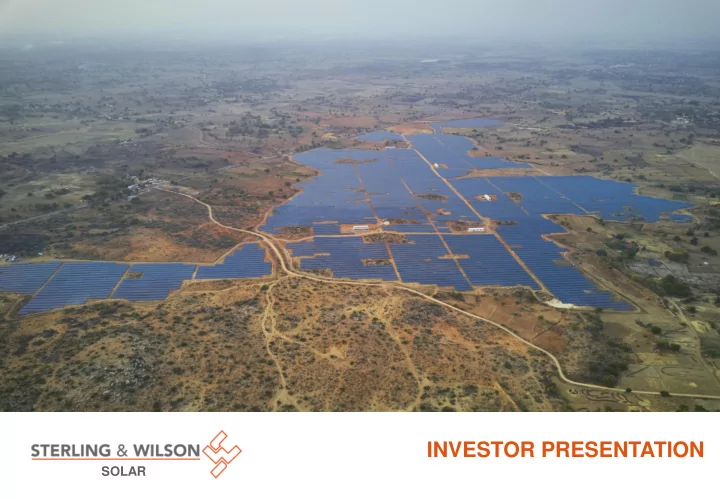
INVESTOR PRESENTATION
April 2018
SOLAR
INVESTOR PRESENTATION SOLAR Disclaimer This presentation and the - - PowerPoint PPT Presentation
April 2018 INVESTOR PRESENTATION SOLAR Disclaimer This presentation and the accompanying slides (the Presentation ) have been prepared by Sterling and Wilson Solar Limited (the Company ) solely for information purposes and do not
SOLAR
Strictly Private and Confidential 1
This presentation and the accompanying slides (the “Presentation”) have been prepared by Sterling and Wilson Solar Limited (the “Company”) solely for information purposes and do not constitute an offer to sell or, recommendation or solicitation of an offer to subscribe for or purchase any securities and nothing contained herein shall form the basis of any contract or commitment whatsoever. This Presentation is strictly confidential and may not be taken away, copied, published, distributed or transmitted or reproduced
not been reviewed by any regulatory authority in any jurisdiction. The distribution of the Presentation in certain jurisdictions may be restricted by law and the recipients into whose possession the Presentation comes should inform themselves about and observe such restrictions. Further, the securities of the Company have not been and will not be registered under the U.S. Securities Act of 1933, as amended (the “Securities Act”), or the securities laws of any applicable jurisdiction and these materials do not constitute or form a part of any offer to sell or solicitation of an offer to purchase or subscribe for securities in the United States or elsewhere in which such offer, solicitation or sale would be unlawful prior to registration under the Securities Act or the securities laws of any such
the United States. By accessing this Presentation, each investor is deemed to represent that it is and any customer it represents are either (a) qualified institutional buyers (within the meaning of Rule 144A under the Securities Act) or (b) outside the U.S. (within the meaning of Regulation S under the Securities Act), and is a sophisticated investor who possesses sufficient investment expertise to understand the risks involved in the offering. This Presentation is not intended to be a prospectus (as defined under the Companies Act, 2013, as amended) or draft offer document / an offer document under the Securities and Exchange Board of India (Issue of Capital and Disclosure Requirements) Regulations, 2018, as amended. The information contained in this Presentation should be considered in the context of the circumstances prevailing at the time and has not been, and will not be, updated to reflect material developments, which may occur after the date of the Presentation. The information set out herein may be subject to updating, completion, revision, verification and amendment and such information may change materially. This presentation is based on the economic, regulatory, market and other conditions as in effect on the date
and agree that the Company and/or its affiliated companies and/or their respective employees and/or agents have no responsibility or liability (express or implied) whatsoever and howsoever arising (including, without limitation for any claim, proceedings, action, suits, losses, expenses, damages or costs) which may be brought against or suffered by any person as a result of acting in reliance upon the whole or any part of the contents of this Presentation and neither the Company, its affiliated companies nor their respective employees or agents accepts any liability for any error, omission or misstatement, negligent or otherwise, in this Presentation and any liability in respect of the Presentation or any inaccuracy therein or omission therefrom which might otherwise arise is hereby expressly disclaimed. Certain statements contained in this Presentation may be statements of the Company’s beliefs, plans and expectations about the future and other forward looking statements that are based on management’s current expectations or beliefs as well as a number of assumptions about the Company’s operations and factors beyond the Company’s control or third party sources and involve known and unknown risks and uncertainties that could cause actual results to differ materially from those contemplated by the relevant forward looking statements. Forward looking statements contained in this Presentation regarding past trends or activities should not be taken as a representation that such trends or activities will continue in the future. There is no obligation to update or revise any forward looking statements, whether as a result of new information, future events or otherwise. You should not place undue reliance on forward looking statements, which speak only as of the date of this Presentation. If the Company should at any time commence an offering of securities, any decision to invest in any such offer to subscribe for or acquire securities of the Company must be based wholly on the information contained in the red herring prospectus and the prospectus and any international offering memorandum (including the risk factors mentioned therein) issued or to be issued by the Company in connection with any such offer and not on the contents herein. Information contained in this presentation is qualified in its entirety by reference to an offering document for any potential transaction, if it proceeds. Any potential transaction could be made available to the recipient of this document in accordance with the applicable laws and regulations, including the distribution of any required documents for such potential transaction and such documents will supersede all prior information provided to the recipient, herein or otherwise. No representation or warranty express or implied) is made as to, and no reliance should be placed on, the accuracy, completeness or correctness of any information, including any projections, estimates, targets and opinions contained herein, and no liability whatsoever is accepted as to any errors, omissions or misstatements contained herein and, accordingly, none
liability (in negligence or otherwise) whatsoever arising directly or indirectly from the use of this presentation The contents of this Presentation have not been independently verified and this Presentation has been prepared by the Company solely for informational purposes. Neither the delivery of this Presentation nor any further discussions with any of the recipients shall, under any circumstance, create any implication that there has been no change in the affairs of the Company. This Presentation is a summary only and it is not the intention to provide, and you may not rely on these materials as providing, a complete or comprehensive analysis of the financial position or prospects of the Company. Certain data contained in this Presentation was obtained from various external data sources, and none of the Company nor any of its respective affiliates, advisers or representatives has verified this data with independent sources. Accordingly, the Company and its respective affiliates, advisers and representatives make no representation as to the fairness, accuracy, correctness, authenticity or completeness of that data, and this data involves risks and uncertainties and is subject to change based on various factors. The information contained in this Presentation is not to be taken as any recommendation made by the Company or any other person to enter into any agreement with regard to any investment. You will be solely responsible for your own assessment of the market and the market position of the Company and you will conduct your own analysis and be solely responsible for forming your own view of the potential future performance of the business of the Company. By attending or viewing all or part of this presentation, you (A) acknowledge and agree to be bound by the limitations and restrictions described herein, (B) agree to maintain confidentiality regarding the information disclosed in this presentation, and (C) agree to maintain confidentiality of the existence and scope of this presentation and of all conversations regarding this potential investment opportunity, (D) represent that you are lawfully able to receive this presentation under the laws of the jurisdiction in which you are located or other applicable laws. Any failure to comply with these restrictions may constitute a violation of applicable securities laws. The Company is proposing, subject to applicable statutory or regulatory requirements, receipt of requisite approvals, market conditions and other considerations to make an initial public offering of its equity shares and has filed a red herring prospectus dated July 29, 2019 (“RHP”) with Registrar of Companies, Maharashtra at Mumbai (“RoC”). The RHP is available on the website of the SEBI at www.sebi.gov.in, BSE Limited at www.bseindia.com, National Stock Exchange of India Limited at www.nseindia.com and the websites of websites of the Global Co-ordinators and Book Running Lead Managers at www.icicisecurities.com, www.axiscapital.co.in, www.credit-suisse.com, www.db.com/India, www.iiflcap.com and www.sbicaps.com; Book Running Lead Managers at www.indusind.com and www.yesinvest.in. Any potential investors should note that investment in equity shares involves a high degree of risk and for details refer to the “Risk Factors” on page 28 of the RHP. Potential investors should not rely on the DRHP filed with the SEBI for making any investment decision.
Strictly Private and Confidential 2
group for more than 2 decades
EPC sector
group for more than 8 years
finance and audit related matters
Boyce, Lovelock and Lewes
group for more than 7 years
business development and sales
Technologies and Asea Brown Boveri
Company
group for almost 25 years
Khurshed Daruvala
Chairman
Bikesh Ogra
Director & Global CEO
Bahadur Dastoor
Chief Financial Officer
Vikas Bansal
Head – International Business Development
Strictly Private and Confidential 3 Strictly Private and Confidential
Strictly Private and Confidential 4
Company Sterling and Wilson Solar Limited (the “Company” or "SWSL") Offering Structure
States except pursuant to an exemption from, or in a transaction not subject to, the registration requirements of the Securities Act and applicable state or local securities law. Offering Size
sale of equity shares by Shapoorji Pallonji and Company Private Limited aggregating up to INR 20,833.33 million and by Khurshed Yazdi Daruvala aggregating up to INR 10,416.67 million (together “Promoter Selling Shareholders”)
Objects of the Offer
image apart from providing liquidity to the shareholder and public market for the equity shares in India
the Company and Sterling and Wilson International Solar FZCO from Sterling and Wilson Private Limited (“SWPL”) and Sterling and Wilson International FZE (a subsidiary of SWPL) respectively within 90 days from the date of listing of the equity shares
Strictly Private and Confidential 5
Price Band & Bid Lot
Listing Venue GCBRLMs Offering Timelines
National Stock Exchange of India Limited BSE Limited
BRLMs Deutsche Bank
Strictly Private and Confidential 6 Strictly Private and Confidential
Strictly Private and Confidential 7
Global Recognition
#1
World’s No. 1 Solar EPC(1)
#1
Largest Solar EPC player in India, Middle East & Africa(1)
Leading Solar EPC – 2018 RE International Excellence - Indian Companies - 2018 Excellence in Renewable Energy Project Execution Award CBIP 2017 Operations in 45 countries 90+ years of experience globally
Installing world’s largest single location Solar PV plant(4)
1,177 MWp Abu Dhabi
Market Leader Financial Performance Operational Excellence
Countries
Design & Engineering team
India
Africa
Middle East
Total EPC capacity
Total O&M capacity(6)
(FY16-19)
Operational Revenue (FY19)
Order Book + LOI(2)
(1) IHS Markit ranking 2018; based on annual installations of utility scale PV systems >5MWp (2) Order book, defined as the value of solar power projects for which the Company has entered into definitive EPC contracts minus the revenue already recognized from those projects, is INR 38,316mn as of March 31, 2019. Letter of Intents (LOIs), defined as solar power projects for which the Company has won bids but has not executed definitive EPC contracts, is INR 39,082mn as of March 31, 2019. (3) ROE calculated as consolidated restated net profits divided by networth at the end of period; NW is Equity share capital plus other equity (including legal reserve, retained earnings and effective portion of cash flow hedge). (4) CRISIL Ltd. | (5) Based on percentage share of annual installations of all utility-scale PV systems greater than 5 MWp in 2018 | (6) Total O&M Capacity as of 31 March 2019 | (*All numbers rounded off to the nearest whole no.)
End-to-end “Concept to Commission” solar EPC
Market share 2018(5)
PAT CAGR (FY16-19)
Highly Diversified Operations
70% Revenues in FY19 from international projects Diversified Order Book + LOI(2) as on Mar-19 across 7 regions
RoE (FY19)(3)
Strong Parentage
Strictly Private and Confidential 8
Sterling Wilson group started
2014
Commenced first International Project
2011
Ventured into solar EPC business
2016 Ventured into roof-top solar 2015 Recognised as the largest Indian solar EPC player Achieved Inter Solar Award 2015
2018
Expanded operations in Australia by acquiring a controlling stake in GCO Electrical Pty Ltd. 2017 Demerger of S&W Solar focusing on pure-play solar EPC business from the S&W group Bagged world’s largest single location solar EPC project order in Abu Dhabi 2019 Emerged as World’s largest (1) Solar EPC player in 2018 Global player with presence and
Middle East, Africa, South East Asia, Europe, US and Australia
(1) IHS Markit 2018. Based on annual installations of utility-scale photovoltaic systems of more than 5MWp
0.3% 0.8% 1.0% 2.2% 4.6% 2014 2015 2016 2017 2018 Increasing global market share over the years
Strictly Private and Confidential 9 Strictly Private and Confidential
India 30% International 70%
Revenue from Operations break-up (FY19)
Diversified global operations with a high contribution of revenue from international
(1) Including the countries where the Company has a presence or has executed or is executing a project (2) IHS Markit 2018; Share of annual installations of all utility-scale PV systems >5 MWp (% of MW) for the companies with the largest market shares in 2018. (3) Cumulative as of March 31, 2019; Includes commissioned capacity, under-construction and confirmed contracted capacity. | (*All numbers rounded off to the nearest whole no.)
India 12% Africa 12% SEA 8% US & LATAM 26% MENA 20% Europe 22%
Order book + LOI break-up (As of Mar 2019)(3)
Countries(1)
capacity globally(2)
4.6% 2.2% 2.1% 1.9% 1.9% 1.4% 1.2% Market share (% of installations in 2018)(2)
Largest market share in solar EPC globally
INR 77,398mn
Strictly Private and Confidential 10 Strictly Private and Confidential
Strictly Private and Confidential 11
1
Global solar EPC Leader providing comprehensive end-to-end EPC solutions Fast growing solar market
7
A dedicated design and engineering team focused on innovation and developing efficient technology and engineering solutions
3 4
Strong relationships with customers and other key stakeholders
5
Strong parentage and the ability to leverage the global “SP” brand
6
Highly experienced management team with global operational experience in the solar EPC industry Strong growth and financial performance backed by an asset-light business model
SOLAR
2
Strictly Private and Confidential 12 Strictly Private and Confidential
Solar PV project economics continue to improve with expectations of further improved cost competitiveness
Note: LCOE - Levelized Cost of Energy Source: IHS Markit, CRISIL, BloombergNEF (1) Tariffs are for financial year (Fiscal year ending March), No competitively bid coal projects in 2018/ FY18, Coal tariffs include fixed + variable costs
Solar has increasingly competitive in terms of LCOE (cost of producing each unit of electricity over the lifetime) Global solar utility-scale system costs continue to decline, primarily driven by falling module prices
1.82 1.51 1.14 0.89 0.77 0.70 2012 2014 2016 2018 2020 2022 Average global total utility scale system PV costs
Price per Watt ($/W)
52% 46% 43% 34% 29% 29% 6% 7% 5% 5% 5% 5% 15% 16% 18% 22% 23% 24% 18% 21% 23% 27% 29% 29% 9% 10% 11% 13% 14% 14% 2012 2014 2016 2018 2020 2022 Module Inverter Balance of plant EPC Other
Solar tariffs have seen a sharp decline globally and have fallen significantly below those of traditional energy sources like coal
11 17 10 7 16 7 4 3 6 India MENA S Africa 2014 2016 2018 Solar auction prices (US Cents/KWh) 6.7 5.6 4.8 3.0 2.7 5.2 4.1 4.6 3.8 2014 2015 2016 2017 2018 Solar Coal Tariff trend in India (Rs /KWh)(1) 50 100 150 200 2012 2014 2016 2018 2020 2022 2024 2026 2028 2030 Solar PV Coal Gas Indicative ranges for LCOE in India (US$/KWh) 100 200 300 2012 2014 2016 2018 2020 2022 2024 2026 2028 2030 Solar PV Coal Gas Indicative ranges for LCOE in USA (US$/KWh)
Strictly Private and Confidential 13 Strictly Private and Confidential
9.8% 14.3% 25.3% 38.4% 2012 2015 2018 2022 Declining utility scale PV system costs and higher panel efficiency to further improve cost competitiveness Greater efficiency in installation and commissioning process Already among the lowest cost power sources even without government incentives 10%
Solar share in installed power capacity base (%)
Solar share in annual power additions (%)
Favorable regulatory environment and increasing commitments to combat climate change 6% 3% 2%
Source: IHS Markit (1) China and Japan constitute major countries in rest of world (2) Annual solar PV installations in India, SEA, Middle East, Africa, Europe, USA, Latin America and Australia.
Rapid uptick in the share of solar in the global power generation capacity, annual additions, and global installed power capacity base Strong growth in PV installations in key markets the Company operates in(1) Key advantages and growth drivers of solar Annual PV installations (GW) 2018 2021 2018-21 CAGR India 10.7 15.0 11.7% South East Asia 1.1 5.1 70.6% Middle East and North Africa 4.6 8.4 22.2% Rest of Africa 1.2 3.5 42.0% Europe 10.6 23.4 30.0% USA 10.4 16.7 17.4% Latin America 6.0 7.0 5.4% Australia 4.6 5.9 8.1% Grand Total (excluding Rest of World) 49.1 84.8 20.0% PV can be deployed faster to cover electricity demand gaps in areas with vulnerable electricity systems
Transformation in the global energy landscape with the continued surge of solar
Strictly Private and Confidential 14 Strictly Private and Confidential
Market-share is shifting towards larger solar EPC players with existing capabilities and sound financial strength 1.7% 19.3% Global (ex-China) 2014 2018 Market shares evolution of Top 5 (as in 2018) solar EPC players(1)
Relationships built over time with customers, suppliers, lenders and others Financial strength and bankability Strong track record of on-time project completion and high plant performance Deep understanding of the local markets in which Company operates Design & Engineering capabilities in a cost efficient manner Limiting number of players that meet qualification requirements because of increasing size and complexity
Driven by Key Factors…
With increasing number of projects larger than 100MW being built, as per IHS
(1) Source: IHS Markit; Market share of top 5 global players ex-China of 2018
Strictly Private and Confidential 15 Strictly Private and Confidential
Source: IHS Markit
A significant reduction in battery costs… 960 720 600 420 320 260 255 245 230 220 209 2012 2013 2014 2015 2016 2017 2018 2019 2020 2021 2022 Average Li-ion battery module prices
$/kWh
1.0 2.0 3.7 7.6 12.9 19.9 27.8 37.0 2015 2016 2017 2018 2019 2020 2021 2022 Cumulative PV installations paired with battery energy storage
GW
… is driving the increased adoption of battery energy storage in solar PV plants
Helps to overcome the inherent limitation of solar PV generation with stored energy now being able to be utilized when solar power is not being generated in off-peak times
Higher mix towards solar + storage (from pure solar) also helps in improving realizations for EPC players
Strictly Private and Confidential 16
1
Global solar EPC Leader providing comprehensive end-to-end EPC solutions Fast growing solar market
7
A dedicated design and engineering team focused on innovation and developing efficient technology and engineering solutions
3 4
Strong relationships with customers and other key stakeholders
5
Strong parentage and the ability to leverage the global “SP” brand
6
Highly experienced management team with global operational experience in the solar EPC industry Strong growth and financial performance backed by an asset-light business model
SOLAR
2
Strictly Private and Confidential 17
Key financial metrics (O&M business)
design & engineering team of 154 people
effective structure
Design and Engineering
after thorough due diligence
management procedures
Procurement
including initial factory audit, production process audit and monitoring at vendor’s facility and pre-shipment inspection
Inspection & Audit
testing under the supervision of project manager to ensure new plant is safe and meets design objectives
Construction
monitoring with efficient tracking of under- construction plants
Field quality monitoring O&M service
services for both own customers, and third- party projects
Utility scale solar projects (incl turnkey & BOS) Rooftop solar projects Solar + energy storage O&M service FY19 Revenue from EPC business
FY19 Gross margin
FY17-19 Revenue CAGR
FY19 Revenue from O&M business
FY19 Gross margin
FY17-19 Revenue CAGR
Key financial metrics (EPC business)
Strictly Private and Confidential 18
Ability to mobilize & deploy resources on multiple projects globally through India base
Strong relationship with suppliers due to global execution track record helps sourcing of raw materials at competitive prices
Has facilitated expansion to 26 countries as on date in a quick period of time
Design & engineering and Procurement team based in India Regional presence across 26 countries Significant cost benefits & timely execution Hub-and-Spoke business model driving global expansion through a cost effective India base…
Strictly Private and Confidential 19
High % of repeat customers(4)
24.4% 21.6% India Overall
Site accidents(3) (Loss time frequency rate) High bid conversion rate(2)
with the supply chain & design teams based in India History of timely completion of projects
Installation of 200 MWp in Abu Dhabi within a short timeline of 1 month
Completed a project in the Rajasthan within the scheduled timeline of 4 months despite various challenges
(1) Liquidating Damages related to Performance ratios in FY18 and FY19 in EPC contracts (2) Bid Conversion rate under EPC contracts for FY19. (3) For FY19; Refers to Lost Time Injury Frequency Rate which is the number of lost time injuries occurring in a workplace per 1 million hours worked (6) Total O&M contracts as on 31 March 2019 * Numbers rounded off to nearest whole number, percentages to one decimal place
Strong operating metrics
In India Total capacity till date(5)
Total O&M contracts(6)
(4) Percentage of total commissioned capacity from customers with whom more than one project executed for FY19 (5) Cumulative as of March 31, 2019; Includes 5,271MWp of commissioned capacity and 1,599MWp of under- construction and confirmed contracted capacity.
Sites with performance related LDs (1)
Outside India Projects commissioned
Projects under-construction
Third Party O&M contracts(6)
Strictly Private and Confidential 20
Leading EPC – Solar – Ground Based, 2018 Excellence in Renewable Energy Project Execution Award 2017 Most promising firm and outstanding contribution towards the development of SE, 2014 Project of the Year Award 2017 Solar O&M contractor of the year -Roof top scale, 2017 Immense contribution to the Infrastructure sector, 2016 Intersolar AWARD 2015 (11 MWp Solar Project in Maharashtra under JNNSM PH II) BMGI Energize Indian Power Sector Award in 2014 - Excellence in Solar EPC and Innovation in Solar Energy Solar Today Utility Scale Solar EPC Contractor 2016 Award
Global awards & recognition
Strictly Private and Confidential 21
1
Global solar EPC Leader providing comprehensive end-to-end EPC solutions Fast growing solar market
7
A dedicated design and engineering team focused on innovation and developing efficient technology and engineering solutions
3 4
Strong relationships with customers and other key stakeholders
5
Strong parentage and the ability to leverage the global “SP” brand
6
Highly experienced management team with global operational experience in the solar EPC industry Strong growth and financial performance backed by an asset-light business model
SOLAR
2
Strictly Private and Confidential 22
Value engineering solutions provided through a strong in-house design team with expertise in advanced technologies
Persons strong design & engineering team Innovation & Development
emerging technologies Real-time and predictive analytics
Strong R&D capabilities led by in-house designing and engineering team providing customized unique solutions in various projects
Abu Dhabi 1,177 MWp ‽ How to fit maximum capacity in a given land area with minimum bid criteria of 350MWp ‽ Maximizing electricity generation ‽ To automate and reduce O&M cost Unique installation structure of placing PV modules in east-west
maximize electricity generation Unique 8 high fixed structure design to optimize generation 1,412 robots to create an automated plant to reduce water consumption and operating expenses
Challenges Solutions
Philippines 22.32 MWp ‽ Project site on a riverbed, hence the fear of flooding ‽ Site situated in a high-speed wind zone ‽ Problem of soft & mushy soil Three leg module mounting structure to make the project site flood resistant Combination of concrete ballast foundation & pilling foundation used Outdoor inverter stations on RCC beams to tackle soft, mushy soil Able to mobilize engineers & project managers from India quickly to meet deadlines
Strictly Private and Confidential 23 Strictly Private and Confidential
Overview
Highlights
1,177 MWp
Lowest LCOE bids of USD 2.42 cents / kWh
Bid Winners
Supported by Abu Dhabi Water and Electricity authority
Consortium of Financiers
Bid for 1,177MWp against minimum requirement of 350MWP
Installed 200 MWp within a short timeline
Built with over 5mn accident free safe man hours
One of Lowest tariff globally at the time for any PV plant(1)
Challenges Solutions Fit in maximum capacity in a given land area
(minimum 350 MWp – Bid Criteria) Maximize electricity generation Optimize time & cost Localization Automated and low cost O&M Emerged as the sole winner, offering 1,177 MWp capacity – the world's largest single location solar PV plant(1) Modules installed East to West A unique eight high fixed structure design used to
To optimize time & cost, preference has been to maximize procurements from UAE 1,412 robots used: leading to an automated plant, reduced water consumption and operating expenses Impact
& others
1) Source: CRISIL Research
Strictly Private and Confidential 24
1
Global solar EPC Leader providing comprehensive end-to-end EPC solutions Fast growing solar market
7
A dedicated design and engineering team focused on innovation and developing efficient technology and engineering solutions
3 4
Strong relationships with customers and other key stakeholders
5
Strong parentage and the ability to leverage the global “SP” brand
6
Highly experienced management team with global operational experience in the solar EPC industry Strong growth and financial performance backed by an asset-light business model
SOLAR
2
Strictly Private and Confidential 25
Strong relationship with top global strategic developers Widening customer base with new class of developers like Private Equities Funds Manages the complete supply chain thereby reducing the number of service providers customer has to engage with and optimize solution
Customers / Developers
Strong relationship with a multitude of global lenders - both state-owned and private Lenders rely on SW’s credibility as an EPC player to finance projects Lenders to Developers Strong relationship with world renowned consultants and engineers engaged by developers Their certification provides additional assurance to customers Consultants / Owners’ Engineers Large scale public sector off-takers – Adds high credibility to international track record Helps in timely execution Off- Takers Strong relationship with diversified group of local and global suppliers of modules and other raw materials; critical to supply chain success Helps Company get significant cost benefits in sourcing materials Suppliers
(1) Bid Conversion rate under EPC contracts for FY19 (2) Percentage of total commissioned capacity from customers with whom more than one project executed as of March 31, 2019, numbers rounded off to the nearest whole number
24% 22% India Overall
High bid conversion rate(1) High % of repeat customers(2)
In India
Outside India
Strictly Private and Confidential 26
1
Global solar EPC Leader providing comprehensive end-to-end EPC solutions Fast growing solar market
7
A dedicated design and engineering team focused on innovation and developing efficient technology and engineering solutions
3 4
Strong relationships with customers and other key stakeholders
5
Strong parentage and the ability to leverage the global “SP” brand
6
Highly experienced management team with global operational experience in the solar EPC industry Strong growth and financial performance backed by an asset-light business model
SOLAR
2
Strictly Private and Confidential 27 Strictly Private and Confidential
The Company is capable of rendering EPC knowledge and support for geographies not covered by SP group
Global Access
45
countries presence SP group’s presence in India, Middle East, Africa, APAC, South America and Europe assisted S&W in gaining access and entry SP group has a strong presence in Middle East and Africa Assisted the Company in getting a head-start in establishing operations in these regions
EPC Knowledge Assistance in getting subcontractors, connecting with government authorities, liaising and sometimes, submitting bids
150+
years of experience
S&W gets the benefit of local EPC knowledge due to the presence of the SP group Financial support
Strong financial backing
Support of SP group for non-fund limits to bid for large projects Helps meet certain financing requirements for bidding for projects
SP group’s experience translated into multiple advantages for S&W initially Emerged as a credible solar EPC player globally
Strictly Private and Confidential 28
1
Global solar EPC Leader providing comprehensive end-to-end EPC solutions Fast growing solar market
7
A dedicated design and engineering team focused on innovation and developing efficient technology and engineering solutions
3 4
Strong relationships with customers and other key stakeholders
5
Strong parentage and the ability to leverage the global “SP” brand
6
Highly experienced management team with global operational experience in the solar EPC industry Strong growth and financial performance backed by an asset-light business model
SOLAR
2
Strictly Private and Confidential 29
Bikesh Ogra Director & Global CEO
22+ 22+
Chandra Kishore Thakur COO – International
sector
Corporation, Lanco Infratech, Punj Lyold
33+ 1+
Denotes Total Experience Denotes Experience with S&W group
Kannan Krishnan COO – Solar (India & SAARC)
23+ 10+
Rajneesh Shrotriya Chief Technology Officer
Suzlon Energy, Green Infra, Lanco Solar Energy, etc
23+ 4+
Bahadur Dastoor CFO
Lewes and Kalyaniwalla and Mistry
23+ 8+
Vikas Bansal Head – International Business Development
and sales
10+ 8+
Strictly Private and Confidential 30
1
Global solar EPC Leader providing comprehensive end-to-end EPC solutions Fast growing solar market
7
A dedicated design and engineering team focused on innovation and developing efficient technology and engineering solutions
3 4
Strong relationships with customers and other key stakeholders
5
Strong parentage and the ability to leverage the global “SP” brand
6
Highly experienced management team with global operational experience in the solar EPC industry Strong growth and financial performance backed by an asset-light business model
SOLAR
2
Strictly Private and Confidential 31 1,959 647 5,505 8,516
7.1% 3.9% 8.0% 10.3%
27,394 16,403 68,717 82,404
Strong financial metrics (INR mn)
Revenue from
EBITDA#
Customers provide real estate assets for project
Company takes assets / equipment required for projects on lease basis
Entails low capex and fixed costs Asset light business model…
Short duration contracts with an average life of one year
Advance payment from customers typically
Shorter payment cycle from customers, compared to longer payment cycle to suppliers …with low working capital requirement
1,254 314 4,505 6,382 4.6% 1.9% 6.5% 7.6%
FY16 FY17 FY18 FY19
Diversification of revenue base with international operations increasing from 46% of turnover in FY16 to 70% in FY19
Focus on improving EBITDA margins through benefits of
efficiency from low cost India base
PAT margins have improved due to increase in international
Strong track record of financial performance
Note: Information for FY16 and FY17 pertains to the solar EPC business transferred into the Company subsequently Gross Margin calculated as Revenue from Operations less COGS and Direct Project costs; all numbers are rounded off to the nearest whole number, percentages to one decimal place
Gross Margin*
3,323 2,132 7,527 9,850 12.1% 13.0% 11.0% 12.0%
PAT
(2,399) 1,660 (7,490) 2,335 (8.8%) 10.1% (10.9%) 2.8%
(20.0%) (20,000) – 20,000 Working Capital % of Operating Revenue
Net Working capital
46% 1% 59% 70%
% of international revenues of the operating revenue
ROE 62%
NW calculated as Equity share capital plus other equity (including legal reserve, retained earnings and effective portion of cash flow hedge)
*Gross Margin does not include impact of forex related to project and operations
#EBITDA is after including other income.
ROE 118%
Strictly Private and Confidential 32 Strictly Private and Confidential
India 30.2% Africa 8.2% SEA 9.6% America 4.3% MENA 47.7% Australia 0.1%
India 100.0% India 17.2% MENA 82.8% India 24.8% Africa 15.9% America 4.6% MENA 54.8%
Order book(1) break-up by geography over the years
INR 3,608 mn INR 73,441 mn INR 73,312 mn
EPC + O&M Revenue break-up by geography over the years
(1) Order book, defined as the value of solar power projects for which the Company has entered into definitive EPC contracts minus the revenue already recognized from those projects, is INR 38,316mn as of March 31, 2019.
Letter of Intents (LOIs), defined as solar power projects for which the Company has won bids but has not executed definitive EPC contracts, is INR 39,082mn as of March 31, 2019. * all numbers are rounded off to the nearest whole number, percentages to one decimal place
FY16 FY17 FY18 FY19 Order Book + LOIs(1)
India 99.4% Africa 0.4% SEA 0.2% India 54.3% Africa 32.7% SEA 13.1% India 40.9% Africa 1.1% SEA 0.0% America 0.1% MENA 57.9%
FY16 FY17 FY18 FY19
INR 27,394 mn INR 16,400 mn INR 68,714 mn INR 82,388 mn INR 77,398 mn
India 11.8% Africa 12.0% SEA 7.9% US & LATAM 26.2% MENA 20.0% Europe 22.1%
Strictly Private and Confidential 33 Strictly Private and Confidential
Strictly Private and Confidential 34
Maintain market leadership through strategic expansion of
Grow our customer base and maintain relationships with
Increase operational & financial efficiency Expand product offerings - O&M, rooftop solar EPC and solar storage solutions
Pro-active identification of potential upcoming solar opportunities
Sets up presence to conduct market diligence and bid for projects
Ensures market preparedness well before projects actually come up for bidding In-depth & pro-active approach to strategically enter markets with conducive solar policies and solar resources
In-house regional team monitoring various regions helps identify arising
physical presence
Provides ability to mobilize resources & undertake projects on one-off basis in countries without making permanent investments Ability to tap opportunities arising in certain countries
Co-development model in certain regions (such as USA , Europe, Australia, etc.) by making certain equity investments in projects to acquire EPC contract
Entering new market by acquisitions or partnerships with local players Co-development & strategic partnership to enter other key markets
Well planned geographical expansion strategy
Strictly Private and Confidential 35
A bankable player with strong relationships with customers and other key stakeholders Strong in-house team of 154 design and engineering people providing customized solutions Leveraging the low-cost India base for global execution providing cost competitive solutions Quick decision making & well-defined internal processes leading to timely execution Strong track record of executing complex & large scale EPC projects leading to high customer retention and repeat business One of the only global pure-play solar EPC players with a significant presence and operational experience across geographies
1 3 4 5 2 6
Strictly Private and Confidential 36 Strictly Private and Confidential
Strictly Private and Confidential 37 Strictly Private and Confidential
Decline in FY17 revenue due to decrease in EPC revenue from international projects – 90MWp project in South Africa and 51MWp project in Philippines substantially completed in FY16 – However, no EPC revenue recognized from any new international projects in FY17 In FY18, international EPC revenue recognized from mainly 4 projects – 1,177MW Abu Dhabi and 175MWp Morocco projects – Increase in finance cost in FY18 mainly due to buyer’s credit taken for imported modules for Abu Dhabi project and projects in India – Effective tax rate declined in FY18 due to significant increase in international revenue and lower tax rate in international geographies such as the UAE, which is the Company’s global headquarters FY19; revenue from operations increased by 19.9% y-o-y primarily due to a significant increase in EPC revenue from South East Asia, Africa and United States of America and Latin America – A total of 19 EPC projects were executed across 10 countries in FY19; EPC revenues recognized for the first time from Australia – O&M revenues jumped 113.9% y-o-y to INR 936 mn in FY19 – Improvement in EBITDA Margins due to operating leverage and efficiency in operations – Increase in finance cost of INR 846 mn was offset by the interest income of INR 1,597 mn from related parties
(1) Information for FY16 and FY17 pertains to the solar EPC business transferred into the Company subsequently. *Gross Profit does not include impact of forex related to project and operations; all numbers are rounded off to the nearest whole number, percentages to one decimal place
Key Highlights
FYE March 31 (INR mn) FY16 FY17 FY18 FY19 Revenue from operations 27,394 16,403 68,717 82,404 Growth % (40.1%) 318.9% 19.9% Direct Expenses 24,071 14,271 61,190 72,554 Gross Profit 3,323 2,132 7,527 9,850 Gross margin % 12.1% 13.0% 11.0% 12.0% Overheads 1,435 1,583 2,150 3,429 Other income 70 98 127 2,095 EBITDA 1,959 647 5,505 8,516 EBITDA margin % 7.1% 3.9% 8.0% 10.3%
9 16 32 78 EBIT 1,949 631 5,473 8,438 EBIT margin % 7.1% 3.8% 7.9% 10.0% PBT 1,943 603 5,287 7,592 PBT Margin % 7.1% 3.7% 7.7% 9.2% Tax expense 689 289 781 1,209 Tax rate % 35.5% 47.9% 14.8% 15.9% PAT 1,254 314 4,505 6,382 PAT Margin % 4.6% 1.9% 6.5% 7.7%
Strictly Private and Confidential 38 Strictly Private and Confidential
Asset light model with low fixed assets and nominal capital investments
–
Customers provide real estate assets for projects
–
Company takes assets / equipment required for projects on a lease basis
–
Entails low capex and fixed investments
Low working capital requirements due to low inventory
requirement, short duration of contracts with an average life of one year, and nature of payment cycle of customers and suppliers
–
Advance payment from customers typically
–
Shorter payment cycle from customers, compared to longer payment cycle to suppliers Borrowings in FY17 and FY18 mainly on account of buyer’s credit taken for import of raw materials Borrowings at end of FY19 increased substantially on account of restructuring due to the Demerger whereby the Company increased debt and extended loans and advances to the group company
Key Highlights
(1) Information for FY16 and FY17 pertains to the solar EPC business transferred into the Company subsequently. *all numbers are rounded off to the nearest whole number, percentages to one decimal place
FYE March 31 (INR mn) FY16 FY17 FY18 FY19 Assets Non current assets 82 208 416 672 Tangible assets (incl. CWIP) 61 76 231 265 Intangible assets 6 9 10 49 Deferred tax assets (net) 10 111 110 321 Other non current assets 5 12 64 36 Current assets 7,051 10,577 48,788 53,247 Inventories 13 149 186 131 Trade receivables 4,683 6,480 18,215 19,002 Cash & cash eq. & bank balances 309 109 1,041 4,545 Loans 16 28 94 19,534 Other current & financial assets 2,029 3,811 29,253 10,034 Total assets 7,132 10,785 49,204 53,919 Equity and Liabilities Shareholders’ funds (769) 566 1,939 8,375 Non current liabilities 11 32 56 86 Provisions 11 32 56 86 Current liabilities 7,891 10,187 47,209 45,458 Borrowings 3 3,151 1,841 22,278 Trade payables 6,738 4,629 37,398 19,125 Derivatives 32 194 104
321 379 552 769 Other current & financial liabilities 796 1,836 7,314 3,286 Total equity and liabilities 7,132 10,785 49,204 53,919
Strictly Private and Confidential 39
0% 20% 40% 60% 80% 100% Month 1 Month 2 Month 3 Month 4 Month 5 Month 6 Month 7 Month 8 Month 9 Month 10 Month 11 Cash inflow Cash outflow Cumulative cash inflow Cumulative cash outflow
Advance received from the developer Regular cash inflow and
Cumulative cash inflow is > cumulative cash outflow throughout the project Negative working capital cycle Overall Profit on the Project
Net Working capital (INR mn) Low working capital requirements due to asset light model, short duration of contracts and nature of payment cycles − Advance payment from customers typically − Longer payment cycle to suppliers Slightly positive working capital in FY19 relates to reduction in vendor days and lower customer advances mainly on account of delay in non- fund limit split on demerger FYE March 31 (INR mn) FY16 FY17 FY18 FY19 Current Assets 5,110 8,096 36,841 23,770 Inventories 13 149 186 131 Trade receivables (incl. unbilled) 4,954 7,543 31,564 22,507 Advances to suppliers 142 404 5,091 1,131 Current Liabilities 7,509 6,436 44,332 21,434 Trade payables `6,738 4,626 37,398 19,125 Advances from customers 771 1,810 6,934 2,309 Net Working Capital (2,399) 1,660 (7,490) 2,335
*all numbers are rounded off to the nearest whole number
Strictly Private and Confidential 40 Strictly Private and Confidential
* during the Fiscal ended March 31, 2019, receivables from related party amounting to `10,298.76 million have been converted into loan (1) Information for FY16 and FY17 pertains to the solar EPC business transferred into the Company subsequently. | all numbers are rounded off to the nearest whole number
FYE March 31 (INR mn) FY16 FY17 FY18 FY19 (A) Cash flow from operating activities Profit before tax 1,943 603 5,287 7,592 Adjustments for non cash items 15 134 275 (434) Operating profit before working capital changes 1,958 737 5,562 7,158 Working capital adjustments (1,315) (3,914) (2,265) (13,382) Cash flows generated from operating activities 643 (3,176) 3,297 (6,225) Income tax (paid) (net) (38) (5) (774) (1,056) Effects of exchange differences (7) (5) (12) 47 Net Cash flows generated from operating activities (A) 598 (3,186) 2,511 (7,233) (B) Cash flow from investing activities Capital expenditure (65) (34) (181) (85) Interest received 27 11 6 46 Loans given (net of received) to related parties* – – – (9,056) Purchase of fixed deposits – – (17) (189) Others (9) 2 5 (4) Net Cash flows generated from investing activities (B) (47) (21) (187) (9,288) (C) Cash flow from financing activities Borrowings / loans received / (repaid) (542) 3,271 (1,310) 20,434 Interest paid (6) (28) (97) (712) Others – – (3) – Net Cash flows generated from financing activities (C) (549) 3,243 (1,410) 19,722 Net movement in currency translation (D) – (0) 2 46 Net increase in cash and cash equivalents (A+B+C+D) 2 36 915 3,247 Cash and cash equivalents of subsidiaries acquired – – 39 6 Cash and cash equivalents at the beginning of the period – 2 – 955 Cash and cash equivalents at the end of the period 2 38 955 4,208
Strictly Private and Confidential 41 Strictly Private and Confidential