SLIDE 1
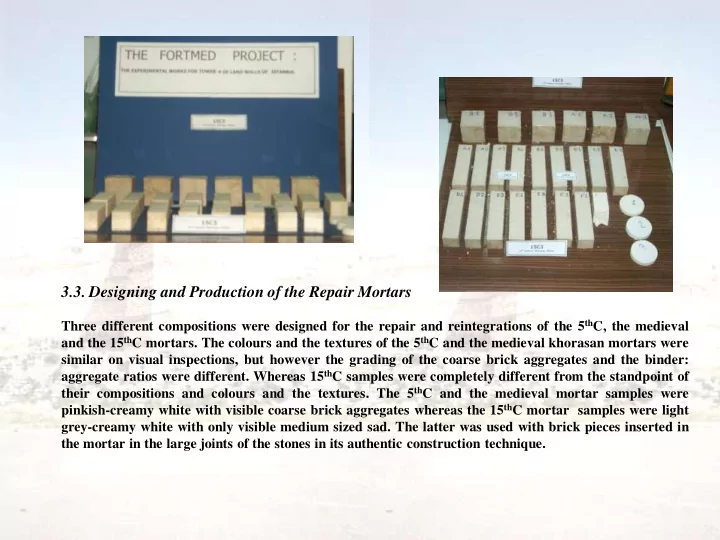
3.3. Designing and Production of the Repair Mortars
Three different compositions were designed for the repair and reintegrations of the 5thC, the medieval and the 15thC mortars. The colours and the textures of the 5thC and the medieval khorasan mortars were similar on visual inspections, but however the grading of the coarse brick aggregates and the binder: aggregate ratios were different. Whereas 15thC samples were completely different from the standpoint of their compositions and colours and the textures. The 5thC and the medieval mortar samples were pinkish-creamy white with visible coarse brick aggregates whereas the 15thC mortar samples were light grey-creamy white with only visible medium sized sad. The latter was used with brick pieces inserted in the mortar in the large joints of the stones in its authentic construction technique.
SLIDE 2 Fifteen trial mixes for the 5thC samples, 9 trial mixes for the medieval samples and 6 trial mixes for the 15thC samples were designed, produced and casted in 4/4/16 steel moulds. After fixing the binder : aggregate ratios, the amount of the fine aggregates were adjusted for determining the colour of the lime paste. The binder was always slaked lime and ground volcanic tuff mixed in 3:1 ratio. The aggregates were crushed brick and powder and river sand mixed in the ratios of the original sample. The original ratios of the crushed brick and the river snd were determined by means of evaluation of the data derived from the acid loss and sieve analysis, and petrographic analysis of the original samples. The amounts were slightly corrected according to the standard grading (ASTM C 144-99 and TSE 706). Before the commencement of the preparation of the samples, the aggregates were sieved and grouped according to mesh sizes and their bulk densities and specific gravities were calculated. In total 72 samples were prepared for each period making sum of 216 samples which will be conducted to the tests to determine their physical and mechanical properties after curing periods of one month, three months and six months. The samples were programmed to be cured in tightly sealed polyethylene bags at 23 A2oC and in 90-100% RH for 6 months. The only additive which was used was a water reducer (Melment F10, YKS, %0,1 in water). The mortar mixes were mixed by hand untill a homogenous mixture was obtained and vibrated for 15
- seconds. The initial setting time was 48 hours for all of the sample groups.
SLIDE 3 3.3.1. Properties of the Raw Materials Used in the Trial Mixes
Lime : The water content of the slaked lime was 45 % and this was converted CaO to match the
- riginal binder amount. The lime consisted of 37.90 % Ca(OH)2.
Pozzolana: The pozzolana (ground tuff) which was taken from Konya, was used for the trial mixes. The ratio of the pozzolana : slaked lime was accepted as 1:3 in regard to the mechanical properties of the
- iginal samples. The chemical composition of the pozzolana was given in the Table 3.5.
Table 3.5. The results of the chemical analysis of the pozzolana (ground volcanic tuff of Konya, Central Anatolia, Turkey) (*)
8.04 2.13 0.80 0.17
2.39 10.86 68.10
Seydiþehir Aluminium Factory Chemistry Lab.
0.40 4.93 0.0 11.92 86.45
2.07
0.08 0.23 3.77 9.41 65.01
Technical University of Ýstanbul, Faculty
Mining AN SM HM L01 SUM AZ SO4 K2O TiO2 Na2O MgO CaO Al2O3 Fe2O3 SiO2 Name of the Lab.
SLIDE 4
Table 3.6. The results of the XRD Analysis of the volcanic tuff of Konya (I.T.U. Material Science Laboratory of the Faculty of Chemistry and Metallurgy, Dmax-1000 X-Ray Diffractometer) (*)
29-85 SiO2 Silicon Oxide 33-1161 SiO2 Quartz 22-827 KFe3(SO4)2(OH)6 Jarosite ASTM Card No Chemical Formula Mineral Type
Table 3.7. Evaluation of the results of the XRD Analysis and Minerological Analysis (I.T.U., Faculty of Mines, Department of Mineralogy) (*)
62 38 40 100 0,0 211 Passed (g) Retained (g) Mesh Size (µ)
Figure 3.56. SEM micrograph of the Konya volcanic tuff dust, quartz crystal on the right. (Tuff dust is composed of fines around 3-5 microns size) Figure 3.57. EDX diagram of the Konya Volcanic tuff
SLIDE 5
Pozzolanic Activity Test :
Table 3.8. Compressive strengths of the samples after 1, 2 weeks and a month 20.06 99.000 7/7/7 1 month Sample 3 20.96 104.000 7/7/7 2 weeks Sample 2 19.63 97.400 7/7/7 1 week Sample 1 Compressive Strength (MPa) Compression Stress (N) Dimensions (cm) Curing Time The Samples Table 3.9. Tensile strengths of the samples after 1, 2 weeks and a month 6.05 1730 4/4/16 1 month Sample 3 5.86 1650 4/4/16 2 weeks Sample 2 4.85 1380 4/4/16 1 week Sample 1 Tensile Strength (MPa) Tensile Stress (N) Dimensions (cm) Curing Time The Samples
SLIDE 6 The grading of the aggregates of the 5th century mortar sample
3 7 12 21 36 60 100 5 11 20 33 50 76 100 8 20 32 42 56 76 100 18 34 49 62 74 88 100 10 20 30 40 50 60 70 80 90 100 0.25 0.5 1 2 4 8 16
mesh size (mm) Percentage of passed (%)
A 5C B C
The grading of the aggregates for the repair mortar to match the medieval samples
3 7 12 21 36 60 100 3 9 18 33 55 84 100 8 20 32 42 56 76 100 18 34 49 62 74 88 100 10 20 30 40 50 60 70 80 90 100 0.25 0.5 1 2 4 8 16
mesh size (mm) Percentage of passed (%)
A M B C
Mix design for the repair mortar to match the 5th century khorasan mortar ;
Sample Code = 5C1-5C2-5C3 (1 month-3 months-6 months old) Binder : Aggregate = 1:2 Slaked Lime: Puzzolana = 3:1 Crushed Brick = 40 % of the total agg. River Sand = 60 % of the total agg.
Mix design for the repair mortar to match the medieval khorasan mortar ;
Sample Code = M1-M2-M3 (1 month-3 months-6 months old) Binder : Aggregate = 1:2 Slaked Lime: Puzzolana = 3:1 Crushed Brick = 67 % of the total agg. River Sand = 33 % of the total agg. The grading of the aggregates for the repair mortar to match the 15th century mortar
8 20 34 60 100 7 32 53 74 100 15 35 57 77 100 25 45 67 85 100 10 20 30 40 50 60 70 80 90 100 0.25 0.5 1 2 4
mesh size (mm) Percentage of passed (%)
A 15C B C
Mix design for the repair mortar to match the 15th century khorasan mortar ;
Sample Code = 15C1-15C2-15C3 (1 month-3 months-6 months old) Binder : Aggregate = 1:3 Slaked Lime: Puzzolana = 3:1 Crushed Brick = 2.35 % of the total agg. River Sand = 97.65 % of the total agg.
SLIDE 7
Sample Codes 1 Month Old 3 Months Old 6 Months Old 5th Century 5C1 5C2 5C3 Medieval Age M1 M2 M3 15th Century 15C1 15C2 15C3
Table 3.10. Sample code system for the repair mortars prepared in the laboratory of
Material Testing of the Faculty of Architecture, I.T.U. The tests for the determination of the physical and mechanical properties will be conducted on the samples as the ageing tests after 30, 90 and 180 days. Porosimetry (pore size distribution of the repair mortars will be determined after 180 days). All of the samples were casted in 4/4/16 cm. steel moulds , except the samples which were prepared and cured for the compressive which were 7/7/7 cm. dimensioned cubes.
SLIDE 8 The tests conducted on the repair mortars for the determination of their physical and mechanical properties :
Water Vapour Transmission . Water Absorption (by volume) . Composity Porosity Saturation Degree Water Absorption in Boiled Water (by volume) Density Specific Gravity Water Absorption (by weight) Coefficient of Capillarity Water Absorption (by weight) Water Absorption (by volume) Water Absorption in Boiled Water (by weight)
Compressive Strength Tensile Strength Young’s Modulus
- II. Mechanical Properties:
Freeze-Thaw Cycles Crystallisation Cycles
The tests conducted on the repair mortars :
3.3.3. Experimental Works for the Repair Mortars
Shrinkage Adherence Strength Porosimetry
SLIDE 9 3.3.3.1.Qualitative and Semi- Quantitative Analysis of the Water-Soluble Salts of the Repair Mixes
Table 3.11. The results of the quantitative analysis of the water soluble salts and the conductivity tests
Conductance (ms) 348 1097 1481 123 1556 1786 72 1497 974 NO3
++ ++ ++ ++ ++ ++ + + + Sample 5C1 5C2 5C3 M1 M2 M3 15C1 15C2 15C3
3.3.3.2. The Micro and Macro Analysis of the Repair Mortars
- Petrology of the repair mortars of 5th Century after 3 and 6 months of curing time:
- Fig. 3.58. General structure of phase between
aggregate and binder of the repair mortar for 5thC. after 6 months of curing time
- Fig. 3.59. The binding phase between two aggregates
- f the repair mortar of 5thC. after 6 months of curing
time
SLIDE 10
- Fig. 3.60. The adhesion between the crushed
brick and the binder of the repair mortar of
- 5thC. after 6 months of curing time
- Fig. 3.61. Binder , coarse aggregates (quartz
and brick pieces) fine aggregates (tuff dust)
- Fig. 3.62. General structure of the repair
mortar
- f 5thC. after 3 months of curing
time
- Fig. 3.63. A piece of tuff in the dusty form of
repair mortar of 5thC. after 3 months of curing time
SLIDE 11
- Petrology of the repair mortars of medieval age after 3 and 6 months of curing time:
- Fig. 3.64. General structure of the medieval
repair mortar after 6 months of curing time
- Fig. 3.65. Small feldspar particles in the matrix
- f the medieval repair mortar after 6 months of
curing time
- Fig. 3.66. The binder and the crushed brick
particles in the matrix of the medieval repair mortar after 3 months of curing time
- Fig. 3.67. General binding texture of the
medieval repair mortar after 3 months of curing time
SLIDE 12
- Petrology of the repair mortars of 15th Century after 3 and 6 months of curing time:
- Fig. 3.68. General distribution of the aggregates
(quartz and feldspar) and the binding phase of the repair mortar of 15thC after 6 months
curing time
- Fig. 3.69. The adhesion between the aggregates
(quartz and feldspar) and the binder of repair mortar of 15thC. after 6 months of curing time
- Fig. 3.70. General structure of the repair
mortar of 15thC. after 3 months of curing time
- Fig. 3.71. The tuff particles in the general structure
- f the repair mortar of 15thC. after 3 months of
curing time
SLIDE 13
Results of the visual, macro and micro inspections and SEM-EDX analysis of the repair mortars The repair mortar of 5th Century;
Figure 3.72. The macro structure of 5thC. mortar and silicate formation at the interstice of the brick piece Figure 3.73. Quartz and brick particles in the lime paste Figure 3.74. The adhesion between the aggregate and the binder Figure 3.75. The adhesion between the brick particle and lime paste and the silicate formation at the interstice of the brick aggregate and the lime paste Figure 3.76. The micro crack in the lime paste and the secondary crystallisation in it
SLIDE 14 Figure 3.77. Secondary nanometer sized crystals in the lime paste, (magnification of X 3500) Figure 3.78. The micro structure of the lime paste, gel formation in the binder Figure 3.79. The adherence of the quartz and the matrix was poor due to the almost non
micro structure of the quartz aggregate
SLIDE 15
Al2O3 (tuff dust) Si Ca Al Brick Lime
Linescan displays of 5thC. repair mortars ;
CaO.SiO2.Al2O3 gel formation Quartz Lime Lime Si Ca Al S Si Ca
Figure 3.80. Linescan from the right (tuff dust cumulation) towards left (to the matrix), sulphour, silicone and the calcium peaks, at the interstice, calcium diffusion was detected in the tuff dust
SLIDE 16 The repair mortar for the medieval parts ;
CaO.SiO2.Al2O3 Si Ca Al CaO.SiO2 Lime Lime
Figure 3.85. Linescan display of M3 (medieval) repair mortar Figure 3.81. The macro structure of the medieval repair mortar . Quartz and brick particles in the matrix Figure 3.82. The adhesion between the aggregates and the lime paste Figure 3.83. The micro structure
interstice Figure 3.84. The micro structure of the matrix
SLIDE 17
The 15th Century Repair Mortar ;
Figure 3.86. The macro structure of 15th century repair mortar. Quartz and brick and volcanic tuff particles in the matrix Figure 3.87. Quartz and brick and volcanic tuff particles in the lime paste Figure 3.88. The adhesion between the aggregate and the binder and the shrinkage cracks Figure 3.89. The micro structure of the lime paste and the interstice of the brick aggregate
SLIDE 18 Figure 3.90. The micro structure
Figure 3.91. The micro structure
Figure 3.92. The adhesion at the tuff dust cumulation and the binder interstice, the binder at the left and the tuff dust cumulation at the right Figure 3.94. The tuff dust cumulation and the silicate formation in the matrix and the aggregates in the binder Figure 3.93. Brick piece (on the left), and the binder, the adhesion seems to be perfect
SLIDE 19
Linescan displays of 15th Century repair mortars ;
Si Ca Al Si Ca Al S Si Ca Quartz Quartz Brick Lime Lime Lime Lime Aggregate
Figure 3.95. From the left to the right , sulphour , silicone and calcium peaks, the transition zone at the interstice of the brick piece and the binder was exhibited in a diffusion profile
SLIDE 20 3.3.3.3. Determination of the Physical Properties of the Repair Mortars
Figure 3.96. The water absorption capacity test of the repair mortar samples Figure 3.97. The water vapour transmission test of the repair mortar samples The physical properties tests conducted on the repair mortar samples of the Tower T4
- f the landwalls of Istanbul. The tests were conducted according to TSE 699 (ASTM
C97-96, ASTM C20-92, ASTM C 121-90, ASTM E 12-70). % 2.35 - %97.65 % 67 - %33 % 40 - %60 Crushed Brick / RiverSand 3 / 1 3 / 1 3 / 1 Slaked Lime : Pozzolana 1 / 3 1 /2 1 / 2 Binder : Aggregate 15th Century Medieval 5th Century Mixes of Repair Mortars
SLIDE 21
0.4 23.28 0.4 18.95 0.4 20.14 Water Vapour Diffusion Resistance Factor (µ) 0.2 92.74 0.0 100 0.2 99.46 Saturation Degree (%) 0.2 35.97 0.3 41.90 0.2 40.75 Porosity (%) 0.2 64.03 0.3 58.10 0.2 59.25 Compasity (%) 0.0 2.44 0.0 2.34 0.0 2.33 Specific Gravity (g/cm3 ) 0.0 1.57 0.0 1.35 0.0 1.37 Density (g/cm3 ) 0.2 37.51 0.3 47.52 0.3 44.77 Water Absorption in (%) Boiling Water (by volume) 0.1 23.74 0.3 35.50 0.3 32.61 Water Absorption in (%) Boiling Water (by weight) 0.2 33.09 0.2 41.90 0.3 40.53 Water Absorption (by volume) (%) 0.2 21.02 0.2 31.48 0.3 29.47 Water Absorption (by weight) (%) 0.2x10⁻⁴ 0.9x10⁻⁴ 0.1x10⁻⁴ 2.4x10⁻⁴ 0.1x10⁻⁴ 1.5x10⁻⁴ Coefficient of Capillarity (g/mm2vs) Standard Deviation 15C1 Standard Deviation M1 Standard Deviation 5C1 The Average Values of the Physical Properties
Table 3.12. The results for the physical properties of the 5thC., medieval and 15thC. repair mortars after 1 month curing time
SLIDE 22
Table 3.13. The results for the physical properties of the 5th C., medieval and 15thC. repair mortars after 3 months curing time
0.4 28.82 0.4 20.25 0.4 22.76 Water Vapour Diffusion Resistance Factor (µ) 0.2 95.52 0.0 100 0.0 100 Saturation Degree (%) 0.3 33.84 0.3 40.62 0.2 38.97 Porosity (%) 0.3 66.16 0.3 59.38 0.2 61.03 Compasity (%) 0.0 2.44 0.0 2.34 0.0 2.33 Specific Gravity (g/cm3 ) 0.0 1.61 0.0 1.37 0.0 1.43 Density (g/cm3 ) 0.2 36.80 0.2 46.06 0.2 43.98 Water Absorption in (%) Boiling Water (by volume) 0.1 22.77 0.1 33.39 0.2 31.21 Water Absorption in (%) Boiling Water (by weight) 0.1 32.32 0.2 41.61 0.3 39.94 Water Absorption (by volume) (%) 0.3 20.00 0.2 30.29 0.3 27.96 Water Absorption (by weight) (%) 0.1x10⁻⁴ 1.7x10⁻⁴ 0.1x10⁻⁴ 2.4x10⁻⁴ 0.2x10⁻⁴ 2.1x10⁻⁴ Coefficient of Capillarity (g/mm2vs) Standard Deviation 15C2 Standard Deviation M2 Standard Deviation 5C2 The Average Values of the Physical Properties
SLIDE 23
Table 3.14. The results for the physical properties of the 5thC., medieval and 15thC. repair mortars after 6 months curing time
0.5 30.25 0.5 24.65 0.5 25.82 Water Vapour Diffusion Resistance Factor (µ) 0.2 97.59 0.0 100 0.0 100 Saturation Degree (%) 0.2 33.20 0.3 40.17 0.2 38.62 Porosity (%) 0.2 66.80 0.3 59.83 0.2 61.37 Compasity (%) 0.0 2.44 0.0 2.34 0.0 2.33 Specific Gravity (g/cm3 ) 0.0 1.63 0.0 1.40 0.0 1.43 Density (g/cm3 ) 0.2 36.08 0.2 44.96 0.2 43.85 Water Absorption in (%) Boiling Water (by volume) 0.1 20.06 0.2 31.77 0.3 30.55 Water Absorption in (%) Boiling Water (by weight) 0.1 32.40 0.1 41.07 0.2 40.31 Water Absorption (by volume) (%) 0.2 19.85 0.1 29.17 0.3 28.10 Water Absorption (by weight) (%) 0.2x10⁻⁴ 1.7x10⁻⁴ 0.1x10⁻⁴ 1.7x10⁻⁴ 0.1x10⁻⁴ 1.6x10⁻⁴ Coefficient of Capillarity (g/mm2vs) Standard Deviation 15C3 Standard Deviation M3 Standard Deviation 5C3 The Average Values of the Physical Properties
SLIDE 24 5,00E-05 1,00E-04 1,50E-04 2,00E-04 2,50E-04 1 2 3 4 5 6 7 M onths Coefficient of Capillarity (g/mm2 ?s)
5C M 15C
15 20 25 30 35 1 2 3 4 5 6 7 Months Water Absorption (by weight %) 5C M 15C
30 35 40 45 1 2 3 4 5 6 7 Months Water Absorption (by volume %) 5C M 15C
% 2.35 - %97.65 % 67 - %33 % 40 - %60 Crushed Brick / RiverSand 3 / 1 3 / 1 3 / 1 Slaked Lime : Pozzolana 1 / 3 1 /2 1 / 2 Binder : Aggregate 15th Century Medieval 5th Century Mixes of Repair Mortars
The graph of Coefficient of Capillarity (g/mm2 ãs) The graph of Water Absorption ( by weight) (%) The graph of Water Absorption (by volume) (%)
SLIDE 25 30 35 40 45 50 1 2 3 4 5 6 7 Months Water Absorption in Boil. Water (by volume % ) 5C M 15C 1,3 1,35 1,4 1,45 1,5 1,55 1,6 1,65 1 2 3 4 5 6 7 Months Density (g/cm
3)
5C M 15C 15 20 25 30 35 40 1 2 3 4 5 6 7 Months Water Absorption in Boil. Water (by weight % ) 5C M 15C
2,25 2,3 2,35 2,4 2,45 2,5
Specific G ravity (g/cm
3)
5C M 15C R epair Mortar Samples
% 2.35 - %97.65 % 67 - %33 % 40 - %60 Crushed Brick / RiverSand 3 / 1 3 / 1 3 / 1 Slaked Lime : Pozzolana 1 / 3 1 /2 1 / 2 Binder : Aggregate 15th Century Medieval 5th Century Mixes of Repair Mortars
The graph of Water Absorption in Boiling Water (by weight) (%) The graph of Water Absorption in Boiling Water (by volume) (%) The graph of Density (g/cm3) The graph of Specific Gravity (g/cm3)
SLIDE 26
55 60 65 70 1 2 3 4 5 6 7 M onths
Compasity (%
5C M 15C 30 35 40 45 1 2 3 4 5 6 7 Months
Porosity (%)
5C M 15C 90 95 100 105 1 2 3 4 5 6 7 Months Saturation Degree (%) 5C M 15C 15 20 25 30 35 2 4 6 8 Months Water Vapour Diffusion Resistance Factor 5C M 15C
% 2.35 - %97.65 % 67 - %33 % 40 - %60 Crushed Brick / RiverSand 3 / 1 3 / 1 3 / 1 Slaked Lime : Pozzolana 1 / 3 1 /2 1 / 2 Binder : Aggregate 15th Century Medieval 5th Century Mixes of Repair Mortars
The graph of Compasity (%) The graph of Saturation Degree (%) The graph of Porosity (%) The graph of Water Vapour Diffusion Resistance Factor
SLIDE 27
Porosimetry of the original mortars and repair mortars ;
0.0534 0.2829 0.1059 Mortar 14 (15thC) 0.1065 0.4180 0.1880 Mortar 16 (Medieval) 0.0979 0.3106 0.2579 Mortar 4 (Medieval) 0.0383 0.1006 0.3165 Mortar 3 (Medieval) 0.0704 0.3409 0.2151 Mortar 10 (5thC) 0.1440 0.7010 0.1714 Mortar 9 (5thC)
Original Mortars
0.0327 0.2661 0.1931 15C3 (6 mnths) 0.0725 0.5379 0.2018 15C2 (3 mnths) 0.0334 0.0579 0.2955 M3 (6 mnths) 0.0873 0.5846 0.2964 M2 (3 mnths) 0.0298 0.0517 0.2580 5C3 (6 mnths) 0.0725 0.5561 0.2242 5C2 (3 mnths)
Repair Mortars
Average Pore Diameter (ìm) Average (Median) Pore Diameter (ìm) (PoreVolume) Total Pore (ml/g) Sample
Micropores r < 0.001 μm (<10 Ao), Mesopores r = 0.001-0.0025 μm (10 Ao-250 Ao) Macropores r > 0.025 μm (>250 Ao) Table 3.15. The results of porosimetry tests
SLIDE 28
0.035 0.045 0.040
Figure 3.98. The pore size distribution graphics of (a) repair mortar 5C2 (3 months), (b) repair mortar 5C3 (6 months), (c) original mortar M9 (5thC), (d) original mortar M10 (5thC)
0.018 0.014 0.014 0.022
(a) Repair Mortar of 5th C. (3 months) (b) Repair Mortar of 5th C. (6 months) (c) Original Mortar of 5th C. (d) Original Mortar of 5th C.
SLIDE 29 0.032
- Figure. 3.100. The pore size distribution graphs of (a) repair mortar M2 (3 months), (b) repair
mortar M3 (6 months), (c) original mortar M3 (medieval), (d) original mortar M16-17 (medieval)
0.030 0.024 0.050 0.064 0.040 0.022
(a) Repair Mortar of Medieval (3 months) (b) Repair Mortar of Medieval (6 months) (c) Original Mortar of Medieval (d) Original Mortar of Medieval
SLIDE 30 0.012 0.022 0.032 0.016 0.008
(a) Repair Mortar of 15th C. (3 months)
- Figure. 3.101. The pore size distribution graphics of (a) repair mortar 15C2 (3 months),
(b) repair mortar 15C3 (6 months), (c) original mortar M14 (15thC) (b) Repair Mortar of 15th C. (6 months) (c) Original Mortar of 15th C.
SLIDE 31 The tests were conducted on the samples which were conditioned at the oven at 105oC to constant mass and on the humid samples, and the moisture contents of the humid samples
- Fig. 104. “M1”, the result of the compressive test
- Fig. 105. “5C1”, the result of the compressive
3.3.3.4. Determination of the Mechanical Properties of the Repair Mortars
- Fig. 102. The universal press for determination
- f compressive strength of the samples
- Fig. 103. The universal press for determination
- f tensile strength of the samples
SLIDE 32
- Fig. 108. “5C1”, the result of the tensile test
- Fig. 109. “15C1” , the
result of the compressive test
- Fig. 107. “M1”, the result of the tensile test
- Fig. 106. “15C1” ,
the result of the compressive test
SLIDE 33
- Fig. 3.110. The repair mortars on
the medieval brick surface
- Fig. 3.111. The pull-off test method
- Fig. 3.112. The tester pulling off the
mortars from the brick surface
- Fig. 3.113. The end of the pull-off
testing
SLIDE 34
Table 3.16. The mechanical properties of the repair mortars to match the 5thC, medieval, and the 15thC mortar samples after curing 1 month, 3 months and 6 months
0.1 48*10+4 0.2 3.7 0.2 6.5 15C3 (6 months) 0.01 0.46% 0.02 0.33 0.2 46*10+4 0.1 2.4 0.2 5.8 15C2 (3 months) 0.2 34*10+4 0.2 1.1 0.3 4.5 15C1 (1 month) 0.0 32*10+4 0.2 2.5 0.2 5.8 M3 (6 months) 0.02 0.42% 0.0 0.08 0.2 29*10+4 0.1 1.4 0.3 4.2 M2 (3 months) 0.1 19*10+4 0.1 0.5 0.0 1.4 M1 (1 month) 0.1 32*10+4 0.2 2.6 0.2 7.3 5C3 (6 months) 0.01 0.13% 0.04 0.18 0.2 34*10+4 0.1 1.9 0.3 5.5 5C2 (3 months) 0.2 17*10+4 0.0 0.3 0.0 1.5 5C1 (1 month) Std. Dev. Shrinkage Std. Dev. Adherence (MPa) Std. Dev. Ultrasound E-Modulus (MPa) Std. Dev. Tensile Strength (MPa) Std. Dev. Compress. Strength (MPa) The Samples
The values were evaluated from the tests which were conducted on oven dried samples. The values of adherence were determined by pull-off testing method.
SLIDE 35
Table 3.17. The mechanical properties of the repair mortars to match the 5thC, medieval, and the 15thC mortar samples after curing 1 month, 3 months and 6 months (on humid samples)
0.1 67*10+4 0.2 3.3 0.2 5.7 15C3 (6 months) 0.01 0.46% 0.02 0.33 0.2 67*10+4 0.1 2.1 0.2 3.9 15C2 (3 months) 0.2 39*10+4 0.2 1 0.3 3.3 15C1 (1 month) 0.1 50*10+4 0.2 2.4 0.2 5.4 M3 (6 months) 0.02 0.42% 0.0 0.08 0.1 50*10+4 0.1 1.3 0.3 3.6 M2 (3 months) 0.1 22*10+4 0.1 0.4 0.0 0.97 M1 (1 month) 0.1 48*10+4 0.2 2 0.2 6.5 5C3 (6 months) 0.01 0.13% 0.04 0.18 0.1 48*10+4 0.1 1.6 0.3 4.8 5C2 (3 months) 0.2 21*10+4 0.0 0.2 0.0 0.57 5C1 (1 month) Std. Dev. Shrinkage Std. Dev. Adherence (MPa) Std. Dev. Ultrasound E-Modulus (MPa) Std. Dev. Tensile Strength (MPa) Std. Dev. Compress. Strength (MPa) The Samples
The values were evaluated from the tests which were conducted on humid samples.
SLIDE 36
2 4 6 8 1 2 3 4 5 6 7 Months
Compressive Strength (MPa)
5C M 15 C 2 4 6 8 1 2 3 4 5 6 7 Months
Compressive Strength (humid) MPa
5C M 15C 1 2 3 4 1 2 3 4 5 6 7 Months
Tensile Strength (MPa)
5C M 15C 0,5 1 1,5 2 2,5 3 3,5 1 2 3 4 5 6 7 Months
Tensile Strength (humid) MPa
5C M 15C
% 2.35 - %97.65 % 67 - %33 % 40 - %60 Crushed Brick / RiverSand 3 / 1 3 / 1 3 / 1 Slaked Lime : Pozzolana 1 / 3 1 /2 1 / 2 Binder : Aggregate
15th Century Medieval 5th Century Mixes of Repair Mortars
The graph of Compressive Strength (MPa) The graph of Compressive Strength (Humid) (MPa) The graph of Tensile Strength (MPa) The graph of Tensile Strength (Humid) (MPa)
SLIDE 37 0,00E+00 1,00E+05 2,00E+05 3,00E+05 4,00E+05 5,00E+05 6,00E+05 1 2 3 4 5 6 7 M o n th s
Y ou n g's M od u lu s (M
5C M 15C
2,00E+05 3,00E+05 4,00E+05 5,00E+05 6,00E+05 7,00E+05 1 2 3 4 5 6 7 M onths
Young's Modulu (in humid) (MPa
5C M 15C
0 ,0 5 0 ,1 0 ,1 5 0 ,2 0 ,2 5 0 ,3 0 ,3 5
A dh er en c S tr en g th (M P a)
5 C M 1 5 C Re p a ir M o r ta r s
0,1 0,2 0,3 0,4 0,5
S h rin k ag (%)
5C M 15C Re p air M o r tar s
% 2.35 - %97.65 % 67 - %33 % 40 - %60 Crushed Brick / RiverSand 3 / 1 3 / 1 3 / 1 Slaked Lime : Pozzolana 1 / 3 1 /2 1 / 2 Binder : Aggregate 15th Century Medieval 5th Century Mixes of Repair Mortars
The graph of Young’s Modulus (MPa) The graph of Young’s Modulus (Humid) (MPa) The graph of Adherence Strength (MPa) The graph of Shrinkage (MPa)
SLIDE 38 3.3.3.5. Ageing Tests
a) The freeze and thaw cycles; The samples were immersed and saturated in water for 24 hours before the commencement of the freezing and thawing cycles. Consecutively, they were subjected to freezing cycles of 3 hours at -25oC and thawing in 20oC water, the samples were kept in the water
in the deep-freeze respectively. Number of the freeze and thaw cycles
15C3-1,2,3 (15th century) (6 months)
15C1-3,4 (15th century) (1 month)
15C1-1,2 (15th century) (1 month)
M3-1,2,3 (Medieval) (6 months)
M1-3,4 (Medieval) (1 month)
M1-1,2 (Medieval) (1 month)
5C3-2,3 (5th century) (6 months)
5C3-1 (5th century) (6 months)
5C1-1,2,3,4 (5th century) (1 month)
9 8 7 6 5 4 3 2 1 Samples
Sound, Fissures and micro cracks, Softening at the corners, Flaking, crumbling, Chipping
SLIDE 39
b) The salt crystallisation cycles; This test was conducted to determine the destructive effects of the
water soluble salt on the repair mortar samples. The samples were dried in the oven for 24 hours before the commencement of the drying-wetting cycles in 14 percent Na2SO410H2O solution. They were immersed in the salt solution for 8 hours ,then dried in the oven at 60oC for 16 hours respectively. In each cycle, the samples were inspected and the deterioration morphology was defined and recorded. Number of the salt crystallization cycles
15C3-1,2,3 (15th century) (6 months) M3-1,2,3 (Medieval) (6 months) 5C3-2,3 (5th century) (6 months) 5C3-1 (5th century) (6 months) 14 13 12 11 10 9 8 7 6 5 4 3 2 1 Samples Sound, Fissures and micro cracks, Softening at the corners, Flaking, crumbling, Chipping
5thC Medieval 15thC 5thC Medieval 15thC
SLIDE 40 RESULTS AND DISCUSSION
According to the evaluation of the test results of the physical and mechanical properties of the repair mortars after a month, it was seen that the density, specific gravity, water absorption (by weight), porosity, coefficient of capillarity and water vapour transmission resistance factor of the samples were compatible with the original samples. The compressive strength of the 5thC and medieval mortar samples were assumed to be 1-1.5 MPa according to anology established on previous experimental works
- f the Building Material Testing Laboratory of the Faculty of Architecture. Standard samples could not
be prepared from the existing joints and exposed parts of the wall core of the T4 (ASTM C270-80a, RILEM 1980), since the masonry mortars were crumbling and powdering during the sampling
- procedure. The original mortar samples were conducted to point load test, but the results were not very
reliable as the point load test could be only applied to the binder of the samples and the results were found to be high when the crumbling state of the samples were considered. Compressive strengths of the 15thC repair mortars were better than the mixes prepared for the 5thC and medieval samples, although the pozzolana: slaked lime ratios, the binder: aggregate ratios and the curing processes were similar. It was seen that the compressive strengths of the repair mortars for the 5thC and for the medieval fabric were approximately 1.5 MPa where the median for the latter samples was 3.5 MPa after a month curing time. This deficiency can be related to the existence of the coarse brick aggregates in the repair mortars of the 5thC and medieval parts. It was concluded that the crushed brick pieces had dewatered the medium and decelarated the gel formation. But after 3 months of curing period the mechanical properties of the 5thC. and medieval repair mortars were progressively improved and after 6 months of curing time it was seen that the mean values were near to each other in all of the samples (Table 3.29) .
SLIDE 41 This phenomena can be correlated to the slow and progressive gel formation of the 5thC. and medieval repair mortar samples which included crushed brick and brick dust as aggregates and artificial
- pozzolana. This progressive increase of the mechanical properties of these samples was closely related
to the water content of the lime paste and the relative humidity of the ambient air. The repair mortar for the 15thC. battlements included neglectable amount of crushed brick, and almost all of the aggregates were river sand, as the sand aggregates were almost non porous, there was no dehydration
- f the lime paste and the gel formation was more rapid than the other samples with brick aggregates.
But it was also detected that the bonds of the sand / binder interstices were poor and there were micro fissures around them, and these fissures were partially filled with silicate forming reactions, in contradiction to this, the bonds of the brick pieces / binder interstices were gradually filled with gel formation and even the binder had penetrated to the surface fissures of the brick pieces. It must be stated that similar progressive silicate forming reactions can be realized in the cores of the walls in the field where rapid drying and dehydration of the mortar is relatively prevented. Otherwise superficial hardening due to the carbonation of the lime will be the setting process and much more weaker mortars would be used in the repairs. The SEM micrographs of the repair mortars which will match the properties of the 5thC., medieval and the 15thC. constructions exhibited homogenous and well adhered strong bonds at the binder / aggregate interstices. This fact was also observed in the polished thin sections of the samples. The micro fissures in the binder phase was originating from dehydration in the initial setting process (Figures 3.114 and 3.115, 3.116). But it can be clearly stated that this limited amount of
SLIDE 42
micro fissures did not decrease the mechanical properties of the repair mortars, as secondary calcite crystals and silicate formations filled them in the later phases of the setting process. The colour changes around the brick pieces, and a general darkening of the matrix was detected on the macro photographs and on the polished thin sections of the samples. The binder / aggregate bonds were scanned at different magnifications, and the colour change of the matrix from creamy tones to pinkish brown around the brick aggregates and the crushed tuff powder cumulations meaned silicate formations around the natural and artificial pozzolanas. The line scan diagrams of the SEM analysis directly proved this phenomena. CaO. SiO2. Al2O3 formations were enriched at the brick pieces / binder interstices (Figures .3.124 and 3.125). The gel formations at these areas were also determined in the SEM micrographs (Figure 3.117). From these data, it can be concluded that the slaked lime will continue to react with the natural and the artificial pozzolanas and the gel formation will continue if the medium is protected from rapid dehydration. Consecutively the mechanical properties will continue to improve, this well known fact will be inspected, tested and monitored in the following two years, by means of conducting the tests for the determination of the mechanical properties of the samples with 3 months of intervals. The physical properties of the repair mortars were compatible with those of the original samples. The coefficient of capillarity of the repair mortar samples were decreased after 3 months of curing period and they were stabilized after 6 months. Densities, specific gravities of the samples were almost constant after 6 months, porosities were stabilized after 3 months, the same results were observed for the max. water absorption capacities of the samples. The saturation degrees of the 5thC. and medieval repair mortars were constant from the beginning , where the saturation degrees of the 15thC. repair mortars were stabilized after 6 months of curing time (Tables 3.25, 3.26, 3.27).
SLIDE 43
The compressive strengths of the 5thC. and medieval repair mortars increased to 7.3 MPa and 5.8 MPa from 1.5 MPa and 1.4MPa respectively. The compressive strength of the 15thC. repair mortars increased to 6.5 MPa from 4.5 MPa in 6 months. The tensile strengths of all of the samples had increased gradually and regularly after 3 and 6 months of curing periods (Tables 3.29, 3.30). The water vapour diffusion resistance factors of the 5thC. and medieval repair mixes were almost constant after 6 months, 15thC. repair mixes exhibited a similar tendency, but it was seen that still there was a slight increase of the values at 6 months of curing time (Tables 3.25, 3.26, 3.27). The shrinkage of the samples for the 5thC. and medieval repair mortars, and 15thC. repair mixes were 0.13%, 0.42% and 0.46% respectively (Table 3.29). Shrinkage cracks were not observed on the surfaces of the samples which were rested in laboratory medium (55 % RH±5 and 20oC±2). The qualitative and quantitative analysis of the water soluble salts indicated that there were only chlorides in limited amounts in the repair mixes (Table 3.24). The chlorides may originate from the tap water which was used for the preparation of the samples. The results of the ageing tests were acceptable for this kind of soft and porous mortars since freeze and thaw cycles and Na2SO4.10H2O crystallization cycles were very drastic. The 15thC. repair mixes showed a better resistance to the ageing tests as their total porosities were less than the other samples and they did not include porous aggregates. After the evaluation of the physical and mechanical properties and their durabilities it can be concluded that the repair mortars were compatible with original mortars which were used in the Tower 4 of the land walls of Istanbul and generally match the properties of traditional mortars which were used in the Byzantine and Ottoman buildings.
SLIDE 44 CONCLUSION
This research programme was based on the experimental work to select appropriate natural stones, and to evaluate the properties of the bricks which were manufactured as prototypes and especially on the control of the physical and mechanical, petrologic, chemical properties of the conservation mortars, and their durabilities to weathering. The genus loci of the project was to match the properties
- f the repair materials to those of the original and subsequent parts of the Tower 4 of the land walls of
- Istanbul. For this purpose the research programme was designed in two parts. The first part included
the characterisation of the traditional mortars, bricks and the limestones which were used in the old fabric, and the results obtained from the sound parts of the samples were compared with the deteriorated parts, and consecutively the deterioration mechanisms and morphologies were researched and causes were correlated to the environment. The second part included the research for the determination of the appropriate limestones which were to be used in the repairs and the locations of their quarries. Also traditional bricks were manufactured and their physical and mechanical properties were tested to approve their appropriateness for the repairs of the facework. This part of the research especially emphasized the importance of the general properties of the repair mortars and their compliance with the properties of the traditional mortars which had been used in the original fabric in different the phases of the construction and in the 15thC. repairs. The problem of the chemical contaminations as a result of using modern cements as binders was considered and slaked lime / ground volcanic tuff was selected as the binder of the repair mortars. The binder / aggregate ratios and the grading of the aggregates were designed to be close to those of the original samples.
SLIDE 45 In the evaluations of the results of the experimental work it was concluded that the limestones which were quarried in Pınarhisar and Kandıra, and the bricks which were manufactured in Kılıcoğlu Brick Kiln in Eskişehir had similar physical, mechanical, petrologic and chemical properties with the
The mortars samples were highly deteriorated after alteration in the polluted urban atmosphere and dissolution and leaching, and destructive effects of the salt crystallisation cycles since the building was located at the Marmara sea coast. Consecutively their mechanical properties were reduced, on the evaluation of the previous researches average mechanical properties of the khorasan mortars which had been used in the different locations of the land walls, ıt was decided to improve the mechanical properties of the repair mortars within the limits for the mechanical properties of the conservation
- mortars. The trial mixes were prepared to guide the proceeding mix design studies, and the samples for
the repairs of the original 5thC. A.D.parts, and for the medieval and 15thC. parts were produced and cured for 6 months. The hydraulic setting processes of the samples were observed by means of macro photography , petrographic analysis and (SEM and linescan at the aggregate / binder interstices). Physical properties such as coefficient of capillarity, total porosity, porosimetry, water vapour transmission resistance factor were especially accentuated in the research besides compressive and tensile strengths and elasticity modulus. Since the conservation mortars should not cause salt contamination in the old fabrics, water soluble salts were analyzed qualitatively and semi-
- quantitatively. Always bearing in mind the shrinkage problem of the lime based mortars, shrinkages of
the samples were observed and evaluated on the samples which were tested in the laboratory medium, since other samples were cured in humid curing conditions. Finally on the evaluation of the aforementioned data it was concluded that the properties of the repair mortars were appropriate and could be used for the repairs of the facework of the Tower 4 of the Yedikule land walls.