
SLIDE 1
2018 2018 MI MIT Em Employer Sy Symposium:
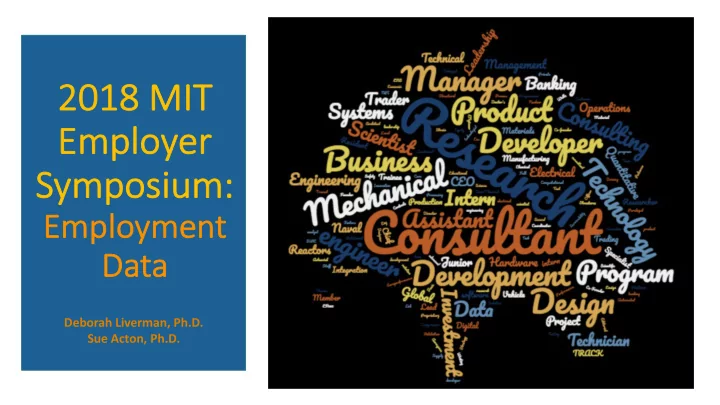
Emplo Employmen ment Da Data
Deborah Liverman, Ph.D. Sue Acton, Ph.D.
2018 2018 MI MIT Em Employer Sy Symposium: Emplo Employmen - - PowerPoint PPT Presentation
2018 2018 MI MIT Em Employer Sy Symposium: Emplo Employmen ment Da Data Deborah Liverman, Ph.D. Sue Acton, Ph.D. Ov Overview: Share 2017 First Destination Data for Bachelors, Masters, and PhDs Take an in-depth look
Deborah Liverman, Ph.D. Sue Acton, Ph.D.
2
3
% of Graduating Bachelor’s Students Starting Their Job Search 2017 Grads starting search
0% 5% 10% 15% 20% 25% 30% 35% 40%
Before Sept Sept Oct Nov Dec Jan Feb Mar Apr May June July Aug
Month when student began their search Fall Job Fair
% of Graduating Bachelor’s Students Starting Their Job Search 2013 Grads starting search 2017 Grads starting search
0% 5% 10% 15% 20% 25% 30% 35% 40%
Before Sept Sept Oct Nov Dec Jan Feb Mar Apr May June July Aug
Month when student began their search
0% 5% 10% 15% 20% 25% 30% 35% 40% 2010 2011 2012 2013 2014 2015 2016 2017
% of students who started their search before Sept
% received offer from internship % starting their search before Sept
0% 5% 10% 15% 20% 25% 30% 35% 40% 2010 2011 2012 2013 2014 2015 2016 2017
% of students
% of Graduating Bachelors Students Who Had Received an Offer by November
0% 10% 20% 30% 40% 50% 60% 70% 2010 2011 2012 2013 2014 2015 2016 2017
61%
Only students who indicated a job location are included
Distinct count of Student # 1 20 40 60 ≥ 80
Seattle SF Boston NYC
Number of Records 1 5 10 15 21
% of Graduating Bachelors
2% 2% 3% 4% 4% 4% 7% 8% 9% 9% 14% 22% 0% 5% 10% 15% 20% 25% 30%
Energy & Utilities Military Health/Medicine Pharmaceuticals Investment Banking Automotive & Transportation Industrial/Consumer Manufacturing Engineering Financial Services Aerospace Consulting Computer Software 2017 2016 2015 2014 2013
Department Name Industry1 Industrial and Consumer Manufactu.. Financial Services Aerospace and Defense Military Academia (Higher Ed) Applied Research Automotive and Transportation Basic Research Business Services Chemicals and Materials Communications, Arts, Entertainme.. Computer Hardware/Electrical Engi.. Computer Software Consulting Education (K-12) Energy and Utilities Engineering Government Health/Medicine Investment Banking Law Non-Profit or NGO Other Pharmaceutics Aeronautics and Astronautics Anthropology Biological Engineering Biology Brain and Cognitive Sciences Chemical Engineering Chemistry Civil and Environmental Eng Earth, Atmos & Planetary Sci Economics Electrical Eng & Computer Sci Humanities and Engineering Linguistics and Philosophy Management Materials Science and Eng Mathematics Mechanical Engineering Nuclear Engineering Physics Political Science Urban Studies and Planning Distinct count of Salary 1 5 10 15 21
% of Graduating Masters
3% 3% 3% 3% 4% 5% 6% 6% 6% 6% 12% 25%
0% 5% 10% 15% 20% 25%
Academia (Higher Education) Automotive & Transportation Computer Hardware/EE Investment Banking Business Services Aerospace Engineering Industrial/Consumer Manufacturing Military Financial Services Computer Software Consulting 2017 2016 2015 2014 2013
Department Name Industry1 Consulting Aerospace and Defense Government Military Academia (Higher Ed) Applied Research Architecture and Urban Planning Automotive and Transportation Basic Research Business Services Chemicals and Materials Communications, Arts, Entertainme.. Computer Hardware/Electrical Engi.. Computer Software Energy and Utilities Engineering Financial Services Health/Medicine Industrial and Consumer Manufactu.. Investment Banking Law Non-Profit or NGO Other Pharmaceutics Aeronautics and Astronautics Architecture Biological Engineering Chemical Engineering Civil and Environmental Eng Computation for Des & Optmiz Electrical Eng & Computer Sci Engineering Management Engineering Systems Division Health Sciences & Technology Humanities Inst for Data, Syst, & Soc Management Mechanical Engineering Nuclear Engineering Operations Research Prog in Media Arts Sciences Supply Chain Management Pro.. Urban Studies and Planning
Number of Records 1 10 20 30 40 ≥ 50
(Academic & Industry)
0% 10% 20% 30% 40% 50% 60% 70% 80% 90% 100% 2013 2014 2015 2016 2017*
% PhD Students Seeking Full- time Employment
Training
*may be slightly higher than past years since no ‘other’ category available for selection
% of Graduating PhD Students
*Does not include academia; does include post-docs in industry
1.5% 2.1% 2.4% 2.7% 3.8% 4.1% 4.4% 5.0% 5.6% 8.9% 10.7% 15.7%
0% 5% 10% 15% 20%
Automotive & Transportation Energy & Utilities Financial Services/Investment Banking Computer Hardware/EE Government Aerospace Chemicals & Materials Consulting Pharmaceuticals Health/Medicine Computer Software Engineering 2017 2016 2015 2014 2013
Number of Records 1 5 10 15 17 Dept Name Industry Name Aerospace and Defense Architecture and Urban Pl.. Automotive and Transpor.. Business Services Chemicals and Materials Communications, Arts, En.. Computer Hardware/EE Computer Software Consulting Education Energy and Utilities Engineering Financial Services Government Health/Medicine Industrial and Consumer .. Investment Banking Law Military Non-profit Agency or NGO Other Pharmaceuticals Aeronautics and Astronau.. Architecture Biological Engineering Biology Brain and Cognitive Scien.. Chemical Engineering Chemistry Civil and Environmental E.. Earth, Atmospheric, and P.. Economics EECS Health Sciences and Tech.. Institute for Data, Syste.. Linguistics and Philosphy Materials Science and Eng.. Mathematics Mechanical Engineering Media Arts and Sciences Nuclear Science and Engin.. Operations Research Physics Political Science Science Technology and S.. Sloan School of Managem.. Urban Studies and Planni..
Non-postdocs only included
$40,000 $50,000 $60,000 $70,000 $80,000 $90,000 $100,000 $110,000 $120,000 $130,000 $140,000 2014 2015 2016 2017
MBA PhD - Industry MEng SM SB PhD – Postdoc Degree 2017 Median salary Increase from 2014 to 2017 % increase in median salary MBA $130,000 $5,000 4% PhD- Industry $119,500 $14,500 14% MEng $115,000 $15,000 15% SM $85,000 $5,000 6% SB $85,000 $12,500 17% PhD- Postdoc $52,500 $2,500 5%
Note: Salaries not adjusted for inflation
Industry1 0K 20K 40K 60K 80K 100K 120K Median Salary Computer Software Business Services Applied Research Computer Hardware/Electrical Engineering Financial Services Communications, Arts, Entertainment Energy and Utilities Investment Banking Law Aerospace and Defense Automotive and Transportation Consulting Education (K-12) Engineering Industrial and Consumer Manufacturing Non-Profit or NGO Pharmaceutics Health/Medicine Chemicals and Materials Government Academia (Higher Ed) Basic Research Military
110,000 103,500 100,000 100,000 99,500 97,500 96,750 85,000 85,000 80,000 80,000 80,000 80,000 80,000 70,000 70,000 67,500 65,000 60,000 47,000 40,000 38,400 36,000
Industry
Distinct count of Student # 1 10 20 30 ≥ 40 30,000 130,000 Median Salary
Only areas with > 3 students are shown
Median salary $85,000
30,000 130,000 Median Salary 30,000 130,000 Median Salary 30,000 130,000 Median Salary
Median = $85,000 $107,000 $112,000 $113,500 $105,000
Industry Name 0K 20K 40K 60K 80K 100K 120K 140K 160K 180K Median Cleansalary Industrial and Consumer Manufacturing Financial Services Consulting Business Services Computer Software Automotive and Transportation Aerospace and Defense Engineering Computer Hardware/EE Investment Banking Energy and Utilities Health/Medicine Pharmaceuticals Chemicals and Materials Government Education Military Architecture and Urban Planning 160,000 150,000 147,000 140,000 135,000 127,500 119,000 116,000 115,000 112,500 110,000 105,000 105,000 104,000 100,000 95,000 90,000 83,000
U.S. Bureau of Labor Statistics Full-time salaried data
Women’s Earnings as a Percentage of Men’s
74.1 78.9 81.9 84.8 87.3 20 40 60 80 100 Business and financial operations occupations Architecture and engineering occupations Total, full-time wage and salary workers Life, physical, and social science occupations Computer and mathematical occupations
U.S. Bureau of Labor Statistics, 2016 Full-time wage and salary workers
Salaries and US Women and Men Ages 20 to 24
26000 27196
5000 10000 15000 20000 25000 30000 Women Men
What about Female MIT Bachelors Graduates?
Megan Beck and Barry Libert, Dec 19, 2017, MIT Sloan Management Review, ‘Could AI Be the Cure for Workplace Gender Inequality?’
F/M = 96%
$16,500
Quartile Distribution of Bachelors Salaries by Gender
Gender Female Male 0K 10K 20K 30K 40K 50K 60K 70K 80K 90K 100K Median Salary
MIT Median Bachelors Salaries
N (F, M) = 140, 140 Those who obtained $0 salary were not included
50 100 150 200 250 Female Male
MIT Median Bachelors Salaries by Gender (in Thousands)
F M
80K 96.5K
U.S. Bureau of Labor Statistics, 2016 Full-time wage and salary workers
U.S. Women’s Salary as a Percentage of Men’s
Age % of Men’s Salary
96 89 83 78 74 76
20 40 60 80 100 20 to 24 years 25 to 34 years 35 to 44 years 45 to 54 years 55 to 64 years 65 years and older
Department of Education Data; average student earnings at 6 and 10 years out; Suzanne Kahn, Roosevelt Institute (11/23/15); Economic Inclusion, Education; http://bit.ly/21cyChH
83 71 63 20 40 60 80 100
0 years 6 years 10 years
MIT Women’s Salary as a Percentage of MIT Men’s salary
Years out from graduation Women’s Salary as a % of Men’s Salary
MIT Bachelors Median Negotiated Additional Salary* Gender % Bachelors grads who indicated that they negotiated % Bachelors grads who gained in salary when they negotiated Females 9% 61% Males 11% 61% $1460/yr
Gender Female Male 500 1000 1500 2000 2500 3000 3500 4000 Median Negotiated Salary
*includes those who indicated they obtained $0 in negotiation
$2540 $4000 F M
Gender1 Female Male
Median = $85,000
Female Male
30,000 113,000 Median Salary
Distinct count of Student # 1 10 20 30 ≥ 40
before, but this may be due to offers by their junior year internships
SF, NYC, and Seattle
almost every industry
differs greatly by degree
counterparts, but we do not have all the data necessary to determine why