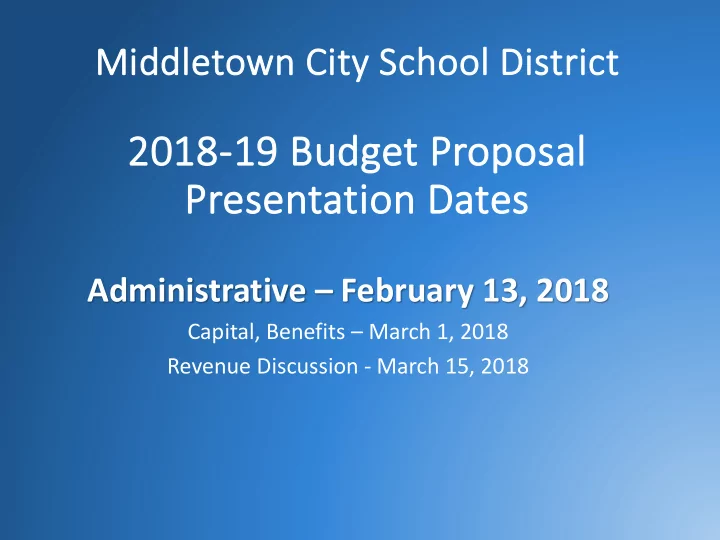

Middle letown City ty S Sch chool D Distr tric ict 2018-19 B 2018 19 Bud udget Proposal al Pre resentation D Dates Administrative – February 13, 2018 Capital, Benefits – March 1, 2018 Revenue Discussion - March 15, 2018
2018 2018-2019 19 A Assumptions $ Annual inflation rate for most items 2% $ TRS = 11% $ ERS = 16.5% $ BOCES Services = 5% $ Health Insurance – TBD (Self Funded) $ Foundation Aid Increase 3% $ Community Schools Increase 39.7%
Estimated Percent of Total Budget Adminstrative Instructonal Capital Benefits Adminstrative Benefits 7% 21% Capital 15% Instructonal 57%
MAJOR CA CATEGORY Y SYN YNOPSIS 2017-18 2018-19 Change BUDGET BUDGET OVER 17/18 BOARD OF EDUCATION 49,481 52,822 3,341 DISTRICT CLERK 58,438 59,258 820 DISTRICT MEETING 39,775 43,675 3,900 CHIEF SCHOOL ADMINISTRATOR 355,513 306,837 (48,676) BUSINESS ADMINISTRATION 549,800 564,770 14,970 AUDITING 82,256 80,756 (1,500) TREASURER 118,625 125,900 7,275 TAX COLLECTOR 33,298 28,600 (4,698) PURCHASING 134,423 138,313 3,890 LEGAL FEES 318,000 343,000 25,000 PERSONNEL 558,600 598,719 40,119 RECORDS MANAGEMENT 37,670 37,670 0 INFORMATION/COMMUNICATIO 124,100 141,948 17,848 CENTRAL PRINTING & MAILING 508,801 498,521 (10,280) CENTRAL DATA PROCESSING 1,211,976 1,273,593 61,617 INSURANCE 790,704 825,000 34,296 BOCES ADMIN CHARGES 1,122,009 1,140,291 18,282 CURRICULUM & INSTRUCTION 585,320 582,794 (2,526) SUPERVISION REGULAR SCHOOLS 4,472,789 4,727,666 254,877 SUPERVISION SPECIAL SCHOOLS 508,552 653,249 144,697 RESEARCH PLANNING 103,662 109,878 6,216 ADMINISTRATION W/O BENEFIT 11,763,793 12,333,260 569,468 4.84%
8 Year ear H History y - Administrative B e Budget Percent Growth • 2011-12 -4.23% 10.00 • 2012-13 3.27% 8.00 • 2013-14 5.67% 6.00 • 2014-15 5.57% 4.00 • 2015-16 4.52% 2.00 • 2016-17 3.74% 0.00 • 2017-18 4.76% 11-12 12-13 13-14 14-15 15-16 16-17 17-18 18-19 -2.00 • 2018-19 4.84% -4.00 -6.00
Historical Tax Cap Growth Factor 2.50% 2.00% 2.00% 1.62% 1.46% 1.50% 1.26% 1.00% 0.50% 0.12% 0.00% 2014-15 2015-16 2016-17 2017-18 2018-19
2018 18-19 B Budget Cal alendar ar Instructional - February 13, 2018 Capital, Benefits - March, 1, 2018 Revenue Discussion - March 15, 2018 Public Input - April 5, 2018 Budget Adoption - April 19, 2018 Budget Hearing - May 3, 2018 Budget/Election Vote - May 15, 2018
Recommend
More recommend