
SLIDE 1
Intelligent Ultrasound
Presentation by: Stuart Gall CEO
AIM: MED
2017 Preliminary Results AIM: MED Intelligent Ultrasound - - PowerPoint PPT Presentation
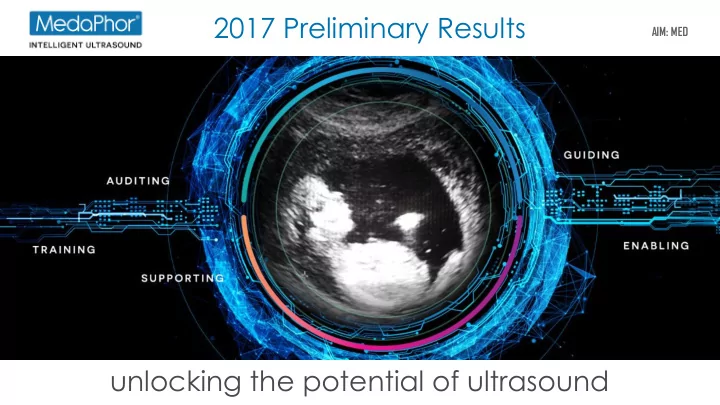
2017 Preliminary Results AIM: MED Intelligent Ultrasound Presentation by: Stuart Gall unlocking the potential of ultrasound CEO Summary Intelligent Ultrasound 50 million medical professionals in the world *Estimate includes Doctors, GPs,
Intelligent Ultrasound
Presentation by: Stuart Gall CEO
AIM: MED
Intelligent Ultrasound
Summary
medical professionals in the world
3
*Estimate includes Doctors, GPs, midwives, nurses Intelligent Ultrasound
3
*estimateThis is why ultrasound remains a specialist skill, practised by only 2% of medical professionals Our aim is to not only
but to unlock the
Intelligent Ultrasound
Presentation by: Stuart Gall CEO
AIM: MED
aims to unlock ultrasound for all medical professionals
TRAINING SUPPORTING GUIDING AUDITING ENABLING
Our range of intelligent ultrasound products
Training ultrasound specialists with hi-fidelity
SIMULATION
Supporting ultrasound specialists with deep-learning based
ARTIFICIAL INTELLIGENCE
Enabling unskilled users to scan and diagnose with
ARTIFICIAL INTELLIGENCE
Intelligent Ultrasound
Pre-clinical training Clinical training Assessment and certification
Performance Audit
Diagnostic imaging Ultrasound guided intervention
Automated Scanning
SIMULATION DIVISION
In October 2017 we organised into two divisions
CLINICAL DIVISION
BASED IN CARDIFF AND ATLANTA BASED IN OXFORD
TRAINING GUIDING SUPPORTING AUDITING ENABLING
Intelligent Ultrasound
Intelligent Ultrasound
The gold standard in ultrasound training simulators:
General medical and OBGYN simulator aimed at medical schools and hospitals globally Echocardiography simulator range aimed at teaching cardiology and anaesthesiology schools New hybrid version of ScanTrainer and HeartWorks aimed at the Emergency market
LAUNCHED FEB ‘18
TRAINING
Intelligent Ultrasound
Simulation Division - Territory Review
MedaPhor offices (direct sales teams)
STAFF: 7 OPERATIONS: SALES; TECH SUPPORT, GEN ADMIN,MEDAPHOR NORTH AMERICA INC MEDAPHOR GROUP HQ SIMULATION DIVISION
STAFF: 24 OPERATIONS: R&D; MEDICAL; SALES; MARKETING, TECH SUPPORT, FINANCE, GEN ADMINCARDIFF ATLANTA Resellers (established and trained) x 31
£0 £500,000 £1,000,000 £1,500,000 £2,000,000 £2,500,000 £3,000,000 £3,500,000 £4,000,000 £4,500,0002011 2012 2013 2014 2015 2016 2017
Simulation Revenue
MEDAPHOR ASIA
STAFF: 1 OPERATIONS: SALES, SUPPORT, ADMINHONG KONG
MNA SALES UP 98% to £1.7m CHINA SALES UP 50% to £0.8m
*Staff figures include full and part-time employeesROW SALES UP 44% to £1.8m UK SALES DOWN 40% to £0.7m
Intelligent Ultrasound
Intelligent Ultrasound
Acquisition of Intelligent Ultrasound
11
Noble, OBE and FRS
intelligence in ultrasound
ultrasound image analysis software to automatically identify and grade key
Intelligent Ultrasound
Automated image analysis using AI
– Working POC device – Patent filed –
NEEDLEGUIDE
Note: ScanNav and NeedleGuide are pre-market products in development
FIRST PILOT IN UK HOSPITAL DEVELOPMENT STARTED SUPPORTING GUIDING AUDITING
Intelligent Ultrasound
Automated GP and home scanning
FAST AAA Carotid *Conceptualised images only. Not actual productENABLING
Intelligent Ultrasound
Pre-clinical training Clinical training Assessment and certification
Performance Audit
Diagnostic imaging Ultrasound guided intervention
Automated Scanning
TRAINING
MedaPhor product development pathway
CLINICAL
ARTIFICIAL INTELLIGENCE
Automated diagnostic triaging device*
SIMULATION
*Conceptualised image only. Not actual productScanNav and NeedleGuide are pre-market products in development
LAUNCHED £4.2m sales in 2017 PILOT IN UK HOSPITAL INNOVATE WON AUGMENTED REALITY
Ultrasound needle guidance Automated image analysis and real-time quality guidance
DEEP LEARNING
Real-time quality audit software
NEEDLEGUIDE
Intelligent Ultrasound
STUCTURED TRAINING OBJECTIVE ASSESSMENT 100% CLINICAL AUDIT
CENTRAL LOCAL
ULTRASOUND TRAINING LIVE SCANNING SUPPORT AND AUDIT
MedaPhor aim’s to be the first company in the world to link training and on-going clinical ultrasound performance
Intelligent Ultrasound
SIMULATION BASED training AUGMENTED REALITY guidance ARTIFICIAL INTELLIGENCE image analysis
can unlock the potential of ultrasound for all medical professionals Our unique combination of
Intelligent Ultrasound
Intelligent Ultrasound
2017 FINANCIAL RESULTS
Summary
Intelligent Ultrasound
CONSOLIDATED INCOME STATEMENT
Note 2017 2016 £ £ REVENUE 3 4,180,630 3,286,147 Cost of sales (1,657,765) (1,174,065) Gross profit 2,522,865 2,112,082 Other income 28,225
(5,228,211) (3,897,652) Exceptional administrative costs 4 (2,860,774) (698,435) Total administrative costs (8,060,760) (4,596,087) OPERATING LOSS (5,537,895) (2,484,005) Finance costs (7,833) (3,341) LOSS BEFORE INCOME TAX (5,545,728) (2,487,346) Income tax credit 5 127,609 73,201 LOSS ATTRIBUTABLE TO THE EQUITY SHAREHOLDERS OF THE PARENT (5,418,119) (2,414,145) OTHER COMPREHENSIVE INCOME Items that will or may be reclassified to profit or loss: Exchange gain/(loss) arising on translation of foreign operations 31,171 (6,996) OTHER COMPREHENSIVE INCOME FOR THE YEAR 31,171 (6,996) TOTAL COMPREHENSIVE INCOME ATTRIBUTABLE TO THE EQUITY SHAREHOLDERS OF THE PARENT (5,386,948) (2,421,141)
Intelligent Ultrasound
SALES
Year ended 31 December 2017 Distribution £ Direct Sales £ Total £ United Kingdom
715,531 North America
1,708,984 Rest of World 1,756,115
1,756,115 2,424,515 4,180,630 Year ended 31 December 2016 Distribution £ Direct Sales £ Total £ United Kingdom
1,198,457 North America
864,366 Rest of World 848,292 375,032 1,223,324 848,292 2,437,855 3,286,147
Intelligent Ultrasound
CONSOLIDATED INCOME STATEMENT
Note 2017 2016 £ £ REVENUE 3 4,180,630 3,286,147 Cost of sales (1,657,765) (1,174,065) Gross profit 2,522,865 2,112,082 Other income 28,225
(5,228,211) (3,897,652) Exceptional administrative costs 4 (2,860,774) (698,435) Total administrative costs (8,060,760) (4,596,087) OPERATING LOSS (5,537,895) (2,484,005) Finance costs (7,833) (3,341) LOSS BEFORE INCOME TAX (5,545,728) (2,487,346) Income tax credit 5 127,609 73,201 LOSS ATTRIBUTABLE TO THE EQUITY SHAREHOLDERS OF THE PARENT (5,418,119) (2,414,145) OTHER COMPREHENSIVE INCOME Items that will or may be reclassified to profit or loss: Exchange gain/(loss) arising on translation of foreign operations 31,171 (6,996) OTHER COMPREHENSIVE INCOME FOR THE YEAR 31,171 (6,996) TOTAL COMPREHENSIVE INCOME ATTRIBUTABLE TO THE EQUITY SHAREHOLDERS OF THE PARENT (5,386,948) (2,421,141)
Intelligent Ultrasound
OVERHEADS
22
Increase in administrative expenses excluding exceptional items: £m Amortisation of intangibles arising on the acquisitions of IML and IUL 0.2 Other amortisation and depreciation increase 0.2 Increase in IML overheads (acquired 8 August 2016) 0.5 IUL overheads (acquired 6 October 2017) 0.2 Movement in exchange differences 0.1 Other 0.1 Total increase in administrative overheads excluding exceptional costs 1.3
Intelligent Ultrasound
CONSOLIDATED INCOME STATEMENT
Note 2017 2016 £ £ REVENUE 3 4,180,630 3,286,147 Cost of sales (1,657,765) (1,174,065) Gross profit 2,522,865 2,112,082 Other income 28,225
(5,228,211) (3,897,652) Exceptional administrative costs 4 (2,860,774) (698,435) Total administrative costs (8,060,760) (4,596,087) OPERATING LOSS (5,537,895) (2,484,005) Finance costs (7,833) (3,341) LOSS BEFORE INCOME TAX (5,545,728) (2,487,346) Income tax credit 5 127,609 73,201 LOSS ATTRIBUTABLE TO THE EQUITY SHAREHOLDERS OF THE PARENT (5,418,119) (2,414,145) OTHER COMPREHENSIVE INCOME Items that will or may be reclassified to profit or loss: Exchange gain/(loss) arising on translation of foreign operations 31,171 (6,996) OTHER COMPREHENSIVE INCOME FOR THE YEAR 31,171 (6,996) TOTAL COMPREHENSIVE INCOME ATTRIBUTABLE TO THE EQUITY SHAREHOLDERS OF THE PARENT (5,386,948) (2,421,141)
Intelligent Ultrasound
EXCEPTIONAL ITEMS
2017 2016 £ £ Goodwill impairment (see note 7) 3,328,166
10) (636,628)
169,236 139,435 Integration costs
Litigation costs
2,860,774 698,435
Intelligent Ultrasound
CONSOLIDATED BALANCE SHEET
2017 2016 Note £ £ NON CURRENT ASSETS Intangible assets 7 3,366,477 3,572,284 Property, plant and equipment 312,506 366,541 3,678,983 3,938,825 CURRENT ASSETS Inventories 413,244 482,338 Trade and other receivables 1,709,436 1,614,538 Current tax assets
Cash and cash equivalents 4,250,198 1,765,863 6,372,878 3,908,273 TOTAL ASSETS 10,051,861 7,847,098 CURRENT LIABILITIES Trade and other payables 8 (2,356,702) (2,635,327) Provisions (80,555) (72,830) (2,437,257) (2,708,157) NON CURRENT LIABILITIES Deferred taxation (467,994) (304,333) TOTAL LIABILITIES (2,905,251) (3,012,490) NET ASSETS 7,146,610 4,834,608 EQUITY CAPITAL AND RESERVES ATTRIBUTABLE TO EQUITY HOLDERS OF THE COMPANY Ordinary share capital 9 907,015 318,986 Share premium 12,216,670 7,267,139 Accumulated losses (12,423,931) (7,005,812) Share-based payment reserve 413,600 321,600 Merger reserve 6,013,065 3,943,675 Foreign exchange reserve 20,191 (10,980) TOTAL EQUITY 7,146,610 4,834,608 2017 2016 No. £ No. £ Ordinary share capital Unlimited Unlimited Unlimited Unlimited Allotted, issued and fully paid Ordinary shares of 1p each Balance at 1 January 31,898,576 318,986 20,136,300 201,363 Shares issued for cash 44,125,324 441,253 7,111,112 71,111 Shares issued on acquisition of IML 2,325,582 23,256 4,651,164 46,512 Shares issued on acquisition of IUL 12,351,961 123,520
90,701,443 907,015 31,898,576 318,986
Intelligent Ultrasound
ACQUISITION OF INTELLIGENT ULTRASOUND LIMITED
Fair Value £ Intangible assets 1,388,000 Property and equipment 6,763 Prepayments and other debtors 33,547 Bank and cash 1,559 Trade and other payables (189,999) Deferred tax (235,960) Net assets acquired 1,003,910 Goodwill 2,035,784 Total consideration 3,039,694 Satisfied by: Cash 72,000 Fair value of shares and warrants issued in the Company 1,978,463 Fair value of shares and warrants to be issued in the Company 989,231 3,039,694
Intelligent Ultrasound
INTANGIBLE FIXED ASSETS
Goodwill Intellectual property Brand Develop- ment Costs Other (software licences) Total £ £ £ £ £ £ COST As at 1 January 2016
25,000 1,011,325 Additions
Acquisition of IML 1,292,382 1,650,000 133,000
As at 31 December 2016 1,292,382 1,650,000 133,000 1,458,777 25,000 4,559,159 Additions
Acquisition of IUL 2,035,784 1,388,000
As at 31 December 2017 3,328,166 3,038,000 133,000 1,950,895 25,000 8,475,061 AMORTISATION As at 1 January 2016
25,000 577,985 Charge for year
11,083 260,307
As at 31 December 2016
11,083 813,292 25,000 986,875 Charge for year
26,600 402,243
Goodwill impairment 3,328,166
As at 31 December 2017 3,328,166 502,200 37,683 1,215,535 25,000 5,108,584 NET BOOK VALUE As at 31 December 2017
95,317 735,360
As at 31 December 2016 1,292,382 1,512,500 121,917 645,485
As at 1 January 2016
Intelligent Ultrasound
CONSOLIDATED CASH FLOW
2017 2016 £ £ NET CASH USED IN OPERATING ACTIVITIES (2,195,656) (2,187,494) CASH FLOWS FROM INVESTING ACTIVITIES Purchase of property, plant and equipment (183,012) (156,800) Disposal of property, plant and equipment 11,440 16,209 Internally generated intangible assets (492,118) (472,452) Cash used on acquisition of subsidiaries (72,000)
1,559 272,787 NET CASH USED IN INVESTING ACTIVITIES (734,131) (340,256) CASH FLOWS FROM FINANCING ACTIVITIES Issue of new shares 5,515,665 3,200,000 Share issue costs (124,881) (183,817) Finance (costs paid)/income received (7,833) (3,341) NET CASH GENERATED FROM FINANCING ACTIVITIES 5,382,951 3,012,842 Exchange gains/(losses) on cash and cash equivalents 31,171 (6,996) NET INCREASE IN CASH AND CASH EQUIVALENTS 2,484,335 478,096 CASH AND CASH EQUIVALENTS AT BEGINNING OF YEAR 1,765,863 1,287,767 CASH AND CASH EQUIVALENTS AT END OF YEAR 4,250,198 1,765,863 2017 2016 £ £ CASH FLOW FROM CONTINUING OPERATING ACTIVITIES Loss before tax (5,545,728) (2,487,346) Depreciation 232,369 154,123 Amortisation of intangible assets 793,543 408,890 Impairment of goodwill 3,328,166
(636,628)
7,833 3,341 Share-based payments 92,000 70,600 Operating cash flows before movement in working capital (1,728,445) (1,850,392) Movement in inventories 69,094 (82,913) Movement in trade and other receivables (61,351) (350,911) Movement in trade and other payables (575,798) 96,722 Cash used in operations (2,296,500) (2,187,494) Income taxes received 100,844
(2,195,656) (2,187,494)
Intelligent Ultrasound
Presentation by: Stuart Gall CEO
AIM: MED