
SLIDE 1
- 1 -
2016 Highlights
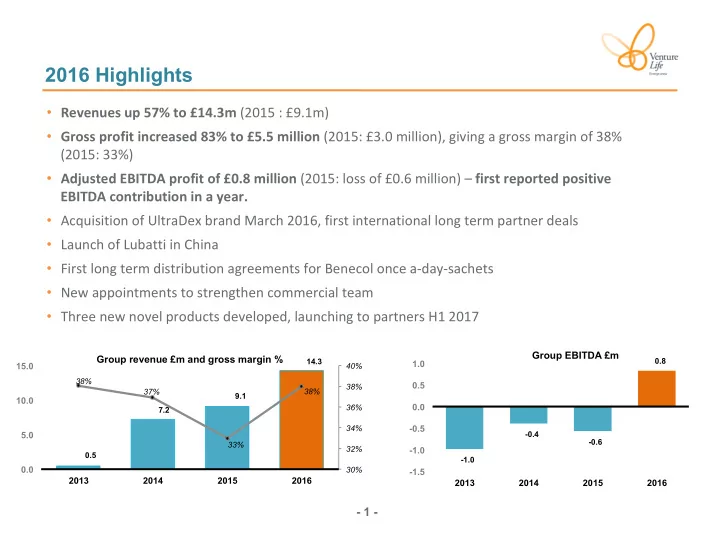
- Revenues up 57% to £14.3m (2015 : £9.1m)
- Gross profit increased 83% to £5.5 million (2015: £3.0 million), giving a gross margin of 38%
(2015: 33%)
- Adjusted EBITDA profit of £0.8 million (2015: loss of £0.6 million) – first reported positive
EBITDA contribution in a year.
- Acquisition of UltraDex brand March 2016, first international long term partner deals
- Launch of Lubatti in China
- First long term distribution agreements for Benecol once a-day-sachets
- New appointments to strengthen commercial team
- Three new novel products developed, launching to partners H1 2017
0.5 7.2 9.1 14.3 38% 37% 33% 38% 30% 32% 34% 36% 38% 40%
0.0 5.0 10.0 15.0 2013 2014 2015 2016
Group revenue £m and gross margin %
- 1.0
- 0.4
- 0.6
0.8
- 1.5
- 1.0
- 0.5
0.0 0.5 1.0 2013 2014 2015 2016
Group EBITDA £m