
SLIDE 1
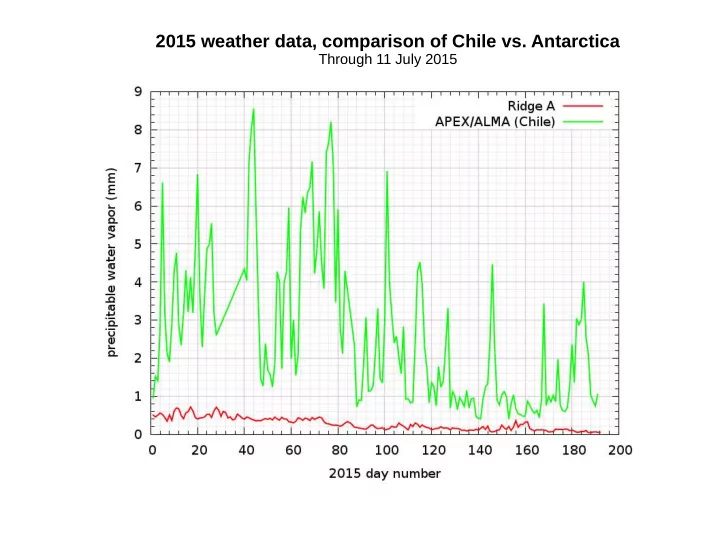
2015 weather data, comparison of Chile vs. Antarctica
Through 11 July 2015
2015 weather data, comparison of Chile vs. Antarctica Through 11 - - PowerPoint PPT Presentation
2015 weather data, comparison of Chile vs. Antarctica Through 11 July 2015 Zoom: 11 June to 11 July This is simply astounding. Every single day is a THz observing day. Observing Weather Summary, 2015 Since 2015 day 100 (winter), best
Through 11 July 2015