
SLIDE 1
1
2012 Northwest Cider & Perry Seminar
The Cider Market & Industry
Class Leader: Peter Mitchell, Director Mitchell F&D Limited
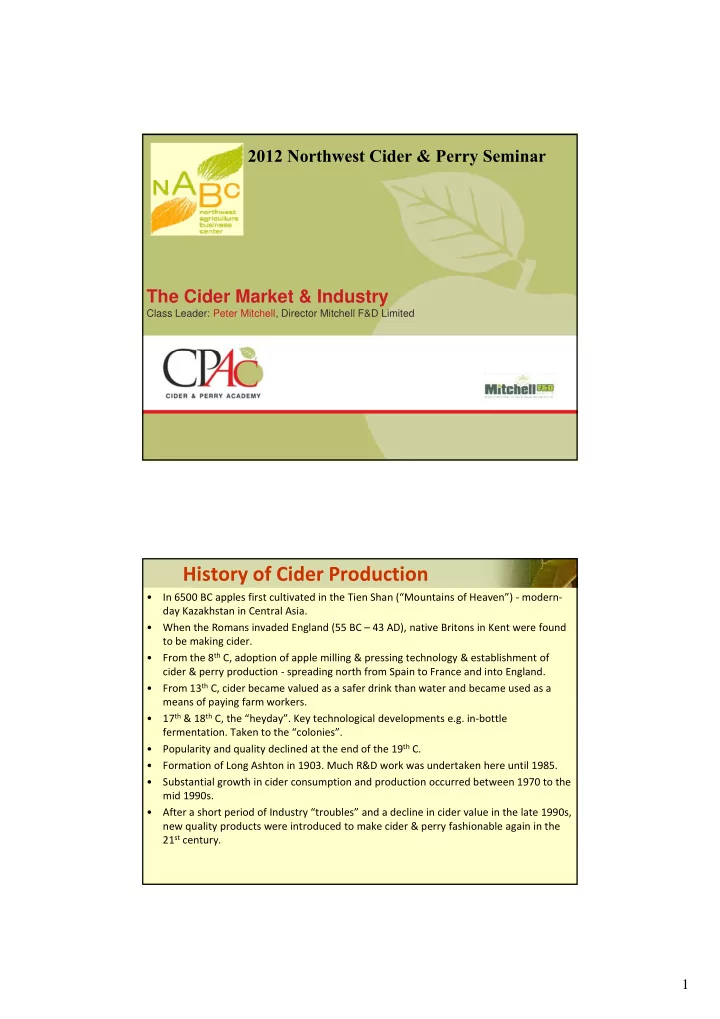
History of Cider Production
- In 6500 BC apples first cultivated in the Tien Shan (“Mountains of Heaven”) ‐ modern‐
day Kazakhstan in Central Asia.
- When the Romans invaded England (55 BC – 43 AD), native Britons in Kent were found
to be making cider.
- From the 8th C, adoption of apple milling & pressing technology & establishment of
cider & perry production ‐ spreading north from Spain to France and into England.
- From 13th C, cider became valued as a safer drink than water and became used as a
means of paying farm workers.
- 17th & 18th C, the “heyday”. Key technological developments e.g. in‐bottle
- fermentation. Taken to the “colonies”.
- Popularity and quality declined at the end of the 19th C.
- Formation of Long Ashton in 1903. Much R&D work was undertaken here until 1985.
- Substantial growth in cider consumption and production occurred between 1970 to the
mid 1990s.
- After a short period of Industry “troubles” and a decline in cider value in the late 1990s,
new quality products were introduced to make cider & perry fashionable again in the 21st century.