
SLIDE 1
1
Manufacturing 2.83 / 2.813
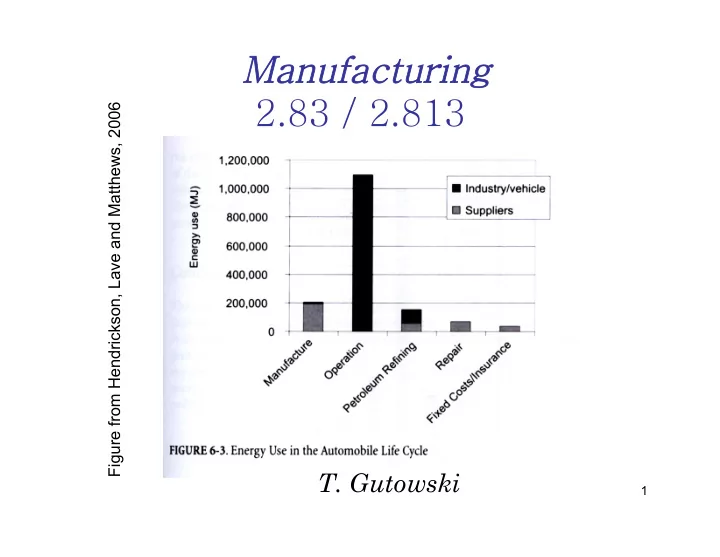
Figure from Hendrickson, Lave and Matthews, 2006
- T. Gutowski
2.83 / 2.813 Figure from Hendrickson, Lave and Matthews, 2006 T. - - PowerPoint PPT Presentation
Manufacturing 2.83 / 2.813 Figure from Hendrickson, Lave and Matthews, 2006 T. Gutowski 1 Why is Mfg Energy Important? 1/3 direct energy Much of the indirect - use phase is in the service of manufacturing Manufacturing
1
Figure from Hendrickson, Lave and Matthews, 2006
2
3
4
5
Exa = 10 18
6
Mfg(d&i)
7
8
9
DOE, EIA
10
11
Mfg Process Equipment Raw Materials Energy Product Wastes
12
Energy Conversion Mfg Process Equipment
13
Process Equipment Energy Conversion Energy Conversion Energy Conversion Mfg Process Equipment Mfg Process Equipment
14
Process Equipment Materials Production Energy Conversion Energy Conversion Energy Conversion Energy Conversion Mfg Process Equipment Mfg Process Equipment
15
Process Equipment Materials Production Energy Conversion Energy Conversion Energy Conversion Energy Conversion Auxiliary Materials Production Mfg Process Equipment Mfg Process Equipment Energy Conversion
16
Process Equipment Environmental Conditioning Materials Production Energy Conversion Energy Conversion Energy Conversion Energy Conversion Auxiliary Materials Production Mfg Process Equipment Mfg Process Equipment Energy Conversion
17
Process Equipment Environmental Conditioning Materials Production Energy Conversion Energy Conversion Energy Conversion Energy Conversion Energy Conversion Auxiliary Materials Production Alt. Materials Production Mfg Process Equipment Mfg Process Equipment Energy Conversion
18
Process Equipment Environmental Conditioning Materials Production Energy Conversion Energy Conversion Energy Conversion Energy Conversion Energy Conversion Auxiliary Materials Production Materials Purification Production Mfg Process Equipment Mfg Process Equipment Energy Conversion
19
(transportation, capital equipment, other materials, commercial buildings…
20
21
Kalpakjian
22
Jog (x/y/z) (6.6%) Machining (65.8%) Computer and Fans (5.9%) Load Constant (run time) (20.2%) Variable (65.8%) Tool Change (3.3%) Spindle (9.9%) Constant (startup) (13.2%) Carousel (0.4%) Unloaded Motors (2.0%) Spindle Key (2.0%) Coolant Pump (2.0%) Servos (1.3%) Jog (x/y/z) (6.6%) Machining (65.8%) Computer and Fans (5.9%) Load Constant (run time) (20.2%) Variable (65.8%) Tool Change (3.3%) Spindle (9.9%) Constant (startup) (13.2%) Carousel (0.4%) Unloaded Motors (2.0%) Spindle Key (2.0%) Coolant Pump (2.0%) Servos (1.3%)
Production Machining Center Automated Milling Machine
From Toyota, and Kordonowy 2002.
Steel~0.7MJ/kg, Alu~0.25MJ/kg Estimate for Steel~0.7 x 3(aux) x 3(utilities)=6MJ/kg removed
23
Power (kW) Process Rate “r” (kg/hr) Process Rate “r’ (kg/hr) Specific Energy (J/kg) physics auxiliary equipment & infrastructure
24
25
Melting & Machining Mostly Vapor Phase Processes
1 mm Size Mass m = Spindle power P Rotational speed W x D x H = n = S = max 32 x 25 x 30.5 mm 98 g 1.6 W 10,000 min 3Microlathe Micro milling machine
5 mm Spindle drive Tool Tool Spindle drive Tool Tool Source: [EHMA05, MEL07, TANA01]Sample parts
26
Kalpakjian
27
1 2 3 4 5 6 7 8 9 5 10 15 20 Throughput (kg/hr) All-Electric - 85 tons Hydraulic - 85 tons SEC (MJ/kg) Material: PP
Source: [Thiriez]
28
Energy Conversion Mfg Process Equipment
electricity gas
coal
29
Examples (using best values):
See Smil’s Table A.11
30
31
Data from US Energy Information Administration, DOE 2002 & Klee & Graedel
32
33
Annual emissions resulting from the operation of a typical production machine tool (22 kW spindle, cutting 57% of the time, 2 shifts, auxiliary equipment, electricity from US grid) as measured in annual SUV equivalents (12,000 miles annually, 20.7 mpg)
34
Percentage of Gross Electricity genereated from different fuels and Overall Efficiency of the Electric Grid (including distribution) in 1993 in different European countries [Boustead PVC] and in 2003 in the U.S. [EIA 2004].
35
36
Metals Flow Sand+ Flow
Pouring Cooling Trim Shakeout Mixing Product Finishing Melting Mold Formation Sand Cooling Sand Processing (AO Treatment) Recycling Recycling Product & Waste Losses
Input Metal Input Sand
37
– Similar distribution in the UK – Share of aluminum expected to increase with lightweighting of automotive parts
Source: DOE, 1999.
38
factory)
Measured at the factory
39
(including elect losses)
factory)
40
Metallic Input Materials Limestone, Alloys 1.03 tons Gray Iron Products 1.00 tons Slag 0.73 tons Gasses 1,572 kg Dust 0.4 tons Metallurgical Coke 87 kg
Boundaries are drawn around the entire facility so that all components are at standard pressure and temperature
Natural Gas (Afterburners) 4.05 kg Air and Oxygen 1,508 kg
41 Gray Iron Products 1.00 tons Slag Dust 0.1 tons
Metallic Input Materials Alloys 1.03 tons Electricity 1762 MJ
Boundaries are drawn around the entire facility so that all components are at standard pressure and temperature
Energy Used at the Factory. Multiply by 3 to get average LHV for fuels used in the US.
42
MJ
1090
ΔH Iron = moles 16751.32 Moles of Iron Melted MJ
2622.89
Total Exergy/ LHV Deg C 1510.00 Temperature Raised to kJ/mol 394.4 Exergy/ LHV kJ/mol*K 0.042 Heat Capacity moles
6,650
Moles of Carbon kJ/mol 13.81 Heat of Fusion Coke Combustion: Energy Required for Melting Iron:
43
η = (ΔH Iron) / (Electricity)
1079 (MJ)/1762 (MJ) → 61%
MJ
1079
ΔH Iron = moles
16,867.35
Moles of Iron Melted MJ
1762
Electricity at the Factory C 1482 Temperature Raised to kJ/mol*K 0.042 Heat Capacity kJ/mol 13.81 Heat of Fusion Electricity: Energy Required for Melting Iron:
44
MJ
1079
ΔH Iron = moles
16,867.35
Moles of Iron Melted MJ
5287
Fuels used for Electricity C 1482 Temperature Raised to kJ/mol*K 0.042 Heat Capacity kJ/mol 13.81 Heat of Fusion Electricity: Energy Required for Melting Iron:
45
Percent
Exergy, B Percent of Input Exergy, B 100% 37.68% 17.89% 44.26% 14,018 MJ 5282.5 MJ 2,507 MJ 6,203 MJ
Electric Induction Melting
Fuels for Electricity 100% 0.03% 1.79% 23.30% 0.0% 21.52% 53.06%
Cupola Melting
Material 3.88 MJ Air and Oxygen Enrichment 11,749 MJ Totals Bin 210 MJ Natural Gas (Afterburners) 2,738 MJ Metallurgical Coke 0.25 MJ Limestone Flux 2,528 MJ Cast Iron Remelt 6,233 MJ Input Metallics
46
Percent of Output Exergy, B Percent of Output Exergy, B 100% 0.03% 0.64% 99.33% 8,306 MJ 2.3 MJ 53 MJ 8,251 MJ Electric Induction Melting 100% 1.18% 0.12% 0.99% 97.71% Cupola Melting Material 8,405 MJ Totals Bout 99.5 MJ Gasses 10 MJ Dust 83 MJ Slag 8,212 MJ Grey Iron
47
Limestone Natural Gas for Afterburners Metal Input Coal Coal, Nat Gas, etc.
Cupola Melting Coke Coking Air Pollution Air Pollution Metal Melt Land and Water Pollution Land and Water Pollution Baghouse Electricity Power Plant Air Pollution Land and Water Pollution
48
Metal Input Coal, Nat Gas, etc.
Electric Induction Melting Air Pollution Metal Melt Land and Water Pollution Electricity Power Plant Air Pollution Land and Water Pollution
49
Cupola Melting
Foundry
600 TOTAL FOR CUPOLA FOUNDRY 205 Total for Balance of Foundry
130 Electric Power Production 60 Greensand Mold Binder 15 Natural Gas Foundry
Balance of Foundry - Per Tonne of Metal Melt (data from a cupola foundry) 395 Total for Cupola Melting
40 Electric Power Production 35 Coking - Assume By-Product Coking 10 Limestone 15 Natural Gas 295 Coke
Kg of CO2 Equivalent/ Tonne of Metal Melt
50
Electric Induction Batch Melting 500 TOTAL FOR ELECTRIC INDUCTION BATCH FOUNDRY 205 Total for Balance of Foundry
130 Electric Power Production 60 Greensand Mold Binder 15 Natural Gas Foundry
Balance of Foundry - Per Tonne of Metal Melt (data from a cupola foundry) 295 Total for E. I. Batch Melting
295 Electric Power Production
Kg of CO2 Equivalent/ Tonne of Metal Melt
51
Electric Induction Heel Melting 670 TOTAL FOR ELECTRIC INDUCTION HEEL FOUNDRY 205 Total for Balance of Foundry
130 Electric Power Production 60 Greensand Mold Binder 15 Natural Gas Foundry
Balance of Foundry - Per Tonne of Metal Melt (data from a cupola foundry) 465 Total for E. I. Heel Melting
465 Electric Power Production
Kg of CO2 Equivalent/ Tonne of Metal Melt
52
205 205 205 Balance of Foundry 670 465
Electric Induction – Heel
500 295
Electric Induction – Batch
600 395
Cupola
Total Kg CO2 Equiv./Tonne Melt Melting Technology
53
54
55
because it is often too time consuming or expensive to monitor emissions from individual sources.
estimate emissions if you do not have test data.
*S= % of sulfur in the coke. Assumes 30% conversion of sulfur into SO2.
Source: EPA AP-42 Series 12.10 Iron Foundries http://www.epa.gov/ttn/chief/ap42/ch12/bgdocs/b12s10.pdf
0.1 Baghouse 0.005 - 0.07
Uncontrolled Electric Induction 0.3 Baghouse 0.05- 0.6 0.6S* 73 6.9 Uncontrolled Cupola Lead SO2 CO Total Particulate Process
Iron Melting Furnace Emissions Factors (kg/Mg of iron produced)
Source:AFS Organic HAP Emissions Factors for Iron Foundries www.afsinc.org/pdfs/OrganicHAPemissionfactors.pdf
0.285 EPA average core 0.5424 AFS average core 0.643 AFS heavily cored Emissions Factor Core Loading
Pouring, Cooling Shakeout Organic HAP Emissions Factors for Cored Greensand Molds (lbs/ton of iron produced)
56
262,191 262,117 74 74 ZINC (FUME OR DUST) 1,152,889 1,145,585 7,300 TOTALS 7,484 835 6,645 5 6,640 PHENOL 14.6 0.25 14.35 14.35 MERCURY 768,709 768,387 322 48 274 MANGANESE 39,692 39,525 167 40 127 LEAD 20 20 DIISOCYANATES 74,778 74,701 78 9 69 COPPER Total waste Managed (lbs) Total transfers off site for waste Management (lbs) Total on-site Release (lbs) Surface Water Discharge (lbs) Total Air Emissions (lbs) Chemical
57
* * Source: http://www.idsa-mp.org/proc/plastic/injection/injection_process.htm *
Schematic of thermoplastic Injection molding machine
58
CRADLE Polymer Delivery
Injection Molding
Emissions to air, water, & land Scrap Note to Reader: FACTORY GATE = Also included in the Paper Polymer Delivery Naphtha, Oil. Natural Gas Ancilliary Raw Materials
Thermoplastic Production
(Boustead) Internal Transport Additives
Compounder
Pelletizing Building (lights,heating, ect..)
Energy Production Industry
Anciliary Raw Materials Emissions to air, water, & land Internal Transport Drying = Focus of this Analysis
Waste Management
Drying Building (lights,heating, ect..) Packaging
Injection Molder
Extrusion
Service Period 1 kg of Injection Molded Polymer
Emissions to air, water & land Emissions to air, water & land
59
What is a polymer: How much energy does it take to make 1 kg of polymer = a lot !!! Values are in MJ per kg of polymer produced.
60
CRADLE Polymer Delivery
Injection Molding
Emissions to air, water, & land Scrap Note to Reader: FACTORY GATE = Also included in the Paper Polymer Delivery Naphtha, Oil. Natural Gas Ancilliary Raw Materials
Thermoplastic Production
(Boustead) Internal Transport Additives
Compounder
Pelletizing Building (lights,heating, ect..)
Energy Production Industry
Anciliary Raw Materials Emissions to air, water, & land Internal Transport Drying = Focus of this Analysis
Waste Management
Drying Building (lights,heating, ect..) Packaging
Injection Molder
Extrusion
Service Period 1 kg of Injection Molded Polymer
Emissions to air, water & land Emissions to air, water & land
61
bestow the polymer with the required characteristics.
and continuous production.
Environmentally Unfriendly Additives:
liver, kidney and testicles)
damage marine wildlife)
62
moisture in non-hygroscopic ones.
W150 W200 W300 W400 W600 W800 W1000 W1600 W2400 W3200 W5000
R2 = 0.8225 0.2 0.4 0.6 0.8 1 1.2 1.4 1.6 1.8 500 1000 1500 2000 2500 3000 3500 Throughput (kg/hr) Power Trendline Specific Power Consumption (MJ/kg)
Source: [Thiriez]
63
CRADLE Polymer Delivery
Injection Molding
Emissions to air, water, & land Scrap Note to Reader: FACTORY GATE = Also included in the Paper Polymer Delivery Naphtha, Oil. Natural Gas Ancilliary Raw Materials
Thermoplastic Production
(Boustead) Internal Transport Additives
Compounder
Pelletizing Building (lights,heating, ect..)
Energy Production Industry
Anciliary Raw Materials Emissions to air, water, & land Internal Transport Drying = Focus of this Analysis
Waste Management
Drying Building (lights,heating, ect..) Packaging
Injection Molder
Extrusion
Service Period 1 kg of Injection Molded Polymer
Emissions to air, water & land Emissions to air, water & land
64
Source: http://cache.husky.ca/pdf/br
65
66
20 40 60 80 100 120 1 2 3 4 5 6 7 8 9 10 11 12 13 14 Time (seconds) Power Required (kW) MM 550 Hybrid NT 440 All-Electric Plasticiz e Inject high Clamp open-close Inject low
ton
Cool Ton Buildup
The hydraulic plot would be even higher than the hybrid curve
Source: [Thiriez]
67
Source: [Kordonowy 2002]
Idling Power (Fixed)
68
1 2 3 4 5 6 7 8 50 100 150 200 Throughput (kg/hr) SEC (MJ/kg) HP 25 HP 50 HP 60 HP 75 HP 100 Low Enthalpy - Raise Resin to Inj. Temp - PVC High Enthalpy - Raise Resin to Inj. Temp - HDPE Variable Pump Hydraulic Injection Molding Machines.
Enthalpy value to melt plastics is just 0.1 to 0.7 MJ/kg !!! Does not account for the electric grid.
Source: [Thiriez]
69
HDPE LLDPE LDPE PP PVC PS Consumed
PC PET avg 89.8 79.7 73.1 83.0 59.2 87.2 81.2 74.6 95.7 78.8 low 77.9 79.7 64.6 64.0 52.4 70.8 69.7 62.8 78.2 59.4 high 111.5 79.7 92.0 111.5 79.5 118.0 102.7 97.6 117.4 96.0 avg low high avg low high avg low high avg low high 0.99 0.09
Generic by Amount Extras Building (lights, heating, ect..) Pelletizing Polymer Delivery 0.19
Compounder
0.24 Internal Transport 0.19 0.12 0.24 Polymer Delivery 3.57 3.25 8.01 0.30 1.82 5.00 1.62 Extrusion 0.70 0.16
Subtotal 0.12
Drying ENERGY CONSUMPTION BY STAGE in MJ/kg of shot
70
avg low high avg low high avg low high avg low high avg low high Notes Drying - the values presented assume no knowledge of the materials' hygroscopia. In order words, they are averages between hygroscopic and non-hygroscopic values. For hygroscopic materials such as PC and PET additional drying energy is needed (0.65 MJ/kg in the case of PC and 0.52 MJ/kg in the case of PET) Drying Internal Transport 3.11 1.80 1.62
heating, ect..) 0.99
0.70 69.46 117.34 7.35 6.68 124.18 87.87 87.20 70.77 Hybrid All-Electric 93.60 Subtotal TOTAL w/ Generic Inj. Molded Polymer 71.65 178.68 Hydraulic 72.57
5.35 11.29 3.99 69.79 5.56 4.89 Hydraulic Hybrid All-Electric Injection Molding - Choose One 19.70 26.54 4.47 3.17 11.22 18.06 8.45 15.29
Injection Molder
TOTAL w/o Polymer Prod 18.97 81.04 Granulating - a scarp rate of 10 % is assumed Pelletizing - in the case of pelletizing an extra 0.3 MJ/kg is needed for PP 13.24 12.57 8.84 7.96 6.66 Injection Molding (look below) Scrap (Granulating) 0.05 0.03 0.12
Source: [Thiriez]
71
Process Equipment Materials Production Energy Conversion Energy Conversion Energy Conversion Energy Conversion Energy Conversion Alt. Materials Production Mfg Process Equipment Mfg Process Equipment
72
73
74
Chapman and Roberts
75
some processes can use recycled material process wastes require more material input process wastes require more process energy some process wastes can be recycled
76
(sand)
Machining
Injection molding
Sand casting (metal)
recycle
prompt
waste
primary
77
78
Process Equipment Environmental Conditioning Materials Production Energy Conversion Energy Conversion Energy Conversion Energy Conversion Energy Conversion Auxiliary Materials Production Materials Purification Production Mfg Process Equipment Mfg Process Equipment Energy Conversion
79
– Kuehr, R, and Williams, E. “Computers and the Environment” Kluwer Press 2003 – Murphy, C. F. Electronics, in “Environmentally Benign Manufacturing” Gutowski et al 2001 available at http://web.mit.edu/ebm/
80
81
0.99963 149256000 149256000 Electricity
Input Energy
0.00063 940.54 0.001101 0.03091 Si
Silicon Consumed from Substrate
0.0351 52456.7 0.22218 0.4479 H2 0.00051 761.7636 0.19188 6.1399 O2 0.00089 1331.769 1.9301 54.069 N2 %Total Input Exergy Exergy (J) Input moles or energy (J) Input mass (g) Species
Input Gases
8.711 0.001103 0.066253 SiO2 layer
Outputs
P = 5.83*10
Branham
82
83
4849.9 7.028779mol
196.9 N2
99.5 0.008511mol
0.34 Ar
60.79 0.015313mol
0.49 O2 .749
40928.6 0.029579mol
0.95 SiH4 %Total Inputs Exergy (J) Input moles or primary energy Input mass (g) Species
Input Deposition Gases
36.2 2220000
2220000J
Electricity
Input Energy
266931.6 0.437453mol
31.06 NF3 63.0
3598253 4.326643mol
69.41 CH4
Input Cleaning Gases
3.2667 0.000414mol
0.0248 Undoped Silicate Glass laye
Outputs
P = 5.33*10
Branham
84
Williams et al
85
Extraction Reduction to Silicon Metal SiO2 + C → Si + CO2 Conversion to Trichlorosilane, distillation Si + 3HCl → HSiCl3 + H2 CVD to produce polycrystalline Si (Polysilicon) HSiCl3 + H2 → Si + 3HCl Formation of monocrystalline Si ingot Cutting and polishing to produce Si wafers
86
87
Williams et al 2130kWh/kg = 7.7 GJ/kg Compare to Smil, Table A.12
88
Williams et al
89
Williams et al
90
Matthew Branham
91
Matthew Branham
92
Kuehr and Williams
93
(transportation, capital equipment, other materials, commercial buildings…
94
95
96
97
98
– Rate/scale – Aux equipment – Vapor/mat’l utilization – Purity/recycle – Aux. mat’ls – Environmental conditioning – Duty cycle (idle Vs working) – Yields
Al Si Steel