11 presentation of data and results
play

11 Presentation of Data and Results < previous - PDF document

11 Presentation of Data and Results < previous (https://www.pharmac.govt.nz/medicines/how-medicines-are-funded/economic-analysis/pfpa/10-sensitivity-analysis/) | next >


  1. 11 Presentation of Data and Results < previous (https://www.pharmac.govt.nz/medicines/how-medicines-are-funded/economic-analysis/pfpa/10-sensitivity-analysis/) | next > (https://www.pharmac.govt.nz/medicines/how-medicines-are-funded/economic-analysis/pfpa/appendix-1-pharmac-guidelines-for-reviewing-cuas/) 
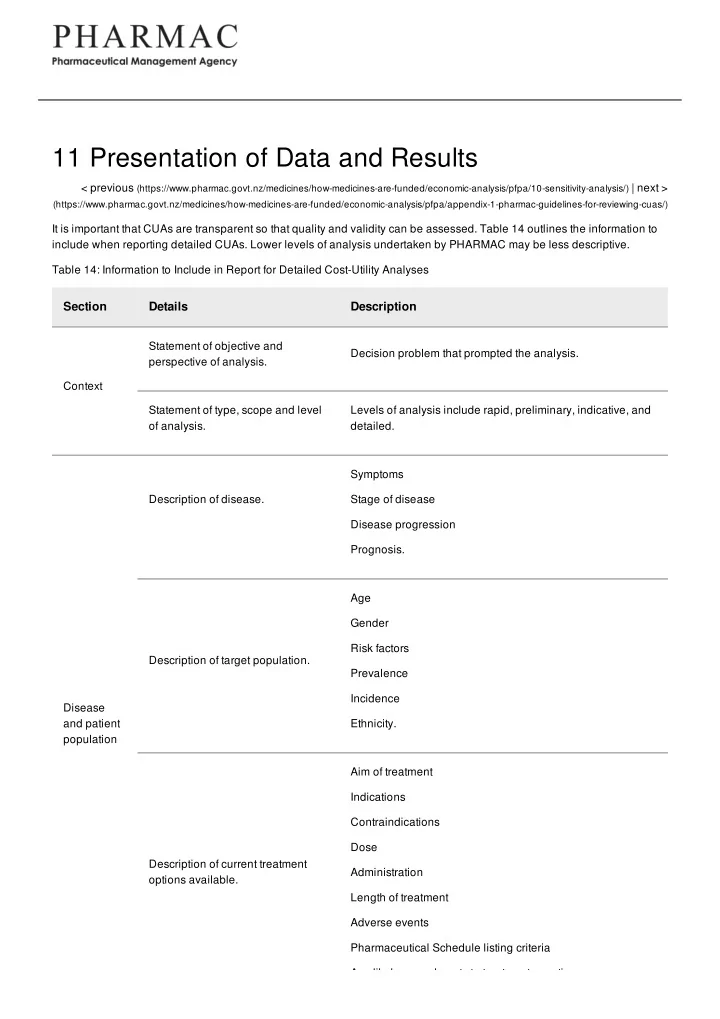
It is important that CUAs are transparent so that quality and validity can be assessed. Table 14 outlines the information to include when reporting detailed CUAs. Lower levels of analysis undertaken by PHARMAC may be less descriptive. Table 14: Information to Include in Report for Detailed Cost-Utility Analyses Section Details Description Statement of objective and Decision problem that prompted the analysis. perspective of analysis. Context Statement of type, scope and level Levels of analysis include rapid, preliminary, indicative, and of analysis. detailed. Symptoms Description of disease. Stage of disease Disease progression Prognosis. Age Gender Risk factors Description of target population. Prevalence Incidence Disease and patient Ethnicity. population Aim of treatment Indications Contraindications Dose Description of current treatment Administration options available. Length of treatment Adverse events Pharmaceutical Schedule listing criteria Any likely amendments to treatment over time.

  2. Any likely amendments to treatment over time. Section Details Description Indications Contraindications Formulation Strength Description of pharmaceutical. Dose Administration Study drug Length of treatment Adverse events. Registered and funded indication(s) Description of indication(s). Indication for which funding is sought (including any restrictions). Database searched Time period search undertaken Search strategy used Description of literature search strategy. Keywords Refinements Justification for excluding any citations. Design Study population Follow-up period Clinical Description of key clinical studies. evidence Intervention and comparator Withdrawals from treatment Clinical endpoints. Grade of evidence (GATE, SIGN) Critical review of clinical studies Possible sources of bias Methods of randomisation. Discussion of relevance of trial results to New Zealand clinical Efficacy compared with effectiveness. practice. Target population. Target population included in the analysis. Comparator(s). Rationale for choice of main comparator.

  3. Comparator(s). Rationale for choice of main comparator. Section Details Description Model type Transition states Model Description of model. Markov states Copy of decision tree or branch of decision tree. Time horizon and cycle length. Justification for time horizon and cycle length. Discount rate. Description of discount rate used for costs and benefits. Description of relevant outcomes Adverse events, disease progression, mortality, etc. and how they were measured. Include information on transitional probabilities and how these were derived, including details of any extrapolation of Transformation and extrapolation. Outcome data, synthesising data, etc. The inclusion of graphs and measures tables can be useful. List of parameter values. Including confidence intervals. List of assumptions. Assumptions regarding the structure of the model and data. Description of how HR-QoL was For example, methods for mapping to generic health state measured. instruments, use of expert opinion, etc. Health- related quality of life The health state (including a full description of the state) and Utility values used. corresponding utility value. Description of costs. Units of resources, unitary costs. Description of realisation of Information on whether a new treatment results in real Costs hospital costs. savings to DHBs, nominal savings, or additional costs. Description of data sources. Including any strengths or weaknesses of data sources. Disaggregation of costs, savings, life expectancy and quality of life gains/losses, as outlined in Chapter 9. Discounted incremental QALYs/$1M (point estimate and Results derived from the model. range) Results Corresponding cost/QALY results (point estimate and range), placed in brackets.

  4. Interpretation and discussion of Discussion on likely relative cost-effectiveness of Section Details Description results. pharmaceutical. Report using graphs, tables and/or elasticities. Include a full Results of sensitivity analysis. interpretation of the results. Sensitivity analysis Discussion of sensitivity to modelling assumptions and data Direction of bias and magnitude of effect. inputs. Discussion of results and other issues that should be considered For example, benefits to individuals and whānau other than Discussion under PHARMAC’s Factors for the person treated; health need and suitability. Consideration. Description of validation method For example, pharmacoeconomic review and/or clinical and result. review. Validation Comparison with published analyses, including analyses Explanation of any differences in results. undertaken by health technology assessment organisations. Description of setting to which the List of factors that could limit applicability in clinical practice. results of analysis can be applied. Conclusions Description of any research in Description of how new data may alter results of analysis. progress. 11.1 Checklist Table 15 is a checklist of information to include in PHARMAC base-case analyses and sensitivity analyses. Table 15: Checklist of Information to Include in Base-Case Analyses and Sensitivity Analyses

  5. Section Base-Case Analysis Sensitivity Analysis Perspectives that include costs and Funder (health sector) and individual, taking into Perspective health benefits to others, and costs account PHARMAC’s Factors for Consideration. falling outside the health sector. May consider inclusion of retrospective subgroup analyses if Target Population most likely to receive treatment. these data were of inadequate population quality to include in base-case analysis. May consider inclusion of placebo and/or most effective treatment (if Comparator Current clinical practice in New Zealand. different from current clinical practice). Include statistically insignificant outcomes. Statistically and clinically significant outcomes obtained May consider impact of including Clinical from high-quality RCTs, systematic reviews or meta- additional sources of clinical outcomes analyses (grade of evidence of 1+ or 1++). Include evidence (eg unpublished trials). impact of non-compliance if significant. Test all modelling assumptions, including any extrapolation of data. Base of NZ EQ-5D Tariff 2. Use GBD weights to check HR-QoL Alternative sources of utility values. for consistency. Pharmaceutical Deflate price by 2% per year as a Proposed price of pharmaceutical. costs proxy for inflation in other costs. Other costs Hospital, outpatient and patient costs. Vary costs over likely ranges. Discount rate 3.5% 0% and 5% < previous (https://www.pharmac.govt.nz/medicines/how-medicines-are-funded/economic-analysis/pfpa/10-sensitivity-analysis/) | next > (https://www.pharmac.govt.nz/medicines/how-medicines-are-funded/economic-analysis/pfpa/appendix-1-pharmac-guidelines-for-reviewing-cuas/) Last updated: 10 August 2017

Download Presentation
Download Policy: The content available on the website is offered to you 'AS IS' for your personal information and use only. It cannot be commercialized, licensed, or distributed on other websites without prior consent from the author. To download a presentation, simply click this link. If you encounter any difficulties during the download process, it's possible that the publisher has removed the file from their server.

Recommend


More recommend