
SLIDE 1
1
JOHAN DENNELIND PRESIDENT & CEO
YEAR-END REPORT JANUARY – DECEMBER 2018
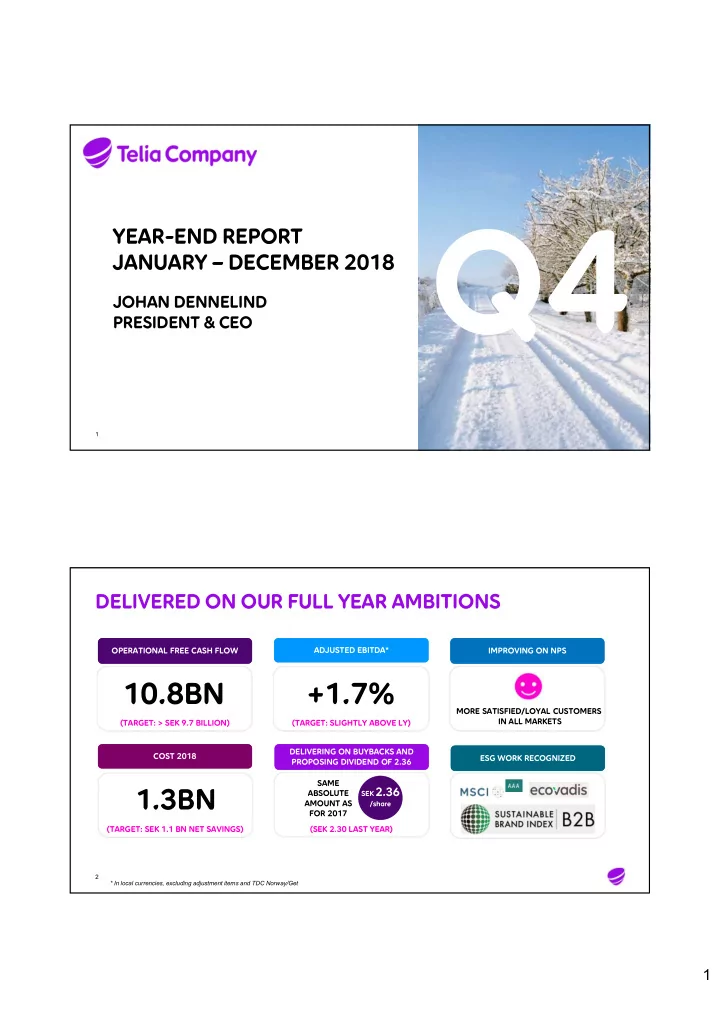
1DELIVERED ON OUR FULL YEAR AMBITIONS
OPERATIONAL FREE CASH FLOW OPERATIONAL FREE CASH FLOW COST 2018 COST 2018 DELIVERING ON BUYBACKS AND PROPOSING DIVIDEND OF 2.36 DELIVERING ON BUYBACKS AND PROPOSING DIVIDEND OF 2.36 ADJUSTED EBITDA* ADJUSTED EBITDA*1.3BN
10.8BN
SEK 2.36 /share+1.7%
(TARGET: > SEK 9.7 BILLION) (TARGET: SLIGHTLY ABOVE LY) (TARGET: SEK 1.1 BN NET SAVINGS) (SEK 2.30 LAST YEAR) * In local currencies, excluding adjustment items and TDC Norway/Get SAME ABSOLUTE AMOUNT AS FOR 2017 ESG WORK RECOGNIZED ESG WORK RECOGNIZED IMPROVING ON NPS IMPROVING ON NPS MORE SATISFIED/LOYAL CUSTOMERS IN ALL MARKETS 2