
SLIDE 1
ANGLO AMERICAN PLATINUM LIMITED
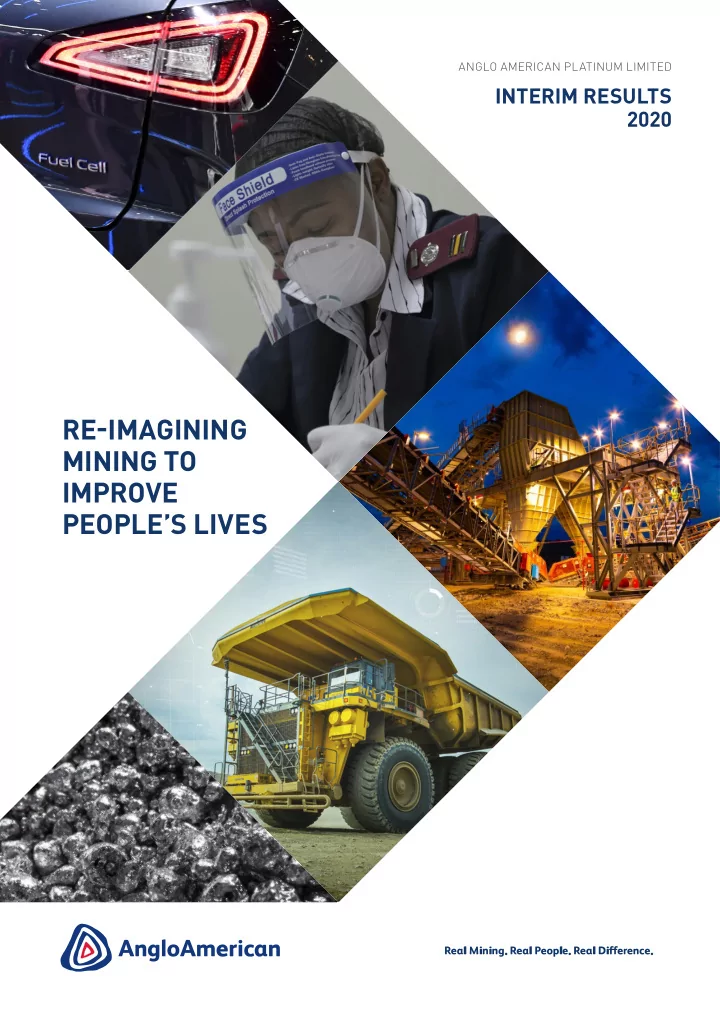
RE-IMAGINING MINING TO IMPROVE PEOPLES LIVES KEY FEATURES - - PDF document
ANGLO AMERICAN PLATINUM LIMITED INTERIM RESULTS 2020 RE-IMAGINING MINING TO IMPROVE PEOPLES LIVES KEY FEATURES FATALITY-FREE NET SALES REVENUE EBITDA Own managed operations 0 R54.8bn R13.1bn 2020 H1 R54.8bn 2020 H1 R13.1bn 2020
ANGLO AMERICAN PLATINUM LIMITED
1 Performance highlights 2 2020 Interim results commentary 18 Condensed consolidated statement
19 Condensed consolidated statement
20 Condensed consolidated statement
21 Condensed consolidated statement
22 Notes to the condensed consolidated financial statements 38 Auditor’s report 39 Sustainability commitments 41 Group performance data 65 2020 Interim results presentation IBC Administration
NET SALES REVENUE
R54.8bn R42.9bn 2020 H1 2019 H1
NET CASH
R11.3bn R6.0bn 2020 H1 2019 H1
BASIC EARNINGS PER SHARE
2,546 cents 2,788 cents 2020 H1 2019 H1
EBITDA
R13.1bn R12.4bn 2020 H1 2019 H1
ROCE
48% 45% 2020 H1 2019 H1
DIVIDEND PER SHARE
■ Interim ■ Final
2020 2019 4,160 cents cents 1,023 1,100
HEADLINE EARNINGS PER SHARE
2,627 cents 2,815 cents 2020 H1 2019 H1
EBITDA MARGIN
32% 31% 2020 H1 2019 H1
FATALITY-FREE
Own managed operations
2020 H1 2019 H1
Anglo American Platinum Limited Interim Results 2020 1
Six months ended Year ended 30 June 30 June 31 December 2020 2019 % change 2019
OPERATIONAL PERFORMANCE
Tonnes milled 000 tonnes 11,163 14,151 (21) 28,911 Built-up head grade 4E g/tonne 3.44 3.57 (4) 3.62 Total M&C PGM production1 000 oz 1,620 2,147 (25) 4,441 PGM ounces produced per employee per annum 80.2 107.5 (25) 110.5
REFINED PRODUCTION Total PGMs
000 oz 1,247 2,298 (46) 5,151 Platinum (Pt) 000 oz 538 1,100 (51) 2,514 Palladium (Pd) 000 oz 415 771 (46) 1,635 Rhodium (Rh) 000 oz 93 140 (33) 324 Other PGMs 000 oz 156 239 (35) 564 Gold (Au) 000 oz 45 48 (7) 114 Nickel (Ni) tonnes 5,126 9,822 (48) 23,036 Copper (Cu) tonnes 4,547 6,712 (32) 14,211
FINANCIAL PERFORMANCE
Total net sales revenue R million 54,771 42,887 28 99,551 from operations R million 39,905 39,193 80 91,697 from trading R million 14,866 3,694 302 7,854 Basket price per PGM ounce R/PGM oz sold 32,166 17,901 80 19,534 Cost of sales R million 41,781 32,126 30 72,737 Cost of sales per PGM ounce R/PGM oz sold 22,289 13,183 69 14,056 Cash on-mine cost per tonne milled R/tonne 1,008 853 18 890 Cash operating cost per PGM oz produced6 R/PGM oz 12,555 9,951 26 10,189 Gross profit on metal sales R million 12,990 10,761 21 26,814 Gross profit margin % 24 25 (1) 27 EBITDA R million 13,063 12,371 6 29,950 EBITDA (excluding trading) R million 12,577 12,328 4 29,703 EBITDA margin (excluding trading) % 32 31 1 32 Headline earnings R million 6,898 7,384 (7) 18,603 Headline earnings per share cents 2,627 2,815 (7) 7,087 Dividend per share cents 1,023 1,100 (7) 5,260 Capital expenditure (excluding waste stripping) R million 1,942 2,192 (12) 6,239 Capital waste stripping R million 1,395 1,148 22 2,062 Net cash R million 11,298 5,987 88 17,278 Return on average capital employed (ROCE) % 48 45 3 58
ENVIRONMENTAL, SOCIAL AND GOVERNANCE (ESG)
Fatalities Number — — — — Total recordable case frequency rate (TRCFR) Rate/million hrs 2.24 2.83 (21) 2.50 Employees2 Number (at period end) 25,239 25,263 (0) 25,268 HDSAs in management3 % 78 78 — 78 GHG emissions, CO2 equivalents4 1,000 tonnes 1,445 1,661 (13) 4,436 Water withdrawals or abstractions Megalitres 8,196 12,986 (37) 25,094 Energy use Terajoules 6,461 8,049 (20) 20,079 Number of Level 4 and 5 environmental incidents Number — — — — Total social investment excluding dividends5 R million 216 185 17 392
1 Sum total of platinum, palladium, rhodium, iridium, ruthenium and gold in concentrate produced and purchased. 2 Amplats total own and contractor employees excluding joint operations and associate employees and contractors. 3 Includes all levels of management. 4 Excludes Scope 3 emissions. 5 Total social investment includes SLP and CSI expenditure of R161 million and R55 million for Covid-19 related initiatives. Dividends to communities of R331 million
was paid during H1 2020.
6 H1 2019 restated to exclude chrome costs.
30 JUNE 2020 INTERIM RESULTS 2 Anglo American Platinum Limited Interim Results 2020
Anglo American Platinum Limited Interim Results 2020 3
– the temporary closure of the converter plant (ACP) for repairs following a force majeure incident, and the ongoing impact of the Covid-19 global pandemic
days at managed operations to 30 June 2020
during the pandemic
– comprehensive WeCare programme to protect lives and livelihoods of employees and communities – R1.2 billion paid to employees not working during lockdown to ensure all employees receive their full salaries and benefits – R251 million invested in additional Covid-19 measures including R55 million on community initiatives with various programmes benefiting over 1 million people
Zimbabwe – c.585,500 ounces lost in H1 2020
repairs and Eskom power outages that occurred in the first quarter
– EBITDA of R13.1 billion – Net cash position of R11.3 billion – Liquidity headroom of R16.6 billion (excluding customer prepayment)
headline earnings pay-out ratio
simplified business are in place to deliver further operational improvement and growth, utilising breakthrough technology, as well as a focus on developing the market for PGMs
and risk still exist that need to be managed, including the Covid-19 pandemic impacts, the repair of ACP Phase A, and potential for Eskom power outages
30 JUNE 2020 INTERIM RESULTS 4 Anglo American Platinum Limited Interim Results 2020
Natascha Viljoen, CEO of Anglo American Platinum, commented: “On behalf of everyone at Anglo American Platinum, I would like to pay our respects to the victims of the Covid-19 virus. We extend our deepest condolences to their family, friends and colleagues. Anglo American Platinum has faced significant headwinds in the first six months of 2020, with the impact of Covid-19
Anglo Converter Plant. Despite these challenges, our financial results, our response to Covid-19, as well as our continuous drive to P101 performance and the roll-out of technology in the last six months illustrate the resilience of the business and the ability and commitment of our team to live up to our purpose - ‘to re-imagine mining to improve people’s lives’. I am particularly proud of the important work we have been doing to help keep our employees and host communities healthy during the pandemic, with R55 million invested in community relief efforts. We developed our comprehensive WeCare lives and livelihoods programme in close collaboration with a wide range of stakeholders to help identify and address the areas of greatest need. Our efforts include water and food supply, support to local clinics and hospitals, Covid-19 education and awareness campaigns and supporting victims of gender-based violence. The health, safety and wellbeing of our employees and contractors is the heart of our approach, and we have invested R251 million in industry-leading measures to limit the spread of the virus at the workplace and our communities. These investments include our own testing laboratories and isolation and quarantine facilities. We have been in the fortunate position to continue paying all employees throughout the lockdown, including those who are still not yet back at work. This group covers vulnerable employees who are at high risk of serious illness should they contract the virus, due to age or underlying health conditions. To date, we have spent more than R1.2 billion on salaries and benefits during the lockdown for employees not working. Covid-19 has shone the spotlight on many of the serious needs in our communities, which no organisation or institution can address fully on its own. The pandemic has offered us a unique opportunity to work together in new ways with our stakeholders, and I believe we are investing in partnerships and solutions that will continue to benefit all our stakeholders long after the pandemic is over. Despite the challenges and safety risks brought about by shutting down and restarting operations, we have reported our best ever safety performance in the past six months, with managed operations running without a fatal incident for an unprecedented consecutive 620 days to the end of June. Strong leadership commitment to safety, despite the additional risk brought about with the uncertainty of Covid-19, allowed us to achieve this result. The shutdown of operations in South Africa and Zimbabwe in response to Covid-19, has seen a 25% decline in output year-on-year to 1.6 million PGM ounces. However, by the end of June, our own-mine production levels were at around 80% of normal capacity, and we expect this to increase to above 95% by the end of the year, as our own-mines benefit from a high proportion of open-pit and mechanised production. Refined production (excluding tolling) declined by 49% to 1.0 million ounces in the first half due to the impact of a force majeure incident resulting in the temporary closure of ACP, as well as power interruptions that occurred in the first quarter of the year. As a result of the temporary closure of ACP in the first half, we saw a large build-up of work-in- progress inventory. Repairs to Phase B have completed and is operating at full capacity. I am pleased to report that the repair work on Phase A at ACP is progressing well and should be completed by the end
Our financial performance was underpinned by strong prices for our metals, with the PGM basket price up 80% per PGM
We ended the period with an increase in EBITDA to R13.1 billion, a net cash position of R11.3 billion and an increase in return on capital employed to 48% in the period. As always, we remain committed to disciplined capital allocation, prioritising the need to maintain asset integrity, ensuring a strong balance sheet, and continue our base dividend pay-out ratio of 40% of headline earnings. The Board has declared an interim dividend of R10.23 per share. As we build the business for the future, our focus remains on implementing technological improvements and innovation across our operations to meet and exceed the world benchmarks for operational excellence. We also continue with our market development efforts. We believe the metals we mine are uniquely positioned to help address global climate and clean air challenges, and we are encouraged by recent further developments in the hydrogen
Anglo American Platinum Limited Interim Results 2020 5
MANAGING THROUGH THE COVID-19 PANDEMIC South Africa protocols
On 23 March 2020, South Africa’s President Cyril Ramaphosa declared a national lockdown to curb the spread of Covid-19 and ensure national preparedness for the pandemic. The lockdown was initially set for 21 days, effective from midnight 26 March. On 9 April, the President extended the lockdown period to end at midnight on 30 April. It was then announced, on 23 April, that the country would be taking a risk- adjusted strategy to opening the economy. This would see the country move from a hard lockdown (Level 5) which, with respect to mining, would only allow certain open-pit mining operations and processing facilities to operate, to the next level down (Level 4) from 1 May. At Level 4, mining activity could resume in a phased approach at 50% of normal capacity for underground mines and a 100% for open-pit and processing facilities. From 1 June, the country moved to Level 3, and all mining operations are permitted to operate at full capacity, if effective Covid-19 safety measures and protocols are in place.
Zimbabwe protocols
On 28 March 2020, Zimbabwe’s President Emmerson Mnangagwa declared a national lockdown for 21 days, effective from midnight on 30 March. The lockdown was subsequently extended indefinitely, subject to fortnightly reviews. However, permission remains in place for mining and processing activities at Unki to continue at full capacity, and the mining operations restarted on 7 April 2020.
Safety
At Anglo American Platinum, the safety and health of all employees and host communities is our absolute priority and our first value across the business. We are committed to the elimination of fatalities, and our performance in the first six months has continued the company’s record fatality-free performance to 620 consecutive days at own-managed operations. Tragically, at Kroondal mine, a non-managed joint operation, there was a fatal incident on 17 January 2020. While drilling roof bolt support holes, a rock dislodged and fatally injured Joao Silindane. Our sincere condolences go to his family, friends and colleagues. Improvements in safety continue, despite the challenges associated with the Covid-19 pandemic and, in the six-month period under review,
15% to 2.24 per million hours worked. During this period, we have safely managed the operations through the unique risks posed by both a safe shutdown and the start-up of
Health
Anglo American Platinum’s response to Covid-19 has been founded
contractors and communities come first. While we have stringently followed both government and industry guidelines, we have sought to be proactive in our approach to testing and monitoring, and the implementing of both preventative and treatment measures. From a preventative perspective, we acted promptly in line with regulations and guidelines to implement the safe shutdown of most
and occupational hygiene protocols, imposed strict travel restrictions for personnel, and introduced appropriate respiratory protection equipment and social distancing protocols on sites that were still
collaboration with safety and health committees and the Department
ensure they support our actions. We implemented Anglo American’s global WeCare lives and livelihoods programme, providing a broad range of urgent support covering physical and mental health, community support and support to victims of gender- based violence. Measures that have been implemented include:
and local communities;
screen at home, preventing those with symptoms from coming to the operations and keeping colleagues safe from infection;
comprehensive screening of all employees and contractors entering the operations, and their ongoing well-being;
distancing;
embedding safe and hygienic behaviour, with use of hand sanitiser;
facilities across our operations which can perform 2,500 tests per day;
support 2,500 individuals who require quarantine or isolation;
telephonic support as well as on-site support for employees in need. In addition, we have a 24-hour counselling line in place to specifically assist those residents at our quarantine/isolation sites. In addition, a comprehensive risk-based screening strategy was enacted across all sites to ensure that potentially infected employees were identified for testing and quarantine. Employees who have undergone medical assessments which determine them to be vulnerable, or those aged 60 years and older, have not been recalled to work during the Covid-19 pandemic to ensure their safety. In total, around 1,500 vulnerable employees were identified across our
aid benefits and, where appropriate, housing allowances.
Employee and community response plan
All Anglo American Platinum employees and fixed-term contractors, including all those who have not been able to work as a result of the lockdown, have been paid their full fixed pay, pension and medical benefits, as well as housing allowances where applicable, for the full duration of the extended lockdown period. The Board and Executive Committee of Anglo American Platinum fully supported the call by President Ramaphosa to contribute to supporting the national fight against the spread of Covid-19. The non-executive directors elected to contribute 30% of their fees for three months to charities that are aiding the pandemic relief effort. The CEO and Finance director donated 30% of their salaries for three months to the Solidarity Fund. Moreover, all the Executive team elected to contribute to the employee-matching scheme supported by the Anglo American Foundation, and many employees have chosen to make contributions to charities of their choice. The South African government has announced measures to not only combat the spread of the virus, but to support those affected most severely, such as the poor, the homeless, informal traders, and small and medium-sized businesses. Anglo American Platinum is fully committed to support the government on these critical initiatives.
30 JUNE 2020 INTERIM RESULTS 6 Anglo American Platinum Limited Interim Results 2020 Our WeCare programme to combat Covid-19 in our host communities is split into four phases:
Covid-19 in the communities.
education (radio interviews, social media, community newspapers, training of local and traditional faith leaders). This also encompasses: the provision of masks and sanitisers to local leaders and taxi drivers, provision of water to communities, training local government healthcare workers on Covid-19 protocols, and providing PPE to local community clinics and health workers.
parcels for the vulnerable, support in tackling gender-based violence, helping small and medium-sized businesses, establishing screening stations at local government clinics, providing ongoing PPE, medical equipment, assisting government clinics with training, screening and swabbing, as well as supporting schools and tutoring.
small business and entrepreneurs; helping to ensure the safe re-
and backing employment programmes to assist those who find themselves unemployed post the Covid-19 crisis. The company is helping more than 430 villages through these various initiatives, and 24,000 food parcels and vouchers have been distributed to vulnerable households. Through our water programme, we are supporting 23 villages in South Africa and 10 in Zimbabwe with boreholes and water reticulation. In addition, we are assisting local communities around our operations by providing water trucks; as a result, 53,000 community members will have water for drinking and personal hygiene. We will support 77 local clinics and hospitals and have sourced twenty-five ventilators for hospital use. Our radio campaign on regional and community stations reached in excess of 4.6 million people. We ran awareness and educational campaigns on Covid-19 in May and June, in partnership with the Department of Health. In addition to Covid-19 awareness and education, the company used the radio slots to inform communities about our support initiatives. In response to Covid-19, Unki in Zimbabwe has provided support to its host communities through a comprehensive response plan, focusing on food and water provisions, and the supply of medical equipment to establish a 10-bed intensive care unit ward at the Gweru Provincial Hospital.
Small business support
Anglo American Platinum has developed a supplier response plan which delivers a range of support, including reviewing payment terms, committing as far as possible to early settlement of invoices for small businesses and assisting in small-business owners in applying for help from government and other NGO assistance programmes.
OPERATIONAL PERFORMANCE Total PGM production – metal in concentrate
H1 2020 H1 2019 % Total production (M&C) (’000 ounces) (’000 ounces) change PGMs 1,619,900 2,146,900 (25) Platinum 748,400 992,200 (25) Palladium 531,600 673,700 (21)
Impact on production from Covid-19 lockdowns
Production Lost PGM production (M&C) level at end Impact from Q1 2020 Q2 2020 June 2020 Covid-19 (’000 ounces) (’000 ounces) % Mogalakwena 9,000 46,900 100 Amandelbult 15,400 174,000 50 Mototolo 5,100 48,000 90 Unki 3,400 17,600 100 Joint operations 14,800 126,000 85 Third-party purchase
16,300 109,100 100 AAP total 63,900 521,600 85 Total PGM production and gold (expressed as platinum, palladium, rhodium, gold, iridium and ruthenium metal in concentrate) in the first six months of 2020 decreased by 25% year on year to 1,619,900
to Covid-19 and some operational challenges in the first quarter. By the end of June, production levels were at around 85% of normal production capability. The 4E built-up head grade of 3.44 grams per tonne was 4% lower compared with the corresponding period in 2019 owing to Mogalakwena producing lower grades of ore, as the mine, for certain periods of the national lockdown, utilised higher volumes from lower- grade ore stockpiles in order to fill the mills.
Own-managed mines
PGM production from own-managed mines (Mogalakwena, Amandelbult, Unki and Mototolo) decreased by 24% to 939,600
decreased by 25% to 423,500 ounces and palladium output declined by 19% to 363,100 ounces. By the end of June, production levels at own-managed mines were around 80% of normal production capability. Owing to the measured and conservative ramp-up (notably at Amandelbult), no operation had to close temporarily following outbreaks of Covid-19 at own-managed
to be around 90% by the end of the third quarter and around 95% by year-end, on the assumption of some but no major Covid-19 interruptions.
Mogalakwena
H1 2020 H1 2019 % Total production (M&C) (’000 ounces) (’000 ounces) change PGMs 559,900 609,700 (8) Platinum 239,200 258,300 (7) Palladium 257,500 281,000 (8) PGM production decreased by 8% compared to the first half of 2019, mainly due to the Covid-19 shutdown. In addition, production was affected by maintenance at the North concentrator and lower built-up head grade following a drawdown of ore stockpiles, though this was partially offset by improved concentrator recovery. When South Africa announced the national lockdown, Mogalakwena’s non-mining, surface operations were granted the right to continue
by drawing-down on ore stockpiles. Thereafter, a gradual increase in
this level for the balance of the year.
Anglo American Platinum Limited Interim Results 2020 7 % Key financials H1 2020 H1 2019 change EBITDA (R million) 6,443 6,280 3 Economic free cash flow (R million) 3,022 3,807 (21) AISC1 ($/Pt oz) $(594) $(292) 103
1
All-in sustaining costs (AISC) (includes operating costs as defined above, all sustaining capital expenditure, capitalised waste stripping and allocated marketing and market development costs net of by product revenue) per platinum ounce sold
The mine delivered an EBITDA margin of 57%, (H1 2019: 57%). Return
annualised basis). Cash operating costs (costs after allowing for off-mine smelting and refining activities) increased by 2% to R5.1 billion (H1 2019: R5.0 billion). Cash operating costs, including capitalised waste stripping, increased by 7% to R6.5 billion (H1 2019: R6.1 billion). Cash operating costs per PGM ounce (metal in concentrate), excluding the non-productive labour costs, increased by 10% to R8,978 per
AISC reduced to a negative $594 per platinum ounce, due to a stronger palladium price and weaker rand.
Amandelbult
H1 2020 H1 2019 % Total production (M&C) (’000 ounces) (’000 ounces) change PGMs 217,800 421,700 (48) Platinum 110,900 215,100 (48) Palladium 50,800 98,600 (48) Chrome 260,900 424,000 (38) PGM production decreased by 48% against the first half of 2019. This decline was mainly as a result of the national lockdown, the closure of parts of the Tumela Upper section in December 2019 as they reached the end of life of mine (these sections had contributed 30,100 PGM
January and February this year causing a loss of 8,300 PGM ounces. At the end of June, Amandelbult mine was operating at a production level
production levels of 75% and, by year-end, should reach approximately 85%. Over 1,000 vulnerable employees have been identified at Amandelbult who will not be recalled for work during the Covid-19 pandemic and in addition, some labour crews are being redeployed to accelerate the implementation of modernised equipment in the mine. Chrome production from Amandelbult decreased by 38%, yielding 260,900 tonnes of chrome concentrate on a 100% basis (H1 2019: 424,000 chrome tonnes). This was due in part to a 17% decrease in plant feed as a result of the Covid-19 shutdowns. % Key financials H1 2020 H1 2019 change EBITDA (R million) 2,281 1,785 28 Economic free cash flow (R million) 1,575 504 213 AISC1 ($/Pt oz) (176) 672 126
1
All-in sustaining costs (AISC) (includes operating costs as defined above, all sustaining capital expenditure, capitalised waste stripping and allocated marketing and market development costs net of by product revenue) per platinum ounce sold
Amandelbult delivered an EBITDA margin of 29%, up from 26% in the corresponding period in 2019. ROCE increased to 56% from 33%. Cash operating costs decreased by 13% to R4.5 billion (H1 2019: R5.2 billion), driven by lower production. The mine continued to incur full labour costs during the lockdown period and paid R616 million to employees who could not be utilised productively during that time. Excluding the non-productive labour costs, cash operating costs per PGM ounce (metal in concentrate) were R17,798 (H1 2019: R12,247), reflecting lower volumes and other fixed costs being incurred. Economic free cash flow significantly increased due to the increase in rhodium and palladium prices and the weakening of the rand. This resulted in the improvement in the all-in sustaining unit cost per platinum ounce. Amandelbult chrome contributed attributable free cash flow of R102 million (H1 2019: R262 million), which was lower because of a decrease in the chrome price and a reduction in sales volumes arising from lower production.
Mototolo
H1 2020 H1 2019 % Total production (M&C) (’000 ounces) (’000 ounces) change PGMs 81,500 107,300 (24) Platinum 37,700 49,800 (24) Palladium 23,000 30,300 (24) Mototolo’s PGM production decreased by 24% to 81,500 PGM ounces from 107,300 PGM ounces. The impact of Covid-19 shutdowns was the primary reason for the lower production. Collaboration with labour unions was key to re-starting operations, and these discussions with Mototolo’s majority labour union, General Industries Workers Union of South Africa (GIWUSA), lasted approximately six weeks. At the end of June, Mototolo mine was operating at a production level
production levels of 100%. % Key financials H1 2020 H1 2019 change EBITDA (R million) 823 722 14 Economic free cash flow (R million) 483 443 9 AISC1 ($/Pt oz) (320) 237 235
1
All-in sustaining costs (AISC) (includes operating costs as defined above, all sustaining capital expenditure, capitalised waste stripping and allocated marketing and market development costs net of by product revenue) per platinum ounce sold
The mine delivered an EBITDA margin of 38% and a ROCE of 44% up from 40% in the first half of 2019. Cash operating costs reduced by 8% from R1,127 million to R1,043
lockdown period and paid out R103 million to employees who have not worked during the period. Excluding the non-productive labour costs, cash operating costs per PGM ounce rose by 10% to R11,524 (H1 2019: R10,511), attributable to lower volumes and other fixed costs being incurred.
Unki
H1 2020 H1 2019 % Total production (M&C) (’000 ounces) (’000 ounces) change PGMs 80,300 95,800 (16) Platinum 35,700 42,400 (16) Palladium 31,700 37,900 (16)
30 JUNE 2020 INTERIM RESULTS 8 Anglo American Platinum Limited Interim Results 2020 PGM production decreased by 16% to 80,300 PGM ounces from 95,800 PGM ounces, primarily due to the Covid-19 shutdown. When Zimbabwe announced a national lockdown on 28 March 2020, Unki mine conducted a safe and measured ramp-down to care and
recognised mining as an essential service and Unki was able to ramp up to full production. As a result of the precautions taken to ensure a safe start, mining operations lost nine days of production, concentrator
end of June, the mine was operating at normal 100% production levels and is expected to continue at this level to the end of the year. % Key financials H1 2020 H1 2019 change EBITDA (R million) 562 488 15 Economic free cash flow (R million) 129 229 (44) AISC1 ($/Pt oz) 525 456 (15)
1
All-in sustaining costs (AISC) (includes operating costs as defined above, all sustaining capital expenditure, capitalised waste stripping and allocated marketing and market development costs net of by product revenue) per platinum ounce sold
The mine delivered an EBITDA margin of 28% and a ROCE of 14%. Cash operating costs increased by 2% to R1.1 billion. As a US dollar- denominated operation, Unki was affected adversely by the weakening
R156 million to its cost base on conversion. Cash operating costs per PGM ounce, excluding the foreign currency impact and non-productive labour costs paid to employees at the start of the lockdown, increased by 2% to R11,521 per ounce (H1 2019: R11,327 per ounce), driven by lower volumes and other fixed costs being incurred. Unki generated economic free cash flow of R129 million, (H1 2019: R229 million), with AISC increasing to $525 per platinum ounce.
Joint operations (own-mined and purchase of concentrate)
Total PGM production from joint operations (Modikwa and Kroondal) are on a 100% basis and inclusive of both own-mined and purchase
H1 2020 H1 2019 % Total production (M&C) (’000 ounces) (’000 ounces) change PGMs 290,400 438,600 (34) Platinum 129,300 198,100 (35) Palladium 86,400 127,200 (32)
Modikwa
Total production (M&C) H1 2020 H1 2019 % – mined and purchased (’000 ounces) (’000 ounces) change PGMs 103,600 135,200 (23) Platinum 40,600 53,800 (25) Palladium 39,100 50,300 (22) Modikwa’s production decreased by 23% to 103,600 PGM ounces (H1 2019: 135,200 PGM ounces), mainly due to the Covid-19 shutdowns. Modikwa operated at around 50% of normal production capability at the end of June and is expected to increase to 90% by end of the third quarter and increase to 100% by year-end. Our share of Modikwa’s costs reduced 3% or R25 million to R793 million. Modikwa mine incurred R87 million on non-productive labour costs during the lockdown period. Excluding the non-productive labour costs, Modikwa’s unit cost per PGM ounce produced rose 13% to R13,621 (H1 2019: R12,085).
Kroondal
Total production (M&C) H1 2020 H1 2019 % – mined and purchased (’000 ounces) (’000 ounces) change PGMs 186,800 303,400 (38) Platinum 88,700 144,300 (39) Palladium 47,300 76,900 (38) PGM production decreased by 38% to 186,800 PGM ounces (H1 2019: 303,400 PGM ounces), primarily due to Covid-19 shutdowns. Production was further affected by safety-related stoppages following the fatality on 17 January and an underground-vehicle fire incident in March. In addition, owing to the temporary closure of the Anglo American Platinum Converter Plant (ACP), resulting in the declaration of force majeure to purchase-of-concentrate suppliers, it was agreed that 50%
would be sold to, and processed by, Sibanye-Stillwater for the duration
material equivalent to 16,000 PGM ounces in the first half of this year. Kroondal was operating at 100% capacity at the end of June and is expected to remain at this level. Our share of Kroondal’s costs reduced by 8% to R1.3 billion. Kroondal mine incurred R139 million on non-productive labour costs during the lockdown period. Excluding the non-productive labour costs, unit cost per PGM ounce produced increased by 33% to R12,239 (H1 2019: R9,187).
Purchase of concentrate from third parties
Total production (M&C) H1 2020 H1 2019 % – mined and purchased (’000 ounces) (’000 ounces) change PGMs 390,000 473,800 (18) Platinum 195,600 228,400 (14) Palladium 82,000 98,800 (17) Purchase of PGM concentrate from third parties decreased by 18% as volumes received from Bafokeng-Rasimone Platinum Mine (BRPM) and Siyanda Resources declined owing to the impact of the Covid-19 shutdowns.
ACP repairs
The company’s ACP Phase A converter plant, at Waterval in Rustenburg, was damaged following an explosion within the converter
well under way to repair Phase A, which is expected to be completed by the year-end. As per normal business procedure, Phase B was commissioned to take over from Phase A and was in the process of ramping up to steady state, when water was detected in the furnace. Notwithstanding extensive testing being conducted to determine the source of the water, and several circuits being isolated, water continued to be
that there was no other option but to temporarily shut down Phase B to ensure the safety of all employees and avoid a catastrophic explosion event. The repairs to ACP Phase B, which were expected to take 80 days, were completed ahead of schedule and a safe ramp-up was completed, with the ACP Phase B fully operational from 12 May 2020. On 31 May 2020, a separate water leak, unrelated to the previous incident, was detected in the high-pressure cooling section of ACP Phase B. The company took the decision to again temporarily close ACP Phase B to ensure an ongoing safe operating environment,
Anglo American Platinum Limited Interim Results 2020 9 protect employees and protect the integrity of the plant. Following repair work, ACP Phase B was able to conduct a safe ramp-up, with
A cautious approach has been taken with the on-going operation of ACP Phase B during this period with increased monitoring likely to result in intermittent stoppages to inspect the plant until the repairs to ACP Phase A are completed. The repairs to ACP Phase A are progressing well and are now expected to be completed towards the end of 2020, ahead of original expectations of Q2 2021, owing to the successful accelerated procurement of key long-lead-time items.
Refined production (excluding tolling and 4E purchase
Refined production excluding 4E POC H1 2020 H1 2019 % and toll refining (’000 ounces) (’000 ounces) change PGMs 1,019,300 2,003,500 (49) Platinum 400,900 923,100 (57) Palladium 344,500 678,400 (49) Refined PGM production (excluding toll-treated metal and concentrate purchased from Sibanye-Stillwater) decreased by 49% to 1,019,300
shutdown at the ACP and Eskom load-shedding interruptions during the first quarter. The annual stock count was completed as per normal business practice during the first half. This excluded the precious metals refinery, where the stock count, which is scheduled every three years, was completed in 2019. This resulted in a net stock count loss, mainly affecting palladium and rhodium of c.25,000 3E PGM ounces. In comparison, in 2019 we had a stock count gain mainly impacting platinum and palladium of c.120,000 3E ounces. As a result of the ACP process interruptions, the platinum work-in- progress inventory increased from a pipeline inventory level of c.950,000 3E ounces at the 2019 year-end, which included an 89,000 PGM ounce build-up due to the Rustenburg power disruptions in Q4 2019, to c.1,450,000 3E ounces at the end of June 2020. The higher than normal work-in-progress stock levels are expected to be released by the end of 2021.
Refined production (including tolling)
Refined production H1 2020 H1 2019 % including toll refining (’000 ounces) (’000 ounces) change PGMs 1,246,900 2,298,200 (46) Platinum 537,900 1,100,500 (51) Palladium 414,900 770,900 (46) Total refined PGM production, including tolling, decreased by 46% to 1,246,900 ounces. In the first six months of 2020, toll-refining volumes, on a 4E basis, amounted to 227,600 ounces (H1 2019: 153,400 ounces). Platinum production tolled amounted to 137,000 ounces, while palladium tolled production was 70,400 ounces.
Sales volumes (excluding trading volumes and 4E purchase of concentrate now tolled)
Sales volume (excluding traded and 4E POC volumes H1 2020 H1 2019 % now tolled) (’000 ounces) (’000 ounces) change PGMs 1,229,300 1,992,100 (38) Platinum 435,600 916,000 (52) Palladium 383,400 711,100 (46) PGM sales volumes decreased by 38% to 1,229,300 ounces. Platinum sales volumes decreased by 52% to 435,600 ounces, while palladium sales declined by 46% to 383,400 ounces, largely due to the ACP
Trading volumes
H1 2020 H1 2019 % (’000 ounces) (’000 ounces) change PGMs 459,200 184,700 149 Platinum 146,300 18,000 713 Palladium 292,300 139,700 109 PGM trading volumes increased by 149%, as additional metal was sourced from third parties to mitigate the supply disruption to our customers following the temporary closure of the ACP .
FINANCIAL PERFORMANCE H1 2020 overview
The financial performance of the Company in the first half of the year was impacted by the temporary closure of the Anglo Converter Plant (ACP) and the Covid-19 pandemic. The resilience of the business assisted us in managing through these headwinds and despite their impact the Company achieved EBITDA of R13.1 billion, an increase of 6% over the R12.4 billion in H1 2019. The EBITDA margin was 32% (H1 2019: 31%) driven by higher prices for
period at R6.9 billion (H1 2019: R7.4 billion) with headline earnings per share of 2,627 cents (H1 2019: 2,815), a decrease of 7%. The Company’s balance sheet remained strong, with net cash of R11.3 billion, after paying a 2019 final dividend of R11.1 billion in March 2020. Return on capital employed increased to 48% (H1 2019: 45%). % Key financials H1 2020 H1 2019 change Dollar basket price per PGM
1,956 1,255 56 Rand basket price per PGM
32,166 17,901 80 Revenue (R billion) 54.8 42.9 28 EBITDA (R billion) 13.1 12.4 6 EBITDA margin (%) 32% 31% 1pp Headline earnings (R billion) 6.9 7.4 (7) Headline earnings per share (R/share) 26.27 28.15 (7) Basic earnings (R billion) 6.7 7.3 (9) Basic earnings per share (R/share) 25.46 27.88 (9) Operating free cash flow (R billion) 5.0 7.4 (33) Net cash (R billion) 11.3 6.0 88 Dividend per share (R/share) 10.23 11.00 (7) ROCE (%) 48 45 3pp
30 JUNE 2020 INTERIM RESULTS 10 Anglo American Platinum Limited Interim Results 2020
Sales revenue
Net sales revenue increased by 28% to R54.8 billion (H1 2019: R42.9 billion), mainly due to higher PGM prices and higher sales from trading
per PGM ounce, attributable to a 53% increase in the palladium price and a 216% increase in the price of rhodium. The stronger US dollar basket price, coupled with a 15% weakening of the rand against the US dollar, resulted in an 80% higher rand basket price of R32,166 per PGM ounce sold (H1 2019: R17,901). This was partly offset by a 28% decrease in PGM sales volumes due to the temporary ACP closure and the impact of Covid-19, as well as lower chrome sales, which were affected by a combination of lower production due to Covid-19 and disruptions to the movement of product to the port. Additional PGM metal was sourced from third parties to mitigate the supply disruption to customers following the temporary closure of the ACP . As a result, revenue generated from third-party purchases increased by R11.2 billion to R14.9 billion. Revenue from tolling was R0.4 billion for the half-year, a decrease of 22% due to the declaration of force majeure in March following the ACP temporary shutdown.
Cost of sales
On-mine costs (mines and concentrators) decreased by 6% to R11.3billion, reflecting lower mining activity as a result of the lockdown and processing costs decreased by 2% to R3.8 billion, as variable costs were saved during the ACP temporary shutdown. The lower
for unproductive labour during the lockdown period which was part of the Company’s decision to support the well-being of its employees. Costs associated with the purchase-of-concentrate increased by R4.5 billion to R13.9 billion (H1 2019: R9.4 billion) because of higher prices and weaker exchange rates. Purchased and borrowed metal costs increased to R16.8 billion from R3.4 billion in the corresponding prior period, reflecting increased trading activity to mitigate supply risk. Other costs increased by R0.3 billion to R2.3 billion (H1 2019: R2.0 billion) primarily related to higher royalty costs of R0.3 billion. The company supports the government’s approach to mitigate the spread
contributions towards healthcare and community-response plans. As a result of the increased trading activity and higher purchase-of- concentrate expenditure, cost of sales increased by 30% to R41.8 billion. This was partially offset by a decrease in operational costs as a result of reduced activity due to Covid-19 and cost-saving initiatives of R2.0 billion that have been undertaken across the business. In line with the 28% decrease in mining production, the unit cost of production per PGM ounce rose by 26% to R12,555 (H1 2019: R9,951). Excluding the costs associated with unproductive labour amounting to R1.2 billion, or R1,057 per ounce unit costs would have been R11,498, or 16% higher than H1 2019. The all-in sustaining cost for own mined production was $(480) per platinum ounce sold, compared with an achieved price of $857 per platinum ounce.
EBITDA
EBITDA increased by R0.7 billion to R13.1 billion (H1 2019: R12.4 billion). This was mainly due to the higher US dollar palladium and rhodium prices and the weaker rand/dollar exchange rate, contributing R9.6 billion and R2.6 billion respectively, whilst inflation and higher royalties reduced EBITDA by R0.9 billion. Operational headwinds eroded R11.2 billion of
lower cost compared to the prior year, before the impact of the R1.2 billion in labour costs for people not working during the lockdown and R0.3 billion expenditure incurred in respect of Covid-19 healthcare and community response plans.
Capital expenditure
The company’s capital-allocation framework highlights the importance
resilience, asset integrity and environmental compliance. Interruptions to operational activity across the company as a result of Covid-19 lockdowns impacted capital expenditure plans in the first six months of
and capitalised waste stripping, reduced by R0.2 billion to R1.9 billion (H1 2019: R2.1 billion). Capital expenditure % (R billion) H1 2020 H1 2019 change Stay in business 1.2 1.3 (8) SO2 abatement 0.2 0.4 (57) Projects 0.2 0.3 (24) Breakthrough 0.3 0.1 373 Capitalised waste stripping 1.4 1.1 21 Stay-in-business (SIB) capital expenditure was R1.2 billion, focused on tailings dams, Mogalakwena heavy machinery equipment, smelter rebuilds, and capital maintenance for asset reliability. As previously guided, the SO2-abatement project for the Polokwane smelter began in 2018 (capital spend to date of R1.4 billion), and this will continue through 2020. The Mortimer smelter’s SO2-abatement project is expected to start in 2021. The ACP Phase B repair total cost is R150 million, and it is anticipated an additional R0.4 billion will be spent on the repairs to ACP Phase A in the second half of 2020. Project capital was R0.2 billion, lower than the comparative period, and lower than planned as a result of deferments attributable to the Covid-19 lockdowns, which affected both the Unki debottlenecking project in Zimbabwe and the Tumela 15E mechanisation project in South Africa. Other main projects in execution are the construction of the Modikwa Chrome plant and the development of UG2 North 1 Phase 2 also at Modikwa, which are both progressing well, with minimal disruption as a result of the lockdown restrictions. A further R0.3 billion has been spent on breakthrough projects to reach and exceed benchmark performance. These include Mogalakwena coarse particle rejection and bulk ore sorting, Amandelbult modernisation and the Rustenburg Base Metal Refinery (RBMR) copper debottlenecking project. During the period under review, R54 million was spent on project studies on expansion opportunities at Mogalakwena and Mototolo/ Der Brochen. Over the six-month period, waste-stripping costs increased by 53%
cut at Mogalakwena.
Working capital
Trade working capital (inventory, trade debtors, trade creditors and the customer pre-payment) at 30 June 2020 was R6.6 billion, equivalent to 47 days, compared with R3.1 billion at 31 December 2019 (3 days). The net increase was attributable to the higher work-in-progress inventory
the increase in purchase-of-concentrate prices. This was offset in part by a net stock count loss of R0.8 billion (H1 2019: stock count gain of R1.0 billion). The stock count loss comprised mainly palladium and rhodium volume with c.14,000 and c.11,000 ounce losses respectively. The stock adjustment was within the acceptable range.
Anglo American Platinum Limited Interim Results 2020 11 Trade creditors were R2.1 billion lower compared to December 2019
and June this year, on revised payment terms, due to the declaration
resulting in R0.7 billion lower purchase-of-concentrate creditors, and R1.4 billion lower trade creditors resulting from a decrease in procurement during the lockdown. The customer pre-payment of R16.1 billion increased by R6.7 billion, driven by higher metal prices and a weaker rand. Other working capital was R1.8 billion higher than 31 December 2019, largely as a result of outstanding VAT refunds owed to the company.
Net debt and liquidity
The company ended the period in a net cash position of R11.3 billion compared to net cash of R17.3 billion at the end of 2019, a decrease
increase in the customer pre-payment added R6.7 billion. In January, the company received the outstanding deferred consideration from Royal Bafokeng Platinum of R1.8 billion. These cash flows were used to fund capital expenditure and capitalised waste stripping, collectively amounting to R3.3 billion; pay taxation and interest of R1.3 billion; and to pay dividends to shareholders of R11.1 billion. In addition, leases resulted in financial liabilities increasing to c.R0.1 billion. Excluding the current value of the customer pre-payment of R16.1 billion, the company is in a net debt position of R4.8 billion (31 December 2019: net cash R7.9 billion). Our net debt to EBITDA ratio was 0.2x, well below the through-the-cycle target of no more than 1.0x. Liquidity headroom, excluding the customer pre-payment is at R16.6 billion, comprising both undrawn committed facilities of R12.1 billion and cash
covenants.
Dividend
The company dividend policy targets a pay-out ratio of 40% of headline
strong balance sheet, the anticipated improvement in refined production in H2 2020, the continuation of relatively strong PGM prices and the ability of the Company to withstand downside price risk and operational challenges, the Board has declared a first-half cash dividend of c. R2.8 billion, or R10.23 per share, to our shareholders. The dividend applies to all shareholders on the register on Friday, 28 August 2020 and is payable on Monday, 31 August 2020.
PGM MARKET REVIEW PGM prices in H1 2020
The first half of 2020 saw very volatile PGM prices as the Covid-19 pandemic hit both the demand and supply sides of the PGM markets. The US dollar platinum price ended the first six months at $814 per
but down from $981 per ounce at the start of 2020 – and having traded in a range from above $1,000 per ounce to below $600 per
ending the half at $1,905 per ounce, 25% higher year on year (H1 2019: $1,524 per ounce], and little changed from the 2019 year- end of $1,920 per ounce. Although during the financial period under review the price at times had been higher, setting a new all-time high
at 30 June at $8,000 per ounce, 139% higher year on year (H1 2019: $3,350 per ounce). It too set a record high, reaching nearly $14,000 per ounce on 10 March. In dollar terms, the average realised basket price was 56% higher year on year at $1,956 per PGM ounce (H1 2019: $1,255 per ounce). The rand, in weakening by 15% against the US currency, supported the rand basket price, which increased by 80% to R32,166 per PGM
Supply and demand summary
The Covid-19 pandemic and unprecedented government responses worldwide, including widespread lockdowns, had a significant impact
geographic regions, there remains a great deal of uncertainty, with limited visibility beyond a few months, leading to what is likely to be a significant impact for some time to come. Mine supply will be sharply lower in 2020 than in 2019 owing to the loss of ounces caused by the Covid-19 lockdown in South Africa from 26 March to 30 April, which saw all non-surface or mechanised mines closed, but also because of the subsequent slow ramp-up and the impact of ongoing enforced social distancing. Global recycling volumes will be less affected, with many participants continuing to
considerably as fewer vehicles are scrapped. PGM demand will be hit heavily by the fall in global car and commercial vehicle sales and production, weaker sales of platinum jewellery, and more variable, but mostly softer, industrial demand.
Platinum
Platinum did not share in the price gains of other PGMs in the first half
largely due to increases in investment but struggling jewellery sales and subdued diesel automotive demand outlook had all kept sentiment weak even before the onset of the Covid-19 pandemic. The platinum price reached a trough in March as the extent of the impact of Covid-19 on demand became apparent. However, the lower platinum price in local currencies resulted in strong retail investor buying, and the price steadied as the Covid-19 pandemic began to have a significant impact on supply. Global platinum supplies are set to fall materially in 2020 on the back
Africa and Zimbabwe, and the subsequent slow ramp-up. Secondary supply is also likely to be lower, though by a smaller amount. Gross demand for platinum will also fall significantly this year. Automotive uses of platinum (c.40% of gross demand) are exposed to weaker car production in Europe, which was badly affected by Covid-19, and in the commercial vehicle sector. Jewellery demand (c.25% of gross demand) has been affected by general weakness in retail sectors and uncertain recovery prospects. Industrial demand (c.25% of gross demand) is holding up better but will also be considerably lower.
Palladium
Palladium reached an all-time nominal and real-price high of $2,795 per ounce on 27 February. Leading up to the peak pricing, the market was extremely tight, as indicated by a rising bid-offer spread (the difference between the price at which metal is bought and sold) and widening backwardation (the difference between future and current prices). Market estimates were also indicating that the palladium deficit in 2020 would exceed the 2019 deficit, as automotive demand for catalytic converters (c.80% of gross demand) would continue to grow. The spread of Covid-19 caused a significant pullback in prices, and points to a much smaller deficit in 2020. The global light-vehicle market will shrink considerably this year, and even though palladium loadings per vehicle will continue to rise, automotive palladium demand is likely to decline significantly. Mine supply will be less affected than for platinum or rhodium, given that c.60% of the metal comes from Russia
30 JUNE 2020 INTERIM RESULTS 12 Anglo American Platinum Limited Interim Results 2020
South Africa by Covid-19 shutdowns so far. We continue to see palladium in a modest deficit this year. Looking further out, market balances will depend on the recovery in vehicle sales globally, but current expectations see palladium returning to a sizeable deficit in 2021.
Rhodium
The rhodium price has continued to strengthen over the past two
(Johnson Matthey base price) to reach a peak of nearly $14,000 per
in real terms than the 2008 peak of $10,000 per ounce. As was the case with the other PGMs, the impact of Covid-19 led to a sharp price pullback, with rhodium closing on 30 June at $8,000 per ounce, though this was still much higher than its close-out a year earlier (H1 2019: $3,350 per ounce). The average price over the first six months
The increase in the rhodium price was driven by strong automotive demand (c.80% of gross demand) and a market deficit, and rhodium has remained well supported since the emergence of Covid-19, despite the major hit to automotive demand owing to the even larger impact the epidemic is having on the supply side. Over the first six months, rhodium investment, through exchange-traded funds (ETFs) increased marginally in comparison with a year ago. We expect the market to remain in deficit in 2020. Looking ahead, rhodium’s important role in reducing nitrogen oxide (NOx) emissions from internal combustion engine vehicles should continue to underpin demand for the metal.
Minor metals
Prices for the minor PGMs have continued to strengthen over the past year, and iridium ended the first half at $1,645 per ounce (H1 2019: $1,480 per ounce), an all-time high in nominal-price terms for the
matching the record level it attained in 2019, then an 11-year high. Demand for these metals should remain robust over the medium term, particularly from the electrical industry, the largest demand sector for both ruthenium and iridium. Covid-19-related economic disruption will take its toll in the short term, though this will be relatively limited owing to both metals diversified and industrial-focused spread of applications.
Automotive
The largest sector for PGM demand is automotive, where palladium and rhodium are used in the catalytic converters of gasoline-engine vehicles, while platinum is the dominant PGM in exhaust after- treatment for diesel vehicles. The Covid-19 pandemic has already had and will continue to have a negative impact on car and commercial vehicle sales and production worldwide in 2020.
Light-duty vehicle demand
Global light-duty vehicle (LDV) sales are forecast by research group LMC Automotive to fall by 21% year on year in 2020, a reduction of 19 million light-duty vehicles. All regions are forecast to be affected significantly, though China, forecast to be 11% lower, is expected to do less badly than the US and Europe, where sales are expected to decrease by 22% and 25%, respectively. Global LDV production is forecast to reduce by a similar 20%, highlighting that vehicle inventory was relatively low going into the crisis. The worst stage of the Covid-19 crisis seems to have passed, with sales and production in China at their lowest levels during the lockdowns imposed in February and March, and in most other countries in April and May. Subsequently, as those lockdowns have been eased, a recovery has begun. By May, China, which is a few months ahead of the curve in relation to the vast majority of countries, saw sales and production back at normal levels; in most other countries, while both sales and production remain substantially lower year on year, they are recovering month on month. PGM demand in automotive is determined not only by production volumes but also technological factors, such as choice of drivetrain and changing metal requirements to meet new emissions legislation. Loadings of palladium and rhodium per gasoline-driven vehicle, which increased significantly in 2019 in China and Europe to meet tougher emission standards, are likely to increase modestly in 2020. The diesel engine’s share of LDV sales in Europe was 30% for January- May (Source: LMC), slightly lower than the 33% figure for the corresponding period last year. Battery Electric Vehicle (BEV) market share for the same period, however, has risen to 4%, from 2%, partially reflected by the longer lead times for ordering and delivery, which has meant volumes have held up better than in the case of traditional internal-combustion engine vehicles. In China, BEVs have seen their market share ease on reduced subsidies, though steady growth is expected to resume in the second half. Globally, at present, we see Covid-19 as having a neutral impact on LDV electrification, with both BEVs and Plug-in Hybrid Electric Vehicles (PHEVs), with PHEV’s requiring PGM catalysts, maintaining the same steady increase in market share as expected before the pandemic.
Heavy-duty vehicle demand
Demand for heavy-duty vehicles (HDV) in 2020 is also forecast to fall sharply in comparison with 2019, with forecasts of a full-year fall in sales of 22%, and in production of 25% (Source: LMC). However, China’s market has seen a strong recovery and is likely to make full- year gains considerably ahead of previous forecasts. Globally, while PGM demand from this sector will fall in 2020, the outlook over the next few years is robust, given that the proportion of new HDVs fitted with PGM-containing catalyst systems continues to rise, especially in China where platinum demand from the HDV sector should be particularly strong over the next few years.
Gross demand
Gross platinum demand from the automotive sector in 2020 is expected to fall more than palladium and rhodium demand, as loadings continue to rise in gasoline-driven vehicles’ catalysts, in which the latter two metals are mainly used. With the platinum price currently less than half that of palladium, there are ongoing questions around substituting platinum for palladium in gasoline-engine or three-way catalytic converters. Already in 2020, there has been an announcement from BASF, a leading catalytic converter manufacturer, of a commercially available technology in
this year, with more substantial amounts in 2021 and 2022. Fuel cell vehicles, which contain platinum catalysts, are being sold in increasing numbers, though volumes remain small.
Industrial
Following several years of healthy industrial demand for platinum, we expect lower demand during 2020 because of Covid-19, although it will be less hard-hit than the catalytic converter or jewellery sectors. Indeed, many industrial applications for PGMs were not affected adversely by Covid-19-related lockdowns and, consequently, PGM demand from this sector remained relatively resilient over the first half
capacity will also delay PGM demand from this sector. Over the medium term, we remain positive on the outlook for industrial demand.
Anglo American Platinum Limited Interim Results 2020 13 Due to the high rhodium price, well above historical levels, there are some signs of price-related thrifting in the relatively small industrial applications for this metal, particularly in the glass sector where a higher platinum mix is preferred.
Jewellery
Global gross demand for platinum from the jewellery industry is set to fall again in 2020. In China, which accounts for about 50% of global gross jewellery demand, sales were already facing tough competition from gold jewellery, and the Covid-19 lockdown came during a key period for jewellery purchases (Chinese New Year and Valentine’s Day). Subsequently, the recovery in the broader retail sector in the country has been slower than for industry, as consumers have stayed away from shopping malls. However, during May, there was a clear improvement in jewellery sales, coupled with jewellery retailers enhancing their online sales capabilities, raising hopes that Chinese demand will increase in the second half of this year. Outside China a stronger year had been forecast, in India where volumes had been growing around 10% per annum. Covid-19 lockdowns have reduced this outlook, and their economic consequences will continue to weigh on consumers. Nevertheless, the underlying trend remains robust and Indian offtake should improve going into the second six months.
Investment
Net investment demand for platinum has been positive in the year to
half (leaving total holdings at 3.4 million ounces), though purchases were volatile and were linked to the volatility in platinum prices during the period. Coin and bar investment demand was robust, with investors taking advantage of the multi-decade-low platinum price in March and purchasing a net 312,000 ounces in the first quarter (Source: WPIC). Of this, 155,000 ounces came from Japanese bar investment, as the Japanese yen platinum price fell to its lowest level since the early 2000s. Net disinvestment of palladium continued during the period, both when palladium was rising in price and during the weaker period for the metal from March onwards. In total, 170,000 ounces were liquidated, leaving total ETF holdings at just over 500,000 ounces. Rhodium ETF holdings ended the period marginally higher, at around 24,000 ounces, with liquidation of 9,000 ounces up to late May then reversed by new inflows of 9,000 ounces in the last six weeks of the first half.
Hydrogen economy
Over the longer term, there is considerable demand potential for PGMs from the ‘hydrogen economy’. Hydrogen has long played an important role in many industrial processes, in particular oil refining and chemical production, but the growth in affordable renewable energy has raised the possibility of using ’green‘ hydrogen as an energy carrier to accelerate the drive towards ’net zero‘ carbon emissions targets for many economies. Platinum is used within many types of fuel cells which convert hydrogen to electrical energy, and it is also used in the reverse process, the production of hydrogen from electricity, when using Polymer Electrolyte Membrane electrolyser (PEM) technology. In 2020, there has been increased momentum in a wide range of hydrogen economy applications. The best-known application for fuel cells is in the transport sector, though the broadest application so far is in smaller sectors such as forklift trucks rather than conventional cars and trucks. Development in the latter continues, however, and several OEMs have announced plans this year, including joint operations and new-model development. Most of these will not come to fruition until the second half of the 2020s, though sales of existing light-duty fuel- cell vehicles (FCVs), mainly from Toyota and Hyundai, are forecast by LMC to double this year to nearly 15,000 vehicles. Platinum loadings
grams/kW or 10–12 grams per car. Hydrogen is being actively considered as a potential fuel source for other transport sectors. The technology is already being used on a small scale in the maritime and railway sectors (such as the Alstom Coradia iLint hydrogen train project in the Netherlands). Trials are also being carried
hydrogen-powered fuel-cell mine haul truck, which we have developed with partners and will trial at Mogalakwena mine in 2021. Hydrogen-based technology is gaining traction in other areas and will be supported by a range of government initiatives around the world. The focus on the need for ‘green hydrogen’ as the fuel source could increase the demand for platinum, as much of the green hydrogen is produced using PEM electrolysers, which contain PGMs. PEM electrolysis is the preferred process by which to produce hydrogen from renewable energy
PEM electrolysis compared with other methods. Many governments are looking at ‘green’ economic stimulus packages in light of Covid-19. We believe this may provide further support for the hydrogen economy and fuel cell technology, across a wide range of
stimulus package will offer €9 billion of support for the hydrogen economy, while the European Commission’s long-awaited hydrogen plan, focusing on green hydrogen was announced on 9 July.
Copper, Nickel, Chrome
The copper price, as with most other commodities, was hit badly by the Covid-19 pandemic, but it has staged a solid recovery. Beginning 2020 at just below $6,200 per tonne (LME 3-month), it fell sharply as the virus emerged first in China, then the rest of world, reaching a low
economic recovery, however, and signs of shortages at Chinese smelters, saw the price quickly rally, with momentum maintained by the realisation that some supply disruption was possible from the Americas, given that Covid-19 is still rampant. Add to this a positive shift in investor sentiment, as well as a drain in inventories, by the end
almost bringing the price back to what it was at the start of the year. LME nickel prices, along with the rest of the base metals complex, were negatively impacted by Covid-19; though nickel held up relatively well in comparison. Nickel prices declined into the low $11,000s/t range in March but recovered to an average of $12,703/t in May, 6% higher year on year and were trading above $13,000/t in June. Nickel consumption was also negatively affected by Covid-19, but the V-shaped recovery in China (over 50% of nickel consumption) was positive for demand and prices. Nickel consumption in China reached a monthly record high in June. Covid-19 also led to lower than expected nickel supply, which tightened the supply-demand balance. Philippines nickel ore output was reduced owing to Covid-19 prevention measures, which in addition to the introduction of the Indonesian nickel
nickel pig iron (NPI) in China. Chrome prices started the year at $135/t but declined to $114/t in March owing to the impact of Covid-19 on stainless steel production in China. But as Chinese demand and stainless-steel production recovered, chrome supply from the main producer in South Africa was adversely affected by Covid-19 lockdowns, restricting supply. This combination pushed the UG2 price up to a high of $170/t in June and a monthly average of $166/t, a year-on-year increase of 14%.
BUILDING THE BUSINESS FOR THE FUTURE
Anglo American Platinum strives for continuous improvement in performance and capitalising on value-enhancing opportunities to position itself as the leading PGM producer. The restructured and simplified, high-quality assets are the building blocks to drive the future
30 JUNE 2020 INTERIM RESULTS 14 Anglo American Platinum Limited Interim Results 2020 philosophy is embedded in all we do, and ensures we seek to strike the balance between producing industry-leading returns for shareholders and creating a sustainable future for communities and other stakeholders, so that we can meet our purpose of ’re-imagining mining to improve people’s lives’. While the Covid-19 pandemic has required significant effort to keep our employees safe, as well as ensure that operations continue, we are focused on progressing the next stage of value delivery for all stakeholders, based on the following key areas:
Operational improvements
We are working to reset operational performance benchmarks across
in recent years. We believe there is substantial additional value to be gained by focusing on achieving stable operations and best-practice benchmarks and to take performance beyond benchmark (also known as P101). Stability in our processes brings safer operations, improved efficiencies, lower cost and a strong base from which to deliver improvements in performance.
Breakthrough technology and innovation
We are studying breakthrough opportunities, which enable a step- change in production or value, through FutureSmart MiningTM our approach to technology, digitalisation and sustainability. Anglo American Platinum aims to be at the forefront of digitalisation and mechanisation of operations, designed to make them safer, more efficient and reduce energy usage, water usage and reduce emissions. Examples include our current trial of bulk-ore sorting at Mogalakwena, which aims to increase grade delivered to the concentrator plant, and
a separate mechanised section of the mine, which will lead to safer and more efficient mechanised production and set up the operations for a mechanised future.
Projects
The company remains committed to investing in fast payback, high- returning projects such as the copper debottlenecking at Rustenburg Base Metals Refinery, the Unki concentrator debottlenecking, and modernisation of Amandelbult, among other projects in execution. These projects are focused on maximising value, not necessarily volume, with our disciplined capital allocation focused on generating strong returns. In addition, we are also studying potential growth and replacement
Mogalakwena expansion
Mogalakwena remains the world’s most significant PGM operation and the only major open-pit PGM operation globally. Given the size of the resource, the project study has identified several options to expand PGM production. The study is reviewing both open-pit and future underground mining options, additional concentrator capacity, and deployment of new technology to improve throughput and recoveries and to maximise long-term value and the impact on downstream processing capacity. Aligned with our purpose we are striving to be an employer of people who are doing safe, productive and meaningful work as well as reshaping our relationships with our local communities to ensure they can also thrive. A decision on the next steps will be taken in the latter half of 2021.
Mototolo/Der Brochen
The acquisition of 100% of Mototolo mine unlocked significant synergies between this mine and Anglo American Platinum’s already owned and adjacent Der Brochen resource. Project studies are underway to assess the most value-accretive options for the replacement and potential growth of this new PGM complex. By combining the Mototolo mine area with the down-dip and adjacent Der Brochen resource, the ability to mine into the contiguous resource, which only requires extending existing infrastructure, has significantly extended the life of mine from the current five years to potentially beyond 30 years. We have two project studies under way. The most advanced study is the replacement of Mototolo into the Der Brochen ground, which is in feasibility study. The study is focused on establishing Der Brochen South Shaft, replacing the Lebowa shaft which is coming to the end of its life. This replacement project will utilise the current concentrator infrastructure, and therefore be a low-cost replacement project. The potential expansion of Mototolo/Der Brochen is also being evaluated and is in pre-feasibility B stage. Breakthrough technology is being assessed to enable an increase in throughput and improve grade to the concentrator, which could result in both replacement and potential growth in production.
Market development
Growing the market for PGMs remains a strategic priority for Anglo American Platinum. Our approach to market development continues to evolve as we find new ways and new partners to grow demand for each of our metals. Today, we have a broad range of programmes underway that support both near- and long-term demand creation.
Jewellery
Jewellery market development is undertaken through the Platinum Guild International (PGI), which is funded by the industry, except for PGI India which is exclusively funded by Anglo American Platinum. In China, the PGI’s Reboot programme has helped to kick-start the recovery of platinum in retail. In India, programmes and marketing campaigns for existing brands, such as Platinum Days of Love and Evara, will continue with the PGI’s strategic partners. After successfully introducing men’s jewellery with the launch of Men of Platinum in 2019, the PGI expects this category to increase its contribution to demand through sales of heavier-weight pieces. In Japan, branded collections targeting mature customers, such as Hello Me, Platinum, continue to receive strong
PGI is also focusing efforts on digital marketing and sales conversion, necessary to accelerate a recovery, but also in capturing growth
focus has been on the growing recognition that platinum has the most secure setting for a diamond. The PGI is leveraging this opportunity through the upcoming launch of a ForevermarkTM x Micaela, a popular celebrity stylist who has curated a collection of diamond engagement rings and wedding bands exclusively in platinum.
Investment
Investment demand creation activities are undertaken by the industry- funded World Platinum Investment Council (WPIC). In the first half of 2020, the WPIC focused on product partnerships in the key markets
America, Europe and Japan, which continued to support the growth in platinum ounces held by investors. The WPIC also increased its frequency of research and contact, supported by Metals Focus, and broadened its engagement with the automotive markets, encouraging the substitution of palladium by platinum.
Industrial and other market-development activities
Beyond the jewellery and investment themes, Anglo American Platinum continues to innovate by finding new ways and opportunities to grow demand for our metals. Our activities include investing in primary research and development; investing in early-stage companies commercialising PGM technologies, including in the hydrogen economy sector; and working towards a favourable policy environment for these technologies. Anglo American Platinum is helping to develop the hydrogen market globally through advocacy helping to shape global policy. In addition, we are directly involved in developing the hydrogen economy and are currently developing the world’s biggest mobile application for fuel cells
Anglo American Platinum Limited Interim Results 2020 15 in the form of a hydrogen-powered, mining haul truck that will be commercially adopted at Mogalakwena. This demonstration will entail the onsite generation of hydrogen from renewables (solar), which is then used to refuel the truck. At scale, this application would create significant demand for green hydrogen, accelerating the hydrogen supply chain and ultimately helping to lower the cost of hydrogen for
the technology is commercial adopted, this will also enable significant decarbonisation of our operations.
AP Ventures
AP Ventures, spun out of Anglo American Platinum in 2018, continued to make excellent progress during the first half of 2020, with more than 170 PGM-related technology opportunities reviewed; several of these have moved to advanced due diligence and two new investments were completed. Moreover, the existing portfolio of PGM-technology companies continued to perform. Hydrogenious Technologies, which provides safe, low-cost, bulk-hydrogen storage and transport solutions, received further investment from Hyundai Motors and is leading large- scale implementation projects for hydrogen storage across Europe, including with its other strategic investors, Covestro (previously Bayer) and Royal Vopak. In the United States, Greyrock is ramping up its clean-diesel production capacity with additional commercial projects and has extended the technology to produce zero-carbon fuels utilising green hydrogen and captured carbon dioxide. Both Hydrogenious Technologies and Greyrock use significant quantities of PGMs in their innovative technologies. AP Ventures also concluded its first sale of a portfolio company, with the transfer of its interest in United Hydrogen Group, a merchant trader of hydrogen in the US, to Plug Power, the world’s largest producer of hydrogen-powered forklift trucks. As well as realising a financial return for Anglo American Platinum, the transaction positions United Hydrogen Group and Plug Power for further growth and ultimately increased demand for PGMs used within Plug Power’s products. This transaction further validates our market-development approach, showing that our investment in market development can achieve both increased PGM demand and direct financial return for Anglo American Platinum. Our global advocacy activities also continue to make an impact in creating conducive policy environments for hydrogen and fuel cell technologies in the major early-adopter markets of China, the European Union, United Kingdom and the US. Several high-impact announcements were made by governments globally during the first six months of 2020. China, for example, is extending subsidies for new-energy vehicles and, very recently, included hydrogen as an energy carrier in draft Chinese energy law for the first time. The EU Commission has announced a €750 billion package to unlock investment in clean technologies, including to kick-start a green hydrogen economy in Europe. Germany alone, for example, has agreed to set aside around $10 billion to grow its electrolysis capacity for renewable hydrogen production to 5 gigawatts (GW) by 2030. Australia has committed another A$300 million to support its National Hydrogen Strategy, while in the US, California has approved a ground- breaking policy to wean its trucking sector off diesel fuel by requiring manufacturers to sell a rising number of zero-emission vehicles, starting in 2024. All these developments point to an increasing momentum behind hydrogen and fuel cells as key technologies in decarbonising the global economy in the years ahead.
Environment, Social and Governance (ESG) Environment
Our approach to sustainability sets out our commitment to demonstrating leadership in environmental stewardship. Mining must play its part to address the environmental challenges of a carbon-constrained world and society’s wider expectations of us as enablers of change, while we continue to meet the ever-growing demand for our products. Anglo American’s FutureSmartTM Mining programme is designed to tackle many of these challenges, both environmental and social. In the transition to a low-carbon economy, PGMs are critical to enable associated technologies. In delivering these products, we are committed to materially reducing our environmental footprint over the next decade. This will lead to fundamental changes in how we mine and process our
creating waterless, carbon-neutral mines that deliver net positive biodiversity and conservation outcomes. Anglo American Platinum had no major environmental incidents (categorised as Levels 4 and 5) in the first half of the year, thereby extending the period of experiencing no major environmental incidents since 2013. The company has an ultimate ambition to reduce all waste to landfill. Since the programme started in 2013, there has been an 84% reduction
10 operations in our portfolio are ready to be certified for achieving zero waste to landfill, with the rest continuing to make progress. The company acknowledges there are some waste streams that do not have recycle or re-use solutions yet but remains committed to pursue all possible opportunities to ensure zero waste will be send to landfill. Our most material air-quality priority remains the reduction of sulphur dioxide (SO2) emissions from our three smelters in South Africa. Construction of an abatement plant is nearing completion at the Polokwane smelter, which is using innovative technology to capture SO2 gas from the furnace to convert into sulphuric acid. This technology will ultimately reduce SO2 emissions by c.96% in order to comply with stringent limits and become global best practice. Once construction and commissioning has been completed, and the project proven effective, a similar plant will be constructed at the Mortimer smelter.
Carbon neutrality by 2040
In responding to the global challenge of climate change, Anglo American Platinum, as part of the wider Anglo American Group, has set a target of achieving carbon neutrality across our operations (Scope 1 and Scope 2) by 2040. Anglo American Platinum continues to focus on reducing its energy consumption and improving energy efficiency through adopting Anglo American’s FutureSmart MiningTM. Examples we are developing and deploying include step-change technologies such as bulk ore sorting and coarse particle recovery/rejection, which are aimed at significantly reducing energy use and Scope 1 emissions. We are also developing new applications for our metals and minerals that enable lower emissions, both at our operations and globally (e.g. green- hydrogen-powered fuel cell transport using PGMs, including for mine haul trucks). Finally, we are looking at changing our energy mix to include renewable-energy and low-carbon energy sources. We have a two-tracked approach to addressing our Scope 2
the application of our FutureSmart Mining™ technologies. For example, we are deploying energy-recovery applications in ore processing – the most energy-intensive part of our operations. Secondly, we are increasing the proportion of renewable energy in our mix. As a consequence of Covid-19, and lower levels of production, our energy usage for the first six months was 20% lower than for the same period in 2019. In addition, our energy intensity was c.3.75% less. The company has set targets to improve energy efficiency and reduce absolute greenhouse gas (GHG) emissions by 30% by 2030 (against a 2016 baseline). As part of this target, we have progressed the proposal for a large-scale solar-photovoltaic facility at the Mogalakwena
in parallel, commenced with the environmental scoping study and will shortly begin work on the lease agreement for the intended site.
30 JUNE 2020 INTERIM RESULTS 16 Anglo American Platinum Limited Interim Results 2020 Currently, we estimate commercial operation by the end of 2022, but acknowledge that the impact of Covid-19 could result in delays.
Social
Despite the headwinds of Covid-19, the company remains dedicated to delivering on its social labour plans and Community social investment
social labour plans, as well as the payment of a dividend to the Alchemy community trust, extension of the community water projects and contributions to the Anglo American Zimele and Chairman’s Funds. In addition, the company spent R55 million on various community initiatives to help communities during the Covid-19 pandemic. Our social licence to operate remains a key focus for the long-term sustainability of our business. Our social strategy plays a significant role in supporting our business strategy and addressing key social issues at
values driven and socially responsible way, underpinned by the need to build leading community and stakeholder relationships and make a lasting contribution. The social strategy therefore helps the business to fulfil its societal obligations by delivering shared value – creating social value for stakeholders while generating business value. This strategy was adapted to the changing needs of the business and to better meet the needs of our stakeholders. It clearly defines our
enhancing our social licence to operate through engaged and empowered stakeholders. The future of our business is linked to the future of communities in our
in our communities by creating social and economic benefits that meet explicit needs during and beyond the life of a mine. We will work towards ensuring community upliftment through investing in several socio-economic development programs and develop innovative approaches to inclusive engagement. We will need to continue progress
partners, and work on solving the challenges that continue to exist in our local communities. It is essential that we rebuild trust and ensure that benefit from our operations accrues to the communities, so that we will be a valuable partner in the eyes of our stakeholders.
Governance
Anglo American Platinum is committed to ethical leadership and behaviour, as well as acting with integrity. Our governance strategy is based around five pillars:
committee has approved a Board Succession Blueprint that provides a framework for strategic, long-term and effective orderly succession of directors that would result in the appropriate balance
board to discharge its governance role and responsibilities in support of the company’s strategic objectives. The recent board changes are an output of this process.
committee, has invested significant time in the company’s culture transformation journey to embed a culture that values significance
as an employer of choice in fostering high-performance teams and individuals as well as monitoring the business infringements that include fraud, corruption, and dishonesty-related incidents.
engagement with management that allows the board to set strategic direction and approve planning, policy and budgets. This includes setting appropriate remuneration policies for performance.
its charter, which sets out the role of the board, chairman and CEO to ensure a balance of power and authority and preclude any one director from exercising unfettered powers of decision-making. The board is supported by various committees governed by their respective approved terms of reference. The board is accountable to its shareholders and stakeholders to lead, control and monitor activities of the company. An integral part of this accountability constitutes delegating contractual and transactional authority to key Committees/Management to execute day to day transactions of the
Delegation of Authority Framework approved by the board.
governance and performance of the company – financially and socially as a corporate citizen. The board ensures there is accountability for company performance through, among others, reporting and disclosure. Respect for human rights is a non-negotiable value enshrined in Anglo American Platinum’s core values, its human rights policy and social
business and human rights. They guide behaviour at our operations in South Africa and Zimbabwe in a way that respects the human rights of
ESG recognition
Anglo American Platinum has continued to demonstrate strong Environmental, Social and Governance (ESG) performance in 2020,
strong management of ESG issues encountered by the business. The key ESG achievements for H1 2020 include:
5 sub-sector peers on the FTSE Russell Index. The company received the highest overall ESG rating of 4.8, the highest environmental score (4.7), the highest social score (4.7), and highest governance score (5.0) among the top 5 sub-sector peers within the Platinum and Precious metals sector.
improvement of 6.1 points.
Index and the FTSE/JSE Responsible Investment Top 30 Index.
BOARD AND EXECUTIVE COMMITTEE CHANGES
Richard Dunne retired from the Board and Audit and Risk Committee at the annual general meeting on 25 June 2020. John Vice, already a member of the Board, assumed the role of Chairman of the Audit and Risk Committee on 25 June 2020. Natascha Viljoen was appointed as the Chief Executive Officer and Executive Director on 16 April 2020. Riaan Blignaut was appointed as the Executive Head of Safety, Health and Asset Reliability on 1 May 2020. Yvonne Mfolo was appointed as the Executive Head of Corporate Affairs on 1 May 2020. Dean Pelser stepped down as Executive Head of Mining on 15 May 2020. Seara Mkhabela resigned as Executive Head of Corporate Affairs on 31 March 2020 and transferred to a position in the Anglo American South Africa corporate office. On recommendation from the Nominations Committee, the Board at its meeting held on 23 July 2020 approved the appointment of Thabi Leoka and Roger Dixon as independent non-executive directors with effect from 27 July 2020.
Anglo American Platinum Limited Interim Results 2020 17
OUTLOOK Market outlook
The short-term outlook for PGMs is dominated by the prospects for the Covid-19 pandemic and, as such, is highly uncertain; longer term, however, we see continued robust demand. Our current assumptions are based on the virus outbreak being controlled but not defeated, meaning an ongoing impact on supply and demand for the foreseeable
supply outpacing the fall in demand, and strong investment demand. In 2021, platinum should return to surplus as supply recovers. The palladium deficit will likely reduce in 2020 as demand contracts but supply remains more resilient but should increase again in 2021 assuming recovery in vehicle production. Rhodium is likely to be in a larger deficit in 2020, based on lower supply, but will see a smaller deficit in 2021 as supply recovers. In the automotive market, where LMC forecasts light-vehicle sales to fall 21% this year owing to the Covid-19 pandemic, the market is now recovering, though how completely sales do so, and how sustainably, will depend on the success in restricting and living with the Covid-19 virus, as well as economic issues such as the state of consumer incomes and confidence. There is also a debate about whether Covid-19, if it prevails for a long time, will mean more profound changes in car-ownership patterns, with compelling arguments either way as to whether this means higher or lower vehicle demand. LMC forecasts light-vehicle sales in 2021 to rise year on year by 16%, but this means they would still be 10% lower than in 2019. The extent of the recovery in production and sales of cars will be the main determinant of automotive PGM demand, but other drivers are emissions standards and technology. Platinum demand will be helped by the need to meet tighter emission standards on heavy-duty vehicles in China and India, while the impact of the ongoing decline in the diesel engine’s share of the European light-duty vehicle market appears to be
palladium in three-way catalytic converters in gasoline-driven engines. Palladium and rhodium have benefited from higher loadings on gasoline-engine car catalysts in recent years to meet tougher emission standards; from next year, there is little imminent new legislation, though Euro 7 is now under discussion. The electrification of vehicles is expected to continue its steady advance, although their overall market share will remain small. Battery-electric vehicles do not use platinum catalysts, but plug-in hybrid electric vehicles do. Fuel cell vehicles also contain a platinum catalyst, which currently have a tiny market share but one that is growing. Industrial demand, which has been more robust through the pandemic, should remain well supported. The weaker global economy will take its toll, with the potential for capacity expansion to be delayed. But an
increased momentum globally behind the ‘hydrogen economy’ are important positives. In respect of palladium and rhodium, higher prices could incentivise thrifting in industrial applications over the medium term. Jewellery demand is likely to recover in the second six months of 2020 and in to 2021 as economies improve, with encouraging signs in China in recent months and some possibility of pent-up demand in the bridal
jewellery demand decline in China over the past few years remain. Elsewhere, we expect the Indian market will return to strong growth. Investment demand for platinum should be strong in 2020, supported by solid buying in the first half and, while investment flows may moderate in the second six months and in 2021, ongoing market- development efforts indicate that there is further upside for investment
investor selling, encouraged by high prices. Primary supply of PGMs will fall significantly this year, especially in platinum and rhodium where a greater proportion of supply comes from South Africa. We expect a recovery in 2021, though ongoing social-distancing measures and the possibility of further Covid-19- related shutdowns means output is unlikely to return to its previous level, particularly from underground operations. Secondary supply has also been disrupted and, while refiners have been able to process stockpiled material, ultimately these volumes will reflect the number of cars being scrapped, and this is forecast to slow in line with new car
peaking, while palladium and rhodium will continue growing in line with historical demand patterns.
Operational outlook
There are several variables that could impact our ability to meet year- end guidance including:
employees safe from the virus, and the potential impact this may have on ensuring safe production;
government measures, leading to shutdowns and/or extensions of existing Covid-19-containment policy, any of which could impact production;
to implement safety and hygiene measures, leading to employees needing to self-isolate;
working practices;
have been completed. Considering this, PGM production guidance (metal in concentrate) for 2020 is expected to be in the range of 3.1–3.6 million ounces. Of this total, the platinum outlook is for 1.45–1.65 million ounces, with a palladium forecast of 1.0–1.15 million ounces. Refined production guidance is expected to be 3.1–3.6 million ounces. The guidance for refined platinum production is 1.45–1.65 million
The build-up in work-in-progress inventory of c.500,000 3E ounces should be released by the end of 2021. Sales volumes are expected to be in line with refined production.
Financial outlook
Unit cost guidance for 2020 has been revised to increase to between R11,800 to R12,200 per PGM ounce (previously R10,600 to R11,000 per PGM ounce), as a result of lower production to date and considering the potential operational challenges as the pandemic progresses over the coming months. Total capital expenditure guidance for 2020, excluding capitalised waste stripping is expected to be between R5.7 and R6.5 billion. Capitalised waste-stripping guidance remains at R2.4–R2.6 billion. The financial information on which the guidance is based has not been reviewed or reported on by the Company’s auditors. Johannesburg, South Africa 23 July 2020
30 JUNE 2020 INTERIM RESULTS 18 Anglo American Platinum Limited Interim Results 2020 Reviewed Audited six months ended Year ended 30 June 30 June 31 December 2020 2019 % 2019 Notes Rm Rm change Rm Gross sales revenue 5 54,778 42,892 28 99,571 Commissions paid (7) (5) (20) Net sales revenue 54,771 42,887 28 99,551 Cost of sales 6 (41,781) (32,126) 30 (72,737) Gross profit on metal sales 6 12,990 10,761 21 26,814 Other net expenditure 9 (1,644) (187) (388) Market development and promotional expenditure (400) (354) (788) Loss on impairment and scrapping of property, plant and equipment (277) (109) (173) Operating profit 10,669 10,111 6 25,465 Interest received 10 278 191 349 Income/(losses) from associates and joint ventures (net of taxation) 66 (32) (108) Fair value remeasurements of other financial assets and liabilities 10 (1,378) 376 248 Interest expensed 10 (241) (531) (572) Impairment of non-current financial assets (39) (36) (77) Other (8) — — Impairment of Primus Power — (22) — Profit before taxation 9,347 10,057 (7) 25,305 Taxation (2,650) (2,696) (2) (6,736) Profit for the year 6,697 7,361 (9) 18,569 Total other comprehensive income/(loss), post-tax 2,126 (89) 33 Items that will be subsequently reclassified to profit or loss 1,282 (146) (192) Deferred foreign exchange translation gains/(losses) 1,282 (146) (192) Items that will not be subsequently reclassified to profit or loss 844 57 225 Net gains on equity investments at fair value through other comprehensive income (FVTOCI) 959 76 279 Tax effects (115) (19) (54) Total comprehensive income for the year 8,823 7,272 21 18,603 Profit attributed to: Owners of the Company 6,686 7,313 18,497 Non-controlling interests 11 48 72 6,697 7,361 18,569 Total comprehensive income attributed to: Owners of the Company 8,812 7,224 18,531 Non-controlling interests 11 48 72 8,823 7,272 21 18,603 EARNINGS PER SHARE Earnings per ordinary share (cents) – Basic 2,546 2,788 (9) 7,046 – Diluted 2,512 2,779 (10) 7,021
for the six months ended 30 June 2020
Anglo American Platinum Limited Interim Results 2020 19 Reviewed Audited six months ended Year ended 30 June 30 June 31 December 2020 2019 2019 Notes Rm Rm Rm ASSETS Non-current assets 60,188 54,951 57,177 Property, plant and equipment 45,520 42,445 43,504 Capital work-in-progress 9,001 6,744 8,501 Other financial assets 14 2,842 3,434 2,558 Inventories 15 1,006 650 1,006 Investments held by environmental trusts 776 1,252 798 Investment in associates and joint ventures 13 646 426 413 Goodwill 397 — 397 Current assets 62,291 39,431 46,843 Inventories 15 31,021 22,607 22,446 Cash and cash equivalents 16 23,333 12,285 18,546 Other financial assets 14 3,716 1,041 2,532 Other assets 2,783 888 1,633 Trade and other accounts receivable 1,438 2,253 1,686 Taxation — 357 — Total assets 122,479 94,382 104,020 EQUITY AND LIABILITIES Share capital and reserves Share capital 27 27 27 Share premium 22,639 22,767 22,691 Retained earnings 30,570 26,590 35,039 Foreign currency translation reserve 3,734 2,498 2,452 Remeasurements of equity investments irrevocably designated at FVTOCI 1,285 273 441 Non-controlling interests 134 199 192 Shareholders’ equity 58,389 52,354 60,842 Non-current liabilities 22,753 17,986 14,646 Deferred taxation 11,707 9,673 11,120 Interest-bearing borrowings 17 7,039 5,158 281 Environmental obligations 2,028 1,927 1,898 Other financial liabilities 19 1,395 670 924 Lease liabilities 18 556 543 404 Employee benefits 19 15 19 Share-based payment provision 9 — — Current liabilities 41,337 24,042 28,532 Other liabilities 20 20,821 9,540 11,306 Trade and other payables 13,803 13,336 16,246 Interest-bearing borrowings 17 3,961 89 42 Other financial liabilities 19 1,394 917 609 Taxation 1,226 — 96 Lease liabilities 18 99 136 164 Share-based payment provision 33 24 69 Total equity and liabilities 122,479 94,382 104,020
as at 30 June 2020
30 JUNE 2020 INTERIM RESULTS 20 Anglo American Platinum Limited Interim Results 2020 Reviewed Audited six months ended Year ended 30 June 30 June 31 December 2020 2019 2019 Notes Rm Rm Rm Cash flows from operating activities Cash receipts from customers 55,318 42,161 98,715 Cash paid to suppliers and employees (46,962) (31,982) (66,499) Cash generated from operations 8,356 10,179 32,216 Interest paid (net of interest capitalised) (162) (250) (429) Taxation paid (1,342) (1,184) (3,349) Net cash from operating activities 6,852 8,745 28,438 Cash flows used in investing activities Purchase of property, plant and equipment (includes interest capitalised) (3,415) (3,231) (8,600) Receipt of deferred consideration 2,667 348 348 Interest received 275 148 342 Other proceeds 56 — — Proceeds from sale of plant and equipment 8 — 38 Growth in environmental trusts 3 (28) 7 Investment in joint ventures (AP Ventures) (60) (43) (59) Advances made to Plateau Resources Proprietary Limited (39) (43) (93) Shareholder funding capitalised to investment in associates (38) (34) (68) Purchase of AA plc shares for the Bonus Share Plan (BSP) (2) — (1) Other advances — 9 (4) Purchases of financial assets investments — (4) (24) Insurance proceeds for damage to assets — 8 — Net cash used in investing activities (545) (2,870) (8,114) Cash flows used in financing activities Proceeds from/(repayment of) interest-bearing borrowings 10,677 (900) (5,793) Dividends paid (11,059) (1,996) (4,921) Repayment of deferred consideration (522) — (184) Purchase of treasury shares for the Bonus Share Plan (BSP) (254) (129) (232) Cash distributions to non-controlling interests (69) (80) (111) Repayment of lease liabilities (59) (29) (67) Net cash used in financing activities (1,286) (3,134) (11,308) Net increase in cash and cash equivalents 5,021 2,741 9,015 Cash and cash equivalents at beginning of year 16 18,546 9,541 9,541 Foreign exchange differences on Unki cash and cash equivalents (227) 3 (10) Decrease in cash and cash equivalents due to RA Gilbert disposal (7) — — Cash and cash equivalents at end of year 16 23,333 12,285 18,546
for the six months ended 30 June 2020
Anglo American Platinum Limited Interim Results 2020 21 Remeasure- ments Foreign
currency irrevocably translation designated Non- Share Share reserve at FVTOCI Retained controlling capital premium (FCTR) investments earnings interests Total Rm Rm Rm Rm Rm Rm Rm Balance at 1 January 2019 (audited) 27 22,746 2,644 216 21,428 231 47,292 Total comprehensive (loss)/income for the year (146) 76 7,313 48 7,291 Deferred taxation charged directly to equity (19) 8 (11) Cash distributions to minorities (80) (80) Shares acquired in terms of the BSP – treated as treasury shares (—)* (129) (129) Shares vested in terms of the BSP — * 150 (150) — Equity-settled share-based compensation 84 84 Shares purchased for employees — — Shares forfeited to cover tax expense on vesting (11) (11) Transfer of reserve upon disposal of investments — Dividends paid (1,996) (1,996) Balance at 30 June 2019 (reviewed) 27 22,767 2,498 273 26,676 199 52,440 Profit for the year 11,184 24 11,208 Other comprehensive income for the year (46) 203 157 Total comprehensive (loss)/income for the year (46) 203 11,184 24 11,365 Deferred taxation charged directly to equity (35) 25 (10) Dividends paid (2,925) (2,925) Retirement benefit (2) (2) Cash distributions to minorities (31) (31) Shares acquired in terms of the BSP – treated as treasury shares (—)* (103) (103) Shares vested in terms of the BSP — * 27 (27) — Equity-settled share-based compensation 104 104 Shares forfeited to cover tax expense on vesting 4 4 Balance at 31 December 2019 (audited) 27 22,691 2,452 441 35,039 192 60,842 Profit for the year 6,686 11 6,697 Other comprehensive income 1,282 959 2,241 Total comprehensive income for the year 1,282 959 6,686 11 8,938 Deferred taxation charged directly to equity (115) (2) (117) Dividends paid1 (11,059) (11,059) Retirement benefit — Cash distributions to minorities (69) (69) Shares acquired in terms of the BSP – treated as treasury shares (—)* (254) (254) Shares vested in terms of the BSP — * 202 (202) — Equity-settled share-based compensation 116 116 Shares forfeited to cover tax expense on vesting (8) (8) Balance at 30 June 2020 (reviewed) 27 22,639 3,734 1,285 30,570 134 58,389
* Less than R500,000.
1 Dividends paid
Per share Rm Final 2019 R41.60 11,059
for the six months ended 30 June 2020
30 JUNE 2020 INTERIM RESULTS 22 Anglo American Platinum Limited Interim Results 2020
for the six months ended 30 June 2020
Interim Financial Reporting, the SAICA Financial Reporting Guides as issued by the Accounting Practices Committee and Financial Pronouncements as issued by Financial Reporting Standards Council and the requirements of the Companies Act of South Africa. The preparation of the Anglo American Platinum Group’s (Group) reviewed consolidated interim results for the six months ended 30 June 2020 were supervised by the Finance Director, Mr CW Miller CA(SA). Going concern The financial position of the Group, its cash flows, liquidity position and borrowing facilities for the six months ended 30 June 2020 are set
position (defined as cash and undrawn committed facilities) of R16.6 billion at 30 June 2020 remains in a strong position. Details of borrowings and facilities are set out in note 17. The directors have considered the Group’s cash flow forecasts for the period to the end of 31 December 2021 under base and downside scenarios, with consideration given to the uncertainty of the impact of the Covid-19 pandemic on both the wider macroeconomic environment and the Group’s operations. In all of the scenarios modelled, the Group maintains sufficient liquidity and headroom throughout the period of assessment without the use of mitigating actions. The Board is satisfied that the Group’s forecasts and projections, taking into account reasonably possible changes in trading performance show that the Group will be able to operate within the level of its current facilities for the foreseeable future. For this reason the Group continues to adopt the going concern basis in preparing its condensed consolidated financial statements. Changes in the current reporting period In the six months ended 30 June 2020, the mining, treatment and refining operations have not been fully operational and have not run at normal production levels throughout the period. This was as a result of the shutdown of the Anglo Converter Plant (ACP) due to an explosion within Phase A of the converter, a subsequent temporary shut down of Phase B and the nationwide lockdown that resulted in all assets being placed on care and maintenance. Under these circumstances not all operations have ramped up to full production. The Group has adjusted the inventory valuation to ensure that the allocation of fixed production overheads to the costs of conversion are based on the normal capacity
impairment loss of R264 million was recognised on ACP .
2. ACCOUNTING POLICIES
The accounting policies applied in the preparation of these condensed consolidated interim financial statements are in terms of International Financial Reporting Standards (IFRS) and are consistent with those applied in the financial statements for the year ended 31 December 2019, except as set out in note 3 below.
3. ACCOUNTING POLICIES
Impact of new standards issued and amendments to existing standards not yet effective At the reporting date, the following new accounting standards and amendments to existing standards were in issue but not yet effective: Effective for annual periods New standards and amendments commencing on or after
for Financial Reporting without changing the accounting requirements for business combinations. 1 January 2022
Narrow-scope amendments to IAS 1 to clarify how to classify debt and other liabilities as current or non-current. 1 January 2022
entity from deducting from the cost of an item of property, plant and equipment any proceeds from selling items produced while bringing that asset to the location and condition necessary for it to be capable of operating in the manner intended by management. Instead, an entity recognises the proceeds from selling such items, and the cost of producing those items, in profit or loss. 1 January 2022
a Contract: The amendments specify which costs should be included in an entity’s assessment whether a contract will be loss-making. 1 January 2022
and provides a more uniform measurement and presentation approach for all insurance contracts. These requirements are designed to achieve the goal of a consistent, principle-based accounting for insurance contracts. IFRS 17 supersedes IFRS 4 Insurance Contracts as of 1 January 2021. 1 January 2023
Associate or Joint Venture – deal with situations where there is a sale or contribution of assets between an investor and its associates or joint ventures. To be determined The above standards and amendments, are not expected to have a material impact for the Group.
Anglo American Platinum Limited Interim Results 2020 23 4. SEGMENTAL INFORMATION Net sales revenue EBITDA1 Reviewed Audited Reviewed Audited six months ended Year ended six months ended Year ended 30 June 30 June 31 December 30 June 30 June 31 December 2020 2019 2019 2020 2019 2019 Rm Rm Rm Rm Rm Rm Segment revenue and results Operations Mogalakwena Mine 11,385 11,067 25,845 6,443 6,280 14,375 Amandelbult Mine 7,923 6,890 17,424 2,281 1,785 5,132 Mototolo Mine 2,173 1,830 4,506 823 722 1,956 Unki Platinum Mine 1,977 1,810 4,403 562 488 1,520 Modikwa Platinum Mine2 1,402 1,255 2,988 695 403 1,080 Kroondal Platinum Mine2 2,957 2,368 5,824 1,471 967 2,499 Twickenham Project — — — (89) (199) — Other mined — — — 42 (18) (462) Total – mined 27,817 25,220 60,989 12,228 10,428 26,099 Tolling and purchase of concentrate 12,088 13,973 30,708 2,121 2,256 4,392 Trading3 14,866 3,694 7,854 486 43 247 Foreign currency losses — — — (1,063) — — Market development and promotional expenditure — — — (400) (355) (788) Covid-19 costs — — — (251) — — Restructuring — — — (58) (1) — 54,771 42,887 99,551 13,063 12,371 29,950 Depreciation (2,099) (2,153) (4,441) Foreign currency losses 1,063 — — Marketing development and promotional expenditure 400 354 788 Other expenses 320 156 409 Covid-19 costs 251 — — Restructuring 58 1 — (Income)/loss from associates and joint ventures (66) 32 108 Gross profit on metal sales 12,990 10,761 26,814
1 Earnings before interest, tax, depreciation and amortisation adjusted to exclude scrapping of property, plant and equipment. 2 The Group’s share (excluding purchase of concentrate). 3 Includes purchases of third-party refined metal.
Information reported to the Executive Committee of the Group for purposes of resource allocation and assessment of segment performance is done on a mine-by-mine basis. Although revenue and costs are allocated to mines on a rational basis for internal reporting and segment reporting, the mines do not independently generate revenue. The marketing and sales of precious metals does not differentiate between the source of the refined metal owing to the homogenous and fungible nature of the product which is refined to predetermined industry certified
The group’s mining, smelting and refining operations are all located in South Africa with the exception of Unki Platinum Mine, which is located in Zimbabwe.
30 JUNE 2020 INTERIM RESULTS 24 Anglo American Platinum Limited Interim Results 2020
for the six months ended 30 June 2020 Reviewed Audited six months ended Year ended 30 June 30 June 31 December 2020 2019 2019 Rm Rm Rm 5. GROSS SALES REVENUE Sales revenue emanated from the following principal regions: Precious metals 51,442 39,310 91,176 Asia 30,530 15,404 36,862 Europe 18,531 20,825 48,650 North America 2,365 2,103 4,448 South Africa 16 978 1,216 Base metals 1,814 2,397 5,719 South Africa 83 131 228 Rest of the world 1,731 2,266 5,491 Other 1,130 683 1,563 South Africa 445 205 350 Rest of the world 685 478 1,213 54,386 42,390 98,458 Gross sales revenue by metal Platinum 8,209 12,183 28,200 Palladium 23,728 18,138 39,258 Rhodium 15,643 6,301 17,668 Nickel 1,320 1,745 4,427 Other 5,486 4,023 8,905 54,386 42,390 98,458 Revenue from services Toll refining 392 502 1,113 Gross revenue 54,778 42,892 99,571 ■ Platinum ■ Palladium ■ Rhodium ■ Nickel ■ Other 15% 44% 29% 2% 10% 29% 43% 15% 4% 9% Gross sales revenue by metal – June 2020 Gross sales revenue by metal – June 2019
Anglo American Platinum Limited Interim Results 2020 25 Reviewed Audited six months ended Year ended 30 June 30 June 31 December 2020 2019 2019 Rm Rm Rm 6. GROSS PROFIT ON METAL SALES Net sales revenue 54,771 42,887 99,551 Cost of sales (41,781) (32,126) (72,737) Cash operating costs (15,104) (15,866) (33,612) On-mine (11,302) (11,969) (25,624) Smelting (2,005) (1,973) (4,159) Treatment and refining (1,797) (1,924) (3,829) Purchase of metals and leasing activities1 (30,690) (12,828) (30,384) Depreciation (2,099) (2,153) (4,441) On-mine (1,414) (1,513) (3,051) Smelting (352) (298) (685) Treatment and refining (333) (342) (705) Increase in metal inventories 8,367 761 910 Increase/(decrease) in ore stockpiles 48 (100) (137) Other costs (note 8) (2,303) (1,940) (5,073) Gross profit on metal sales 12,990 10,761 26,814 Gross profit margin (%) 24 25 27
1 Consists of purchased metals in concentrate, secondary metals and other metals.
7. DEPRECIATION OF PROPERTY, PLANT AND EQUIPMENT
Depreciation of plant and equipment comprises of the following categories: Operating assets 2,099 2,153 4,441 Mining 1,414 1,513 3,051 Smelting 352 298 685 Treatment and refining 333 342 705 Depreciation included in other costs 38 38 13 2,137 2,191 4,454
30 JUNE 2020 INTERIM RESULTS 26 Anglo American Platinum Limited Interim Results 2020
for the six months ended 30 June 2020 Reviewed Audited six months ended Year ended 30 June 30 June 31 December 2020 2019 2019 Rm Rm Rm 8. OTHER COSTS Other costs comprise the following principal categories: Corporate related costs Corporate costs 315 251 564 Corporate costs – Anglo American1 76 62 133 Share-based payments 63 54 116 Research 21 7 109 Community social investment 8 43 73 Exploration 6 17 26 489 434 1,021 Operational related costs Transport of metals 309 319 836 Technical and sustainability – Anglo American1 305 278 506 Community social investment 108 89 175 Share-based payments 68 50 141 Studies 60 35 121 Research – Anglo American1 50 49 83 Exploration 7 22 39 Other 3 55 17 910 897 1,918 Royalties and carbon tax Royalties and carbon tax 904 609 2,134 Total other costs 2,303 1,940 5,073
1 Services provided by fellow subsidiaries.
9. OTHER NET EXPENDITURE
Other net expenditure comprises the following principal categories: Realised and unrealised foreign exchange loss1 (1,315) (164) (156) Project maintenance costs2 (102) (60) (153) Restructuring and other related costs (58) (1) (42) Royalties received 78 42 87 Profit/(loss) on disposal of plant, equipment and conversion rights 6 — (2) Insurance proceeds 3 8 22 Other – net (256) (12) (144) (1,644) (187) (388)
1 As described in note 20, the Group enters into certain complex transactions to deliver metal in future for which the resultant contract asset or liability requires judgement in terms of its
treatment as monetary or non-monetary. Where the Group enters into a contract to deliver a variable number of metals in which the fair value to be delivered equals a fixed or determinable number of units of currency, such items are treated as monetary items and are exposed to movements in exchange rates.
2 Project maintenance costs comprise costs incurred to maintain land held for future projects and costs to keep projects on care and maintenance. It also includes the costs of the
Anglo American Platinum Limited Interim Results 2020 27 Reviewed Audited six months ended Year ended 30 June 30 June 31 December 2020 2019 2019 Rm Rm Rm 10. INTEREST EXPENSED AND RECEIVED Interest expensed Interest paid on financial liabilities (125) (505) (304) Interest paid on financial liabilities1 (214) (644) (520) Less: Capitalised 89 139 216 Time value of money adjustment to environmental obligations (79) (26) (194) Decommissioning costs (27) (35) (102) Restoration (52) 9 (92) Interest paid on lease liabilities (37) — (74) (241) (531) (572) Interest received Interest received on financial assets 278 191 349 Interest received 275 188 342 Growth in environmental trust investments 3 3 7 Remeasurements of financial assets and financial liabilities measured at FVPL (Losses)/gains on remeasurements of other financial assets and liabilities (1,378) 376 248
1 Includes interest paid to Anglo American SA Finance Limited of R11 million at 30 June 2020
(30 June 2019: R299 million; 31 December 2019: R375 million)
% % %
11. TAXATION
A reconciliation of the standard rate of South African normal taxation compared with that charged in the statement of comprehensive income is set out in the following table: South African normal normal tax rate 28.0 28.0 28.0 Deferred consideration fair value remeasurements 1.6 (0.4) (0.6) Disallowable items that are individually immaterial 0.3 (0.4) 0.3 Impairment of investments in associates 0.1 (0.2) (0.1) Impairment of non-current financial assets 0.1 0.1 0.1 Difference in tax rates of subsidiaries (1.5) (0.1) (1.0) Effect of after-tax share of (gains)/losses from associates (0.2) 0.1 0.1 Prior year overprovision — (0.1) (0.2) Disallowable provisions — — (0.2) Other — (0.2) 0.2 Effective taxation rate 28.4 26.8 26.6
30 JUNE 2020 INTERIM RESULTS 28 Anglo American Platinum Limited Interim Results 2020
for the six months ended 30 June 2020 Reviewed Audited six months ended Year ended 30 June 30 June 31 December 2020 2019 2019 Rm Rm Rm 12. RECONCILIATION BETWEEN PROFIT AND HEADLINE EARNINGS Profit attributable to shareholders 6,686 7,313 18,497 Adjustments Loss on impairment and scrapping of property, plant and equipment1 277 109 173 Tax effect thereon (78) (30) (48) Impairment of investments in associates 14 — — Tax effect thereon — — — Loss on disposal of investment in subsidiary 7 — — Tax effect thereon (3) — — Profit on disposal of property, plant and equipment (4) (3) (3) Tax effect thereon 1 1 — Insurance proceeds on loss of assets (3) (8) (22) Tax effect thereon 1 2 6 Headline earnings 6,898 7,384 18,603 Shares Number of ordinary shares in issue (millions) 269.7 269.7 269.7 Weighted average number of ordinary shares in issue (millions) 262.6 262.3 262.5 Weighted average number of diluted ordinary shares in issue (millions) 266.1 263.1 263.5 Attributable headline earnings per ordinary share (cents) Headline 2,627 2,815 7,087 Diluted 2,592 2,806 7,061
1 Includes an amount of R264 million relating to impairments at ACP
.
13. INVESTMENT IN ASSOCIATES AND JOINT VENTURES
Unlisted AP Ventures 588 367 355 Peglerae Hospital Propriety Limited 58 59 57 646 426 413
Anglo American Platinum Limited Interim Results 2020 29 Reviewed Audited six months ended Year ended 30 June 30 June 31 December 2020 2019 2019 Rm Rm Rm 14. OTHER FINANCIAL ASSETS Non-current financial assets Loans carried at amortised cost Loan to ARM Mining Consortium Limited 46 44 68 Loans to Plateau Resources Proprietary Limited (Plateau) — 231 — Other 100 100 100 146 375 168 Equity investments irrevocably designated at FVTOCI Investment in Ballard Power Systems lnc. 1,273 270 480 Investment in Rand Mutual Holdings 117 — — Investment in Wesizwe Platinum Limited (Wesizwe) 81 83 108 Investment in SA SME Fund 40 — 40 Investment in Anglo American plc shares 10 17 17 1,521 370 644 Other financial assets mandatorily measured at FVPL Deferred consideration on sale of Rustenburg Mine 946 1,429 1,566 Deferred consideration on sale of Pandora Joint Operation 229 164 181 Deferred consideration on sale of BRPM — 1,096 — 1,175 2,689 1,746 Total other financial assets – non-current 2,842 3,434 2,558 Current financial assets Other financial assets mandatorily measured at FVPL Deferred consideration on sale of Rustenburg Mine 777 482 673 Fair value of derivatives 2,939 11 19 Deferred consideration on sale of BRPM — 548 1,840 Total other financial assets – current 3,716 1,041 2,532 15. INVENTORIES Refined metals 4,266 3,367 4,466 At cost 3,800 2,726 3,778 At net realisable values 442 641 688 At fair value 24 — — Work-in-process 22,877 15,260 14,310 At cost 21,792 12,972 12,685 At net realisable values 1,085 2,288 1,625 Total metal inventories 27,143 18,627 18,776 Ore stockpiles 2,167 2,156 2,119 Stores and materials at cost less obsolescence provision 2,717 2,474 2,557 32,027 23,257 23,453 Less: Non-current inventories (ore stockpiles) (1,006) (650) (1,006) 31,021 22,607 22,446 There are no inventories pledged as security to secure any borrowings of the Group.
30 JUNE 2020 INTERIM RESULTS 30 Anglo American Platinum Limited Interim Results 2020
for the six months ended 30 June 2020 Reviewed Audited six months ended Year ended 30 June 30 June 31 December 2020 2019 2019 Rm Rm Rm 16. CASH AND CASH EQUIVALENTS Cash on deposits and on hand 22,953 11,913 18,169 Restricted cash1 380 372 377 23,333 12,285 18,546
1 Cash held in trust comprises funds which may only be utilised for purposes of community development activities and villages resettlements. All income earned on these funds is
reinvested or spent to meet these obligations.
17. INTEREST-BEARING BORROWINGS
The Group has the following borrowing facilities: Committed facilities 20,709 20,559 20,540 Uncommitted facilities 6,735 6,417 6,403 Total facilities 27,444 26,976 26,943 Less: facilities utilised1 (8,539) (5,247) (323) Non-current interest-bearing borrowings (7,039) (5,158) (281) Current borrowings (1,500) (89) (42) Available facilities 18,905 21,729 26,620 Non-current interest bearing borrowings 7,039 5,158 281 Current borrowings 3,961 89 42 Interest bearing borrowings 1,500 89 42 Contract liability top-up2 2,461 — — Total interest-bearing borrowings 11,000 5,247 323 Weighted average borrowing rate (%) 5.64 8.46 9.67
1 Includes Rnil (30 June 2019: R4,851 million; 31 December 2019: Rnil) owing to Anglo American SA Finance Limited on the committed and uncommitted facilities. 2 The contract liability top-up represents amounts received in advance which will be deducted from payments to be received on future deliveries of metal.
Committed facilities are defined as the bank’s and Anglo American SA Finance Limited’s obligation to provide funding until maturity of the facility, by which time the renewal of the facility is negotiated. An amount of Rnil (30 June 2019: R500 million; 31 December 2019: Rnil) of the facilities is committed for less than a year; R17,409 million (30 June 2019: R16,517 million; 31 December 2019: R17,240 million) is committed for one to five years; Rnil (30 June 2019: R242 million; 31 December 2019: Rnil) is committed for more than five years, R1,000 million (30 June 2019: R1,000 million; 31 December 2019: R1,000 million) is committed for a rolling period of 364 days; R2,300 million (30 June 2019: R2,300 million; 31 December 2019: R2,300 million) is committed for a rolling period of 18 months. The Company has adequate committed facilities to meet its future funding requirements. Uncommitted facilities are callable on demand.
18. LEASE LIABILITIES
The group holds leases, under IFRS 16, at its various operations with various lease
Lease obligations 655 679 568 Less: Short-term portion included in current liabilities (99) (136) (164) Long-term portion included in non-current liabilities 556 543 404
Anglo American Platinum Limited Interim Results 2020 31 Reviewed Audited six months ended Year ended 30 June 30 June 31 December 2020 2019 2019 Rm Rm Rm 19. OTHER FINANCIAL LIABILITIES Financial liabilities carried at fair value Deferred consideration payable on acquisition of Mototolo Joint Operation 1,395 670 924 Non-current 1,395 670 924 Financial liabilities carried at amortised cost Platinum Producers' Environmental Trust (PPET) payable to Sibanye — 489 — Financial liabilities carried at fair value Deferred consideration payable on acquisition of Mototolo Joint Operation 1,331 402 592 Fair value of derivatives 63 1 17 Fair value of commodity contracts — 25 — Current 1,394 917 609 Total other financial liabilities 2,789 1,587 1,533 20. OTHER LIABILITIES Contract liability1 16,072 7,427 9,356 Liabilities for the return of metal2 2,584 — — Accrual for leave pay 1,178 971 1,037 Other accruals 987 1,142 913 20,821 9,540 11,306
1 The contract liability represents a payment in advance for metal to be delivered in six months time. An amount is received monthly on a rolling six-month basis over six years of the
contract ending in March 2023. The increase in the current period is due to higher PGM prices and fluctuations in the ZAR/USD exchange rate.
2 Liabilities for the return of metal comprise provisions arising from metal leasing transactions, the best estimate of which is determined with reference to the spot metal price at the end
21. COMMITMENTS AND CONTINGENT LIABILITIES
Commitments Property, plant and equipment Contracted for 3,256 2,387 2,511 Not yet contracted for 4,313 3,501 3,617 Authorised by the directors 7,569 5,888 6,128 Project capital 3,133 1,291 2,304 Within one year 2,041 685 1,298 Thereafter 1,092 606 1,006 Stay-in-business capital 4,436 4,597 3,824 Within one year 2,776 3,441 2,445 Thereafter 1,660 1,156 1,379
1 Prior period has been adjusted.
These commitments will be funded from existing cash resources, future operating cash flows, borrowings and any other funding strategies embarked on by the Group. The Group has a commitment to fund the care and maintenance costs of its associate, Bokoni Mine, for the remainder of 2020 for an amount of R122 million. This funding is contingent on the Group’s financial director reviewing the costs to ensure they are for approved care and maintenance costs before they are paid over to Bokoni. 51% of the committed funding is accounted for as a loan to Plateau when the funds are paid to Bokoni.
30 JUNE 2020 INTERIM RESULTS 32 Anglo American Platinum Limited Interim Results 2020
for the six months ended 30 June 2020 21. COMMITMENTS AND CONTINGENT LIABILITIES Contingent liabilities Letters of comfort have been issued to financial institutions to cover certain banking facilities. There are no encumbrances over Group assets. The Group is the subject of various claims, which are not expected, in aggregate, to result in material losses. The Group has, in the case of some of its mines, provided the Department of Minerals Resources with guarantees that cover the difference between the closure costs and amounts held in the environmental trusts. At 30 June 2020, these guarantees amounted to R3,240 million (30 June 2019: R 3,270 million; 31 December 2019: R 2,973 million). 22. RELATED PARTY TRANSACTIONS The Company and its subsidiaries, in the ordinary course of business, enter into various sale, purchase, service and lease transactions with Anglo American South Africa Investments Proprietary Limited (parent company) and the ultimate holding company (Anglo American plc), their subsidiaries, joint arrangements and associates, as well as transactions with the Group’s associates. Certain deposits and borrowings are also placed with subsidiaries of the holding company. The Group participates in the Anglo American plc insurance programme. Material related party transactions with subsidiaries and associates of Anglo American plc and the Group’s associates (as set out in note 8) and not disclosed elsewhere in the notes to the financial statements are as follows: Reviewed Audited six months ended Year ended 30 June 30 June 31 December 2020 2019 2019 Rm Rm Rm Deposits (including interest receivable)1 20,697 10,372 16,783 Purchase of goods and services from fellow subsidiaries 800 706 1,445 Technical and sustainability 305 278 506 Marketing administration costs2 94 58 127 Corporate costs 76 62 133 Supply chain 68 55 91 Information management 56 65 185 Research 50 49 83 Shared services 47 48 97 Shipping costs2 45 34 110 Office costs 19 18 38 Routine analysis (sample testing) 17 28 55 Base metals sales commission2 15 3 7 Enterprise development 8 8 13 Sale of metals to fellow subsidiaries2 351 18 731 Amounts owed to fellow subsidiaries2 295 120 162 Insurance paid for the year1 206 226 431 Interest received for the year1 202 109 253 Compensation paid to key management personnel 147 69 123 Commitment fees paid for the year1 34 — 37 Amounts receivable from fellow subsidiaries2 17 18 113 Interest paid for the year1 11 299 376 Interest-bearing borrowings (including interest accrued)1 — 4,882 — Insurance received for the year1 — — 40 Commitment fees owed to related parties1 — — 32
1 Fellow subsidiaries. 2 Prior period has been adjusted.
Trade payables Trade payables are settled on commercial terms. Deposits Deposits earn interest at market-related rates and are repayable on maturity. Interest-bearing borrowings Interest-bearing borrowings bear interest at market-related rates and are repayable on maturity.
Anglo American Platinum Limited Interim Results 2020 33 23. FAIR VALUE DISCLOSURES The following is an analysis of the financial instruments that are measured subsequent to initial recognition at fair value. They are grouped into Levels 1 to 3 based on the extent to which the fair value is observable. The levels are classified as follows:
Fair value measurement as at 30 June 30 June 2020 2020 Level 1 Level 2 Level 3 Description Rm Rm Rm Rm Financial assets at fair value through profit or loss Investments held by environmental trusts 776 776 — — Other financial assets 4,891 — 2,940 1,951 Equity investments irrevocably designated at FVTOCI Other financial assets 1,521 91 — 1,430 7,188 867 2,940 3,381 Financial liabilities at fair value through profit and loss Trade and other payables1 (7,150) — (7,150) — Other financial liabilities (2,789) — (63) (2,726) Non-financial liabilities at fair value through profit or loss Liabilities for return of metal (2,584) — (2,584) — (12,523) — (9,797) (2,726)
1 Represents payables under purchase of concentrate agreements.
Fair value measurement as at 30 June 30 June 2019 2019 Level 1 Level 2 Level 3 Description Rm Rm Rm Rm Financial assets through profit or loss Investments held by environmental trusts 1,252 1,252 — — Other financial assets 3,730 — 11 3,719 Equity investments irrevocably designated at FVTOCI Other financial assets 370 100 — 270 5,352 1,352 11 3,989 Financial assets through profit or loss Trade and other payables1 (6,684) — (6,684) — Other current financial liabilities (1,098) — (26) (1,072) (7,782) — (6,710) (1,072)
1 Represents payables under purchase of concentrate agreements.
30 JUNE 2020 INTERIM RESULTS 34 Anglo American Platinum Limited Interim Results 2020
for the six months ended 30 June 2020 23. FAIR VALUE DISCLOSURES Fair value measurement as at 31 December 31 December 2019 2019 Level 1 Level 2 Level 3 Description Rm Rm Rm Rm Financial assets at fair value through profit or loss Investments held by environmental trusts 798 798 — — Other financial assets 4,278 — 19 4,259 Equity investments irrevocably designated at FVTOCI Other financial assets 644 125 — 519 5,720 923 19 4,778 Financial liabilities at fair value through profit and loss Trade and other payables1 (8,722) — (8,722) — Other financial liabilities (1,533) — (17) (1,516) (10,255) — (8,739) (1,516)
1 Represents payables under purchase of concentrate agreements.
There were no transfers between the levels during the year. Valuation techniques used to derive Level 2 fair values Level 2 fair values for other financial liabilities relate specifically to forward foreign exchange contracts and fixed price commodity contracts. The valuation of forward foreign exchange contracts is a function of the ZAR:USD exchange rate at balance sheet date and the forward exchange rate that was fixed as per the forward foreign exchange rate contract. Fixed price commodity contracts are valued with reference to relevant quoted commodity prices at period end. Level 2 fair values for trade and other payables relate specifically to purchase of concentrate trade creditors which are priced in US dollar. The settlement of these purchase of concentrate trade creditors takes place on average three to four months after the purchase has taken
value of liabilities for the return of metal is determined by multiplying the quantities of metal under open leases by the relevant commodity prices and ZAR:USD exchange rates. Level 3 fair value measurement of financial assets and financial liabilities at fair value The Level 3 fair value of other financial assets comprises investment in unlisted companies Ballard Power Systems, SA SME Fund and Rand Mutual Holdings. These investments are irrevocably designated as at fair value through other comprehensive income per IFRS 9 Financial Instruments and the deferred consideration on the disposal of the Rustenburg Mine and Pandora Joint Operation which are classified as financial assets at fair value through profit or loss. The fair values are based on unobservable market data, and estimated with reference to recent third-party transactions in the instruments of the company, or based on the underlying discounted cash flows expected. The Level 3 fair value of other financial liabilities comprises the components of the deferred consideration on the acquisition of control in Mototolo business, which is classified as financial liabilities at fair value through profit or loss. The fair value is based on the underlying discounted cash flows expected.
Anglo American Platinum Limited Interim Results 2020 35 23. FAIR VALUE DISCLOSURES Reconciliation of Level 3 fair value measurements of financial assets and liabilities at fair value Reviewed Audited six months ended Year ended 30 June 30 June 31 December 2020 2019 2019 Rm Rm Rm Reconciliation of level 3 fair value assets Opening balance 4,778 3,887 3,887 Total gains included in other comprehensive income 911 100 279 Remeasurements of deferred considerations through profit or loss1 359 377 918 Payment received (2,667) (348) (348) Impairment of Primus Power — (22) — Investment in Primus Power convertible notes — 4 — Foreign exchange translation — (9) 42 Closing balance 3,381 3,989 4,778 Reconciliation of level 3 fair value liabilities Opening balance (1,516) (938) (938) Remeasurement of deferred consideration through profit and loss1 (1,732) (242) (762) Repayments 522 108 184 Closing balance (2,726) (1,072) (1,516)
1 These are included in fair value remeasurements of other financial assets and liabilities in statement of comprehensive income.
Deferred consideration terms are as follows: Rustenburg Mine Deferred consideration is calculated as 35% of the distributable free cash flows generated by Sibanye-Stillwater’s Rustenburg Mine over a six-year period from inception in November 2016, subject to a minimum receipt of R3 billion. The movement for the current period relates to changes in cash flows and the discount rate. Pandora Joint Operation Deferred consideration is calculated as 20% of the distributable free cash flows generated by Pandora operations over a six-year period from inception in December 2017, subject to a minimum consideration of R400 million. The movement for the current period relates to changes in cash flows and the discount rate. Mototolo Joint Operation Deferred consideration of R925 million is payable monthly over a period of 72 months from the effective date in November 2018 in monthly instalments, as well as annual top-up payments where applicable. The deferred consideration is remeasured based on the actual PGM 4E prices realised over the deferred consideration period. The maximum amount payable is limited to R22 billion. The movement for the period relates to increases in PGM prices and fluctuations in the ZAR:USD exchange rate.
30 JUNE 2020 INTERIM RESULTS 36 Anglo American Platinum Limited Interim Results 2020
for the six months ended 30 June 2020 23. FAIR VALUE DISCLOSURES Level 3 fair value sensitivities Assumed expected cash flows, discount rates and market prices of peer groups have a significant impact on the amounts recognised in the statement of comprehensive income. A 10% change in expected cash flows and a 0.5% change in the discount rates would have the following impact: Reviewed Audited six months ended Year ended 30 June 30 June 31 December 2020 2019 2019 Rm Rm Rm Financial assets Deferred consideration on Rustenburg Mine 10% change in expected cash flows Reduction to profit or loss 25 51 51 Increase to profit or loss 12 51 51 0.5% change in discount rates Reduction to profit or loss 11 34 28 Increase to profit or loss 11 34 28 Deferred consideration of Pandora Joint Operation 0.5% change in discount rates Reduction to profit or loss 4 3 3 Increase to profit or loss 4 3 3 Investment in equity investments 10% change in market price of peer groups Reduction to OCI 127 27 49 Increase to OCI 127 27 49 Financial liabilities Deferred consideration payable on Mototolo Joint Operation 10% change in PGM prices Reduction to profit or loss 530 468 461 Increase to profit or loss 530 468 461 0.5% change in discount rates Reduction to profit or loss 16 10 11 Increase to profit or loss 16 10 11 10% change in exchange rates Reduction to profit or loss 530 468 461 Increase to profit and loss 530 468 461 24. CHANGES IN ACCOUNTING ESTIMATES Change in estimate of quantities of inventory During the current period, the Group changed its estimate of the quantities of inventory based on the outcome of a physical count of in-process
in-process inventories being contained in weirs, pipes and other vessels, physical counts only take place once per annum, except in the Precious Metal Refinery, where the physical count is usually conducted every three years. The Precious Metals Refinery physical count was conducted in 2019. This change in estimate has had the effect of decreasing the value of inventory disclosed in the financial statements by R782 million (31 December 2019: increasing of R961 million). This results in the recognition of an after-tax-loss of R566 million (31 December 2019: after- tax-gain of R692 million). Rustenburg deferred consideration The Group’s sale of the Rustenburg Mine completed on 1 November 2016. The present value of the deferred consideration was recognised as a level 3 financial asset at fair value through profit or loss. Remeasurements arising from changes in estimates of cash flows as well as the unwinding of the discount are included in fair value remeasurements of other financial assets and liabilities. This has given rise to a post-tax increase of R236 million (30 June 2019: R220 million; 31 December 2019: R495 million) in the present value of the deferred consideration, and the recognition of a gain in profit or loss which is included in headline earnings.
Anglo American Platinum Limited Interim Results 2020 37 25. IMPAIRMENT OF ASSETS AND INVESTMENTS Equity investments in Bokoni Holdco and associated loans AAP holds a 49.00% shareholding in Bokoni Holdco, which is equity accounted as an associate. On 21 July 2017 Atlatsa Resources (parent of Plateau) announced the placement of Bokoni Platinum Mine on care and maintenance, which was effected on 1 October 2017. AAP committed to support Bokoni while on care and maintenance until the end of December 2020. A total of R77 million was advanced during the period ended 30 June 2020. All funding advanced has been impaired to the extent that it comprises a loan to Plateau for its 51% share of the funding requirements. The 49% effective shareholder contribution to Bokoni was capitalised to the investment. Equity-accounted losses were applied thereto. Bokoni R38 million (49%) of the care and maintenance funding was capitalised to the investment in Bokoni and equity-accounted losses to the same value were applied against this amount. The equity-accounted losses impact headline earnings. Plateau R39 million (51%) of the care and maintenance funding for 2020 was capitalised as a loan to Plateau. The full value hereof was impaired. 26. POST-BALANCE SHEET EVENTS There are no post-balance sheet events other than disclosed below. Dividend declared A final dividend of R10.23 per share (~R2.8 billion) for the period ended 30 June 2020 was declared after period end, payable on Monday, 31 August 2020 to shareholders recorded in the register at the close of business on Friday, 28 August 2020. 27. AUDITORS REVIEW These condensed consolidated interim financial statements have been reviewed by the Group’s auditors, PricewaterhouseCoopers Inc. The review of the condensed consolidated interim financial statements was performed in accordance with ISRE 2410, Review of Interim Financial Information Performed by the Independent Auditor of the Entity. The auditor’s review report does not necessarily report on all the information contained in these interim results. Shareholders are advised that in order to obtain a full understanding of the nature of the auditors engagement they should read the auditor’s review report and obtain the accompanying financial information from the registered office. Any reference to future financial performance, included in these interim results, has not been reviewed or reported on by the Group’s auditors.
30 JUNE 2020 INTERIM RESULTS 38 Anglo American Platinum Limited Interim Results 2020
for the six months ended 30 June 2020 PricewaterhouseCoopers Inc., 4 Lisbon Lane, Waterfall City, Jukskei View, 2090 Private Bag X36, Sunninghill, 2157, South Africa T: +27 (0) 11 797 4000, F: +27 (0) 11 209 5800, www.pwc.co.za
Chief Executive Officer: L S Machaba The Company's principal place of business is at 4 Lisbon Lane, Waterfall City, Jukskei View, where a list of directors' names is available for inspection.
INDEPENDENT AUDITOR’S REVIEW REPORT ON INTERIM FINANCIAL STATEMENTS To the Shareholders of Anglo American Platinum Limited We have reviewed the condensed consolidated interim financial statements of Anglo American Platinum Limited in the accompanying interim report, which comprise the condensed consolidated statement of financial position as at 30 June 2020 and the related condensed consolidated statements of comprehensive income, changes in equity and cash flows for the six-months then ended, and selected explanatory notes. Directors’ Responsibility for the Interim Financial Statements The directors are responsible for the preparation and presentation of these interim financial statements in accordance with the International Financial Reporting Standard, (IAS) 34 Interim Financial Reporting, the SAICA Financial Reporting Guides as issued by the Accounting Practices Committee and Financial Pronouncements as issued by the Financial Reporting Standards Council and the requirements of the Companies Act of South Africa, and for such internal control as the directors determine is necessary to enable the preparation
Auditor’s Responsibility Our responsibility is to express a conclusion on these interim financial statements. We conducted our review in accordance with International Standard on Review Engagements 2410, Review of Interim Financial Information Performed by the Independent Auditor of the Entity. ISRE 2410 requires us to conclude whether anything has come to our attention that causes us to believe that the interim financial statements are not prepared in all material respects in accordance with the applicable financial reporting framework. This standard also requires us to comply with relevant ethical requirements. A review of interim financial statements in accordance with ISRE 2410 is a limited assurance engagement. We perform procedures, primarily consisting of making inquiries of management and others within the entity, as appropriate, and applying analytical procedures, and evaluate the evidence obtained. The procedures in a review are substantially less than and differ in nature from those performed in an audit conducted in accordance with International Standards on Auditing. Accordingly, we do not express an audit
Conclusion Based on our review, nothing has come to our attention that causes us to believe that the accompanying condensed consolidated interim financial statements of Anglo American Platinum Limited for the six months ended 30 June 2020 are not prepared, in all material respects, in accordance with the International Financial Reporting Standard, (IAS) 34 Interim Financial Reporting, the SAICA Financial Reporting Guides as issued by the Accounting Practices Committee and Financial Pronouncements as issued by the Financial Reporting Standards Council and the requirements of the Companies Act of South Africa. PricewaterhouseCoopers Inc. Director: JFM Kotzé Registered Auditor Waterfall City 27 July 2020
Anglo American Platinum Limited Interim Results 2020 39
for the six months ended 30 June 2020 Objective areas 2020 target 2020 half year performance Safety and health Zero fatalities Zero fatalities TRCFR (per million hours) lower than 2.54 2.24 TRCFR per million hours worked LTIFR (per million hours) lower than 2.25 (15% improvement target on prior three-year average) Note: No longer a targeted metric for Anglo American Platinum 1.82 LTIFR per million hours worked HIV management: 90% of at risk population knowing their status 54% of employees know their HIV status (end May) HIV management: 90% of HIV-positive undergoing treatment (on ART) 94% of known HIV-positive employees are on ART TB incidence rate of below 600 per 100,000 Note: No longer a targeted metric for Anglo American Platinum TB incidence rate of 215 per 100,000 employees Medical Surveillance: 100% annual medical surveillance of persons potentially at risk of exposure to airborne pollutants (Cat A) 100% annual medical surveillance of Cat A employees (Excludes Unki) Mineral policy and legislative compliance 26% ownership of Reserves and Resources by historically disadvantaged South Africans (HDSAs) As at 31 December 2019, 48.6% ownership measured as the HDSA shareholding in the businesses that we control and the portion of our business transferred to HDSAs. Which excludes 9.7% ownership held by HDSAs through mandated investments. MCIII procurement expenditure: Measure: Performance: Mining Goods Mining Goods 21% HDP 38% HDP 5% Women/Youth 10% Women/Youth 44% BEE compliant 48% BEE compliant Mining Services Mining Services 50% HDP 51% HDP 15% Women 10% Women 5% Youth 6% Youth 10% BEE compliant 47% BEE compliant According to MC3 Targets (2019 – 2024) HDSA in: Top management (Board): 50% 36% Women in top management (Board): 20% 27% Executive management (Exco): 50% 43% Women at Exco level: 20% 29% Senior management: 60% 51% Women in senior management: 25% 17% Middle management: 60% 72% Women in middle management: 25% 27% Junior management: 70% 83% Women in junior management: 30% 24% Core Skills: 60% 76% Maintain ISO 14001 certification: 100% renewal of certificates for RBMR and PMR Rustenburg Base Metals Refinery (RMBR) had the stage 2 Bureau Veritas (BV) audit on 23-25 June 2020 on part 1 (Systems). Part 2 of the audit (field verification) is yet to be
be made. Precious Metals Refinery (PMR), The BV audit is scheduled for 15 and 16 September. Our certificate expires in October 2021. Both operations ISO14001:2015 certification remains valid until 2021 (pending 2020 audits).
30 JUNE 2020 INTERIM RESULTS 40 Anglo American Platinum Limited Interim Results 2020
for the six months ended 30 June 2020 Objective areas 2020 target 2020 half year performance Mineral policy and legislative compliance Zero Level 4 and 5 environmental incidents On target – No level 4 or 5 environmental incidents reported Zero environmental legal non-compliance directives On target – No directives received Labour relations and our performance Target of 113 PGM ounces produced per employee Achieved – 80 PGM ounces produced per employee Labour unavailability to be below 19.07% The total absence rate for Jan to June 2020 is 35.06% (Dec 2019 18.37%, Dec 2018 = 20%) against a target of 19.07%. The sharp increase in absences is a consequence of COVID-19 and the subsequent protocols followed in line with all the relevant regulations. Community development Implementation of second generation SLP In progress – 48 of the 74 projects from all our sites have been completed. The 26 are at different stages of implementation and have been impacted by the lockdown due to COVID-19 as all projects were placed on hold. The implementation schedules are being reviewed after and the delays will be communicated to the relevant stakeholders in due course and construction has resumed under strict COVID-19 protocols. 1% after-tax profit to be spent on community development Social Performance spend internally amounted to R115m YTD, excluding Unki spend of R0.86m Access to and allocation of natural resources Energy
Premised on the trend required to achieve the 2030 targets for a 30% reduction (off a 2016 baseline)
(Below the year to date target of 8.41 million GJ)
(Above target due to lower than planned production) CO2 emissions
(Below the year to date target of 1.86 million tonnes)
0.173 tonnes CO2/ton milled
(Above target due to lower than planned production) Premised on the trend required to achieve the 2030 targets for a 30% reduction (off a 2016 baseline) Water Reduction in potable and raw water consumption towards our 2030 reduction
0.32 m³/ton milled
Mogalakwena and ACP/WVS to 19.4 Mℓ/d
Water Management Standards (WMS)
instrumentation
Achieved/on target Not achieved/below target In progress
Anglo American Platinum Limited Interim Results 2020 41
for the six months ended 30 June 2020 Glossary of terms Description/Definition Average in service employees The average number of employees costed on both working cost and SIB, in service over the full financial year All-in sustaining costs (AISC) Includes cash operating costs, other indirect costs, other direct and allocated net expenses, direct and allocated sustaining capex, capitalised waste stripping and allocated marketing and market development costs net of revenue from all metals other than platinum – presented before project and restructuring costs and abnormal activities Attributable economic free cash flow Cash flow after all cash expenses (mining, overhead, marketing and market development), sustaining (SIB) and capitalised waste Attributable net cash flow Cash flow after all cash expenses (mining, overhead, marketing and market development), sustaining (SIB), capitalised waste and project capital expenses Cash-on mine costs Includes all direct mining, concentrating plus on-mine and allocated centralised services costs Cash operating costs Includes all direct mining, concentrating, on-mine and allocated centralised services, allocated smelting, treatment and refining costs Cash on-mine cost per tonne milled Cash-on mine costs over tonnes milled – mined volume metric only Cash operating cost per PGM oz produced Cash operating costs for mined volume over PGM ounces produced from mined volume. Excludes Purchase of concentrate (POC) and project costs for Twickenham EBITDA Earnings before interest, tax, depreciation and amortisation adjusted to exclude scrapping of property, plant and equipment. EBIT Earnings before interest and tax adjusted to exclude scrapping of property, plant and equipment. Headcount (as at period ended) Includes AAP own and contractors excluding JV employees and contractors as at period end costed to working costs and stay-in business capital Other PGMs + Gold Sum total of rhodium, iridium, ruthenium and gold PGMs Sum total of platinum, palladium, rhodium, iridium, ruthenium and gold PGM ounces produced per employee PGM ounces produced from mined volume (both own and JV mines) expressed as output per average employee for both Own mines and attributable JV employees POC Purchase of concentrate Produced ounces M&C Metal in concentrate delivered to the smelters for onward processing Rand basket price per PGM oz sold – average Net sales revenue from all metals (PGMs, base metals and other metals) over PGM ounces sold – excluding trading Rand basket price per Pt oz sold – average Net sales revenue from all metals (PGMs, base metals and other metals) over Pt ounces sold – excluding trading ROCE Return on capital employed calculated as EBIT over average capital employed Stay–in–business (SIB) SIB capital reported on asset analysis includes on-mine sustaining capital as well as allocated
30 JUNE 2020 INTERIM RESULTS 42 Anglo American Platinum Limited Interim Results 2020
for the six months ended 30 June 2020 SALIENT FEATURES Six months ended Year ended 30 June 30 June 31 December 2020 2019 % change 2019 Average market prices achieved Platinum US$/oz 857 831 3 861 Palladium US$/oz 2,141 1,400 53 1,518 Rhodium US$/oz 8,985 2,840 216 3,808 Iridium US$/oz 1,525 1,457 5 1,462 Ruthenium US$/oz 241 256 (6) 238 Gold US$/oz 1,631 1,317 24 1,396 Nickel US$/tonne 13,145 12,356 6 14,050 Copper US$/tonne 5,573 6,145 (9) 5,949 Chrome US$/tonne 109 129 (15) 121 % contribution of net revenue PGMs % 95.7 92.7 3 92.6 Platinum % 15.3 28.8 (13) 28.7 Palladium % 44.2 42.8 1 39.9 Rhodium % 29.1 14.9 14 18.0 Iridium % 3.0 2.3 1 2.2 Ruthenium % 1.6 1.3 1.4 Gold % 2.5 2.6 (0) 2.5 Nickel % 2.5 4.1 (2) 4.5 Copper % 0.9 1.4 (1) 1.2 Chrome % 0.8 1.4 (1) 1.4 Other metals % 0.2 0.4 (0) 0.2 Exchange rates Average achieved on sales ZAR/US$ 16.44 14.26 15 14.50 Closing exchage rate at end of period ZAR/US$ 17.36 14.17 22 14.03 Basket prices achieved – excluding trading PGM – Dollar basket price US$/PGM oz 1,956 1,255 56 1,347 PGM – Rand basket price Rand/PGM oz 32,166 17,901 80 19,534 Platinum – Dollar basket price US$/Pt oz 5,520 2,685 106 2,819 Platinum – Rand basket price Rand/Pt oz 90,776 38,305 137 40,862 Total PGM ounces sold – excluding trading 1,229.3 2,160.0 (43) 4,633.7 Platinum 000 ounces 435.6 1,009.4 (57) 2,215.1 Palladium 000 ounces 383.4 768.0 (50) 1,520.7 Other PGMs+Gold 000 ounces 410.3 382.6 7 897.9 Total PGM ounces sold – trading 459.2 184.7 149 349.0 Platinum 000 ounces 146.3 18.0 713 46.1 Palladium 000 ounces 292.3 139.8 109 262.2 Rhodium 000 ounces 10.6 6.4 66 20.3 Gold 000 ounces 10.0 20.5 (51) 20.5
Anglo American Platinum Limited Interim Results 2020 43 Six months ended Year ended 30 June 30 June 31 December 2020 2019 % change 2019 Financials – excluding trading Net sales revenue R million 39,905 39,193 2 91,697 from platinum R million 6,213 11,976 (48) 27,625 from palladium R million 13,855 15,305 (9) 33,486 from rhodium R million 13,893 6,038 130 16,556 from other PGMs and gold R million 3,591 2,246 60 5,572 from base and other metals R million 1,909 3,025 (37) 7,088 from chrome R million 444 603 (26) 1,370 Total operating costs R million (27,328) (26,865) 2 (61,994) EBITDA R million 12,577 12,328 2 29,703 EBITDA margin % 32 31 32 EBIT R million 10,449 10,137 3 25,262 ROCE % 49 45 5 57 Attributable economic free cash flow R million 903 4,883 (82) 18,258 Attributable net cash flow R million 465 4,657 (90) 17,170 Costs and unit costs Cash operating costs R million 13,924 14,641 (5) 30,285 Cash on-mine cost per tonne milled R/tonne 1,008 853 18 890 Cash operating cost per PGM ounce produced3 R/PGM oz 12,555 9,951 26 10,189 Cash operating cost per PGM ounce produced3 $/PGM oz 753 701 7 703 Stay-in-business capital R million 1,408 1,799 (22) 4,875 Capitalised waste stripping R million 1,394 1,148 21 2,062 Financial statistics Gross profit margin % 24 25 (1) 27 Operating profit as a % of average operating assets % 29 30 (1) 38 EBITDA including trading1 R million 13,063 12,371 6 29,950 EBITDA excluding trading1 R million 12,577 12,328 2 29,703 Return on average capital employed (ROCE) % 48 45 3 58 Return on average attributable capital employed % 57 50 7 66 Current ratio 1.5:1 1.6:1 (6) 1.6:1 Interest cover – EBITDA excluding trading times 59 19 208 57 Debt coverage ratio times 0.7 1.7 (59) 36.2 Dividend cover times 2.6 2.6 — 1.3 Interest-bearing debt to shareholders’ equity % 20 11 9 2 Net asset value as a % of market capitalisation2 % 17 23 (6) 17 Effective cash tax paid rate % 14 12 2 13 Market information and share statistics Total shares in issue (net of treasury shares) millions 269.0 268.9 — 268.8 Weighted average number of shares in issue millions 262.6 262.3 262.5 Treasury shares held millions 0.7 0.8 (11) 0.9 Market capitalisation2 billions 337.3 225.1 50 351.4 Closing share price cents 125,408 83,693 50 130,733 Head count (as at period ended) Total employees (AAP own and contractors excluding JVs) 25,239 25,263 (0) 25,268 Own enrolled 22,601 22,804 (1) 22,960 Contractors 2,638 2,459 7 2,308 Productivity PGM ounces produced per employee per annum 80.2 107.5 (25) 110.5
1 Earnings adjusted for asset scrapping and insurance receipt for damage to assets. 2 Net of 682 113 (Six months ended 2019: 766 128, Year ended 2019: 854 112) shares held in respect of the Group’s share scheme. 3 H1 2019 restated to exclude chrome costs.
30 JUNE 2020 INTERIM RESULTS 44 Anglo American Platinum Limited Interim Results 2020
for the six months ended 30 June 2020 GROSS PROFIT ON METAL SALES AND EBITDA Mined POC Trading Total Six months ended 30 June 2020 Net sales revenue 27,817 12,088 14,866 54,771 Cost of sales (17,266) (10,135) (14,380) (41,781) Cash operating costs (13,973) (1,131) — (15,104) On-mine (11,302) — — (11,302) Smelting (1,440) (565) — (2,005) Treatment and refining (1,231) (566) — (1,797) Depreciation (1,944) (184) — (2,128) On-mine (1,414) — — (1,414) Smelting (263) (90) — (352) Treatment and refining (247) (86) — (333) Other costs (20) (9) — (29) Purchase of metals and leasing activities (1,842) (14,719) (14,128) (30,690) Increase in metal inventories 2,631 5,989 (252) 8,367 Decrease in ore stockpiles 48 — — 48 Other costs (2,186) (89) — (2,275) Gross profit on metal sales 10,551 1,953 486 12,990 Gross profit margin (%) 38 16 3 24 Add back depreciation 1,944 184 — 2,128 Other income and expenses (333) (16) — (349) Profit and loss on associates 66 — — 66 Operating EBITDA 12,227 2,121 486 14,834 Operating EBITDA margin (%) 44 18 3 27 Market development and promotional expenditure (279) (121) — (400) Restructuring (58) — — (58) Covid-19 costs (251) — — (251) Foreign Currency gains/losses (1,063) — — (1,063) EBITDA 10,577 2,000 486 13,063 EBITDA margin (%) 38 17 3 24
Anglo American Platinum Limited Interim Results 2020 45 Mined POC Trading Total Six months ended 30 June 2019 Net sales revenue 25,220 13,973 3,694 42,887 Cost of sales (16,587) (11,888) (3,651) (32,126) Cash operating costs (14,671) (1,194) (1) (15,866) On-mine (11,969) — — (11,969) Smelting (1,397) (576) — (1,973) Treatment and refining (1,305) (618) (1) (1,924) Depreciation (2,000) (191) — (2,191) On-mine (1,513) — — (1,513) Smelting (218) (80) — (298) Treatment and refining (245) (97) — (342) Other costs (24) (14) — (38) Purchase of metals and leasing activities 137 (9,315) (3,650) (12,828) Increase in metal inventories 1,863 (1,102) — 761 Increase in ore stockpiles (100) — — (100) Other costs (1,816) (86) — (1,902) Gross profit on metal sales 8,633 2,085 43 10,761 Gross profit margin % 34 15 1 25 Add back depreciation 2,000 191 — 2,191 Other income and expenses (173) (20) — (193) Profit and loss on associates (32) — — (32) Operating EBITDA 10,428 2,256 43 12,727 Operating EBITDA margin % 41 16 1 30 Market development and promotional expenditure (226) (128) — (354) Restructuring (1) — — (1) EBITDA 10,200 2,128 43 12,371 EBITDA margin % 40 15 1 29
30 JUNE 2020 INTERIM RESULTS 46 Anglo American Platinum Limited Interim Results 2020
for the six months ended 30 June 2020 GROSS PROFIT ON METAL SALES AND EBITDA Mined POC Trading Total For the year ended 31 December 2019 Net sales revenue 60,989 30,708 7,854 99,551 Cost of sales (38,520) (26,610) (7,607) (72,737) Cash operating costs (31,267) (2,345) — (33,612) On-mine (25,624) — — (25,624) Smelting (2,963) (1,197) — (4,159) Treatment and refining (2 680) (1,149) — (3,829) Depreciation (4,059) (382) — (4,441) On-mine (3,053) — — (3,053) Smelting (499) (186) — (685) Treatment and refining (509) (196) — (705) Other costs 2 — — 2 Purchase of metals and leasing activities 61 (22,838) (7,607) (30,384) Increase in metal inventories 1,750 (840) — 910 Increase in ore stockpiles (137) — — (137) Other costs (4,868) (205) — (5,073) Gross profit on metal sales 22,469 4,098 247 26,814 Gross profit margin % 37 13 3 27 Add back depreciation 4,058 383 — 4,441 Other income and expenses (322) (87) — (409) Profit and loss on associates (108) — — (108) Operating EBITDA 26,099 4,392 247 30,738 Operating EBITDA margin % 43 14 3 31 Market development and promotional expenditure (524) (264) — (788) Restructuring — — — — EBITDA 25,575 4,128 247 29,950 EBITDA margin % 42 13 3 30
Anglo American Platinum Limited Interim Results 2020 47 REFINED PRODUCTION Six months ended Year ended 30 June 30 June 31 December 2020 2019 % change 2019 Total operations Refined production from mining operations Total PGMs 000 oz 693.0 1,363.2 (49) 3,037.3 Platinum 000 oz 271.3 616.6 (56) 1,410.8 Palladium 000 oz 264.5 511.4 (48) 1,074.6 Rhodium 000 oz 51.1 79.5 (36) 179.4 Other PGMs 000 oz 73.1 118.2 (38) 285.3 Gold 000 oz 33.0 37.5 (12) 87.2 Nickel tonnes 3,718 7,286 (49) 16,391 Copper tonnes 3,728 4,995 (25) 11,562 Chrome tonnes (100%) tonnes 260,923 424,150 (38) 908,672 Refined production from purchases (including toll refined metal) Total PGMs 000 oz 553.9 935.0 (41) 2,113.8 Platinum 000 oz 266.6 483.9 (45) 1,103.3 Palladium 000 oz 150.4 259.5 (42) 560.3 Rhodium 000 oz 42.3 60.2 (30) 144.9 Other PGMs 000 oz 83.1 120.8 (31) 278.4 Gold 000 oz 11.5 10.6 9 26.9 Nickel tonnes 1,408 2,536 (44) 6,645 Copper tonnes 819 1,717 (52) 2,649 Total refined production (including toll refined metal) Total PGMs 000 oz 1,246.9 2,298.2 (46) 5,151.0 Platinum 000 oz 537.9 1,100.5 (51) 2,514.2 Palladium 000 oz 414.9 770.9 (46) 1,634.9 Rhodium 000 oz 93.4 139.7 (33) 324.2 Other PGMs 000 oz 156.2 239.0 (35) 563.6 Gold 000 oz 44.5 48.1 (7) 114.1 Nickel tonnes 5,126 9,822 (48) 23,036 Copper tonnes 4,547 6,711 (32) 14,211 Chrome tonnes (100%) tonnes 260,923 424,150 (38) 908,672
30 JUNE 2020 INTERIM RESULTS 48 Anglo American Platinum Limited Interim Results 2020
for the six months ended 30 June 2020 REFINED PRODUCTION Six months ended Year ended 30 June 30 June 31 December 2020 2019 % change 2019 SPLIT OF TOTAL REFINED PRODUCTION Platinum % 43 48 (5) 49 Palladium % 33 34 (0) 32 Rhodium % 7 6 1 6 Other PGMs % 13 10 2 11 Gold % 4 2 1 2 Base metals Nickel % 52 58 (6) 61 Copper % 46 40 6 37 Other Base Metals % 2 2 1 2 PLATINUM PIPELINE CALCULATION Own mined volume 000 oz 423.5 565.6 (25) 1,060.4 JV mined volume 000 oz 64.7 99.1 (35) 317.8 Purchase of concentrate 000 oz 260.2 327.5 (21) 672.4 M&C platinum production 000 oz 748.4 992.2 (25) 2,050.6 Pipeline stock adjustment 000 oz 83.3 (100) 83.3 Pipeline movement 000 oz (347.5) (72.8) 377 77.0 Refined platinum production (excluding toll refined metal) 000 oz 400.9 1,002.7 (60) 2,210.9
Anglo American Platinum Limited Interim Results 2020 49 TOTAL MINED VOLUME (All statistics represent attributable contribution for mined production i.e. excluding POC and trading) Six months ended Year ended 30 June 30 June 31 December 2020 2019 % change 2019 Production Total development km 16.3 24.6 (34) 52.5 Immediately available ore reserves months 30.7 39.2 (22) 43.0 Square metres 000 m² 709 991 (28) 2,108 Tonnes milled 000 tonnes 11,163 14,151 (21) 28,932 Surface tonnes 000 tonnes 6,772 7,568 (11) 15,070 Underground tonnes 000 tonnes 4,391 6,583 (33) 13,862 UG2 tonnes milled to total Merensky and UG2 % 98.0 96.8 1 97.1 Built-up head grade 4E g/tonne 3.44 3.57 (4) 3.62 Surface tonnes 4E g/tonne 3.21 3.31 (3) 3.36 Merensky Underground tonnes 4E g/tonne 8.06 5.24 54 5.01 UG2 Underground tonnes 4E g/tonne 3.84 3.92 (2) 3.96 Total production (M&C) PGMs 000 ounces 1,084.8 1,453.8 (25) 3,011.2 Platinum 000 ounces 488.2 664.7 (27) 1,378.2 Palladium 000 ounces 406.3 511.4 (21) 1,049.2 Rhodium 000 ounces 59.8 88.1 (32) 186.0 Iridium 000 ounces 19.2 29.6 (35) 63.0 Ruthenium 000 ounces 77.5 119.3 (35) 252.1 Gold 000 ounces 33.7 40.7 (17) 82.7 Nickel tonnes 9,115 9,912 (8) 20,677 Copper tonnes 6,123 6,440 (5) 13,517 Chrome tonnes 260,923 424,150 (38) 908,672 Total PGM ounces refined 693.0 1,363.2 (49) 3,037.3 Platinum 000 ounces 271.3 616.6 (56) 1,410.8 Palladium 000 ounces 264.5 511.4 (48) 1,074.6 Other PGMS+Gold 000 ounces 157.2 235.2 (33) 551.9 Total PGM ounces sold – excluding trading 821.7 1,360.0 (40) 3,002.8 Platinum 000 ounces 294.9 611.5 (52) 1,401.6 Palladium 000 ounces 293.7 534.8 (45) 1,092.3 Other PGMS+Gold 000 ounces 233.1 213.7 9 508.9 Employees and efficiencies Own employees average 23,283 23,598 (1) 23,639 Contractor employees average 3,988 3,457 15 3,607 PGM ounces produced per employee per annum 80.2 107.5 (25) 110.5
30 JUNE 2020 INTERIM RESULTS 50 Anglo American Platinum Limited Interim Results 2020
for the six months ended 30 June 2020 TOTAL MINED VOLUME (All statistics represent attributable contribution for mined production i.e. excluding POC and trading) Six months ended Year ended 30 June 30 June 31 December 2020 2019 % change 2019 Financials – excluding trading Rand basket price per PGM oz sold R/PGM oz 33,853 18,544 83 20,310 Dollar basket price per PGM oz sold $/PGM oz 2,060 1,300 58 1,401 Rand basket price per Pt oz sold R/Pt oz 94,311 41,241 129 43,515 Dollar basket price per Pt oz sold $/Pt oz 5,738 2,891 98 3,001 Net sales revenue R million 27,817 25,220 10 60,989 from platinum R million 4,222 7,262 (42) 17,520 from palladium R million 10,637 10,674 (0) 24,153 from rhodium R million 9,194 3,479 164 10,143 from other PGMs and gold R million 2,184 1,369 59 3,474 from base and other metals R million 1,136 1,833 (38) 4,329 from chrome R million 444 603 (26) 1,370 Total operating costs R million (15,589) (14,792) 5 (34,890) EBITDA R million 12,227 10,428 17 26,099 EBITDA margin % 44 41 3 43 EBIT R million 10,284 8,427 22 22,041 ROCE % 51 39 12 51 Attributable economic free cash flow R million 6,767 5,747 18 17,976 Attributable net cash flow R million 6,348 5,521 15 16,916 Costs and unit costs Cash operating costs R million 13,924 14,641 (5) 30,285 Cash on-mine cost per tonne milled R/tonne 1,008 853 18 869 Cash operating cost per PGM oz produced1 R/PGM oz 12,555 9,951 26 10,189 Cash operating cost per PGM oz produced1 $/PGM oz 753 701 8 703 Stay-in business capital R million 1,268 1,579 (20) 4,391 Capitalised waste stripping R million 1,394 1,148 21 2,062 All-in sustaining costs net of metal revenue credits
$ million (250) 122 (304) (22) All-in sustaining costs per platinum ounce sold $/Pt oz (480) 199 (342) (15) Reconciling items for AISC and free cash flow Allocated marketing and market development costs $/Pt oz sold 57 26 117 26
1 H1 2019 restated to exclude chrome costs.
Anglo American Platinum Limited Interim Results 2020 51 TOTAL PURCHASED AND TOLLED VOLUME (All statistics represent attributable contribution for purchased and tolled production) Six months ended Year ended 30 June 30 June 31 December 2020 2019 % change 2019 Total production (M&C) PGMs 000 ounces 535.2 693.1 (23) 1,429.6 Platinum 000 ounces 260.2 327.5 (21) 672.4 Palladium 000 ounces 125.3 162.4 (23) 336.7 Rhodium 000 ounces 36.1 47.1 (24) 98.0 Iridium 000 ounces 19.5 27.1 (28) 56.4 Ruthenium 000 ounces 86.8 120.6 (28) 249.0 Gold 000 ounces 7.2 8.4 (14) 17.0 Nickel tonnes 2,237 2,458 (9) 8,881 Copper tonnes 1,320 2,250 (41) 3,523 Total PGM ounces refined 553.9 935.0 (41) 1,612.7 Platinum 000 ounces 266.6 483.9 (45) 800.1 Palladium 000 ounces 150.4 259.5 (42) 405.9 Other PGMs+Gold 000 ounces 137.1 191.6 (28) 406.7 Total PGM ounces sold – excluding trading 407.6 800.0 (49) 1,630.8 Platinum 000 ounces 140.7 397.9 (65) 813.5 Palladium 000 ounces 89.7 233.2 (62) 428.5 Other PGMs+Gold 000 ounces 177.2 168.9 5 388.8 Financials – excluding trading Rand basket price per PGM oz sold R/PGM oz 28,691 16,839 70 18,147 Dollar basket price per PGM oz sold $/PGM oz 1,746 1,181 48 1,251 Rand basket price per Pt oz sold R/Pt oz 83,144 33,859 146 37,746 Dollar basket price per Pt oz sold $/Pt oz 5,059 2,374 113 2,603 Net sales revenue R million 12,088 13,973 (13) 30,708 from platinum R million 1,991 4,714 (58) 10,106 from palladium R million 3,218 4,631 (31) 9,332 from rhodium R million 4,699 2,559 84 6,413 from other PGMs and gold R million 1,406 877 60 2,098 from base and other metals R million 773 1,192 (35) 2,760 Total operating costs R million (9,967) (11,717) (15) (26,316) EBITDA R million 2,121 2,256 (6) 4,392 EBITDA margin % 18 16 1 14 EBIT R million 1,937 2,065 (6) 4,009 ROCE % 173 130 43 501 Attributable economic free cash flow R million (4,093) (508) 705 1,070 Attributable net cash flow R million (4,111) (508) 709 1,041 Costs and unit costs Cash operating costs R million 14,709 10,261 43 25,222 Stay-in business capital R million 140 221 (36) 483
30 JUNE 2020 INTERIM RESULTS 52 Anglo American Platinum Limited Interim Results 2020
for the six months ended 30 June 2020 MOGALAKWENA PLATINUM MINE (100% owned) Six months ended Year ended 30 June 30 June 31 December 2020 2019 % change 2019 Production Metres drilled 000 m 712 665 7 1,440 In-pit ore reserves months 28.1 27.7 2 31.2 Total tonnes mined 000 tonnes 38,130 38,635 (1) 81,315 Waste tonnes mined 000 tonnes 32,899 34,455 (5) 67,033 Ore tonnes mined 000 tonnes 5,231 4,180 25 14,282 Stripping ratio 6.3 8.2 (24) 4.7 Tonnes milled 000 tonnes 6,551 6,891 (5) 13,710 Built-up head grade 4E g/tonne 3.24 3.42 (5) 3.45 Total mined production (M&C) PGMs 000 ounces 559.9 609.7 (8) 1,215.0 Platinum 000 ounces 239.2 258.3 (7) 517.5 Palladium 000 ounces 257.5 281.0 (8) 557.9 Rhodium 000 ounces 17.7 18.5 (4) 36.7 Iridium 000 ounces 3.6 4.2 (14) 8.3 Ruthenium 000 ounces 15.3 16.8 (9) 32.9 Gold 000 ounces 26.5 30.9 (14) 61.8 Nickel tonnes 7,438 7,533 (1) 15,674 Copper tonnes 4,921 4,861 1 10,210 Total PGM ounces refined 317.4 571.6 (44) 1,228.5 Platinum 000 ounces 114.3 234.7 (51) 523.8 Palladium 000 ounces 151.5 275.9 (45) 567.8 Other PGMs+Gold 000 ounces 51.6 61.0 (15) 136.9 Total PGM ounces sold – excluding trading 343.3 571.1 (40) 1,221.9 Platinum 000 ounces 121.9 231.3 (47) 519.2 Palladium 000 ounces 164.3 286.0 (43) 575.5 Other PGMs+Gold 000 ounces 57.1 53.8 6 127.2 Employees and efficiencies Own employees average 1,990 1,916 4 1,936 Contractor employees average 255 274 (7) 272 PGM ounces produced per employee per annum 499 557 (10) 550
Anglo American Platinum Limited Interim Results 2020 53 Six months ended Year ended 30 June 30 June 31 December 2020 2019 % change 2019 Financials – excluding trading Rand basket price per PGM oz sold R/PGM oz 33,164 19,376 71 21,152 Dollar basket price per PGM oz sold $/PGM oz 2,018 1,358 49 1,459 Rand basket price per Pt oz sold R/Pt oz 93,370 47,841 95 49,780 Dollar basket price per Pt oz sold $/Pt oz 5,681 3,354 69 3,433 Net sales revenue R million 11,385 11,067 3 25,845 from platinum R million 1,726 2,749 (37) 6,486 from palladium R million 5,891 5,712 3 12,712 from rhodium R million 1,982 691 187 1,966 from other PGMs and gold R million 844 554 52 1,469 from base and other metals R million 943 1,361 (31) 3,213 Total operating costs R million (4,943) (4,787) 3 (11,470) EBITDA R million 6,443 6,280 3 14,375 EBITDA margin % 57 57 (0) 56 EBIT R million 5,496 5,302 4 12,466 ROCE % 50 47 3 55 Attributable economic free cash flow R million 3,022 3,807 (21) 9,935 Attributable net cash flow R million 2,863 3,788 (24) 9,715 Costs and unit costs Cash operating costs R million 5,106 4,963 3 9,940 Cash on-mine cost per tonne milled R/tonne 517 489 6 488 Cash operating cost per PGM oz produced R/PGM oz 9,120 8,139 12 8,181 Cash operating cost per PGM oz produced $/PGM oz 547 573 (5) 564 Stay-in-business capital R million 720 843 (15) 2,162 Capitalised waste stripping R million 1,394 1,148 21 2,062 All-in sustaining costs net of metal revenue credits
$ million (113) (67) 69 (223) All-in sustaining costs per platinum ounce sold $/Pt oz (594) (292) 103 (429) Reconciling items for AISC and free cash flow Allocated marketing and market development costs $/Pt oz sold 57 31 85 29
30 JUNE 2020 INTERIM RESULTS 54 Anglo American Platinum Limited Interim Results 2020
for the six months ended 30 June 2020 AMANDELBULT PLATINUM MINE (100% owned) Six months ended Year ended 30 June 30 June 31 December 2020 2019 % change 2019 Production Total development km 10.4 17.3 (40) 36.8 Immediately available ore reserves months 31.6 26.2 20 31.0 Square metres 000 m² 225 379 (41) 804 Tonnes milled 000 tonnes 1,746 3,430 (49) 7,057 Surface tonnes 000 tonnes 221 616 (64) 1,289 Underground tonnes 000 tonnes 1,525 2,814 (46) 5,768 UG2 tonnes milled to total Mer and UG2 % 95.5 93.8 2 94.4 Built-up head grade 4E g/tonne 3.96 3.93 1 4.05 Surface tonnes 4E g/tonne 2.31 2.14 8 2.48 Merensky Underground tonnes 4E g/tonne 5.06 5.24 (3) 5.06 UG2 Underground tonnes 4E g/tonne 4.19 4.32 (3) 4.39 Total mined production (M&C) PGMs 000 ounces 217.8 421.7 (48) 893.3 Platinum 000 ounces 110.9 215.1 (48) 453.6 Palladium 000 ounces 50.8 98.6 (48) 208.9 Rhodium 000 ounces 19.7 37.8 (48) 81.2 Iridium 000 ounces 7.1 13.6 (48) 29.2 Ruthenium 000 ounces 28.2 54.4 (48) 115.7 Gold 000 ounces 1.2 2.2 (46) 4.8 Nickel tonnes 301 602 (50) 1,227 Copper tonnes 131 258 (49) 515 Chrome (100%) tonnes 260,923 424,150 (38) 908,670 Total PGM ounces refined 171.8 382.6 (55) 886.8 Platinum 000 ounces 79.1 196.0 (60) 461.2 Palladium 000 ounces 45.1 96.9 (53) 211.8 Other PGMs+Gold 000 ounces 47.6 89.7 (47) 213.8 Total PGM ounces sold – excluding trading 229.2 376.4 (39) 866.4 Platinum 000 ounces 88.0 194.4 (55) 457.9 Palladium 000 ounces 52.7 101.8 (48) 215.3 Other PGMs+Gold 000 ounces 88.5 80.2 10 193.2 Employees and efficiencies Own employees average 13,928 14,196 (2) 14,232 Contractor employees average 1,492 1,420 5 1,431 PGM ounces produced per employee per annum 28.2 54.0 (48) 57.0
Anglo American Platinum Limited Interim Results 2020 55 Six months ended Year ended 30 June 30 June 31 December 2020 2019 % change 2019 Financials – excluding trading Rand basket price per PGM oz sold R/PGM oz 34,565 18,303 89 20,110 Dollar basket price per PGM oz sold $/PGM oz 2,103 1,283 64 1,387 Rand basket price per Pt oz sold R/Pt oz 89,998 35,450 154 38,052 Dollar basket price per Pt oz sold $/Pt oz 5,476 2,485 120 2,624 Net sales revenue R million 7,923 6,890 15 17,424 from platinum R million 1,246 2,307 (46) 5,729 from palladium R million 1,887 2,031 (7) 4,776 from rhodium R million 3,737 1,458 156 4,358 from other PGMs and gold R million 601 373 61 912 from base and other metals R million 9 120 (93) 283 from chrome R million 443 601 (26) 1,366 Total operating costs R million (5,642) (5,105) 11 (12,293) EBITDA R million 2,281 1,785 28 5,132 EBITDA margin % 29 26 3 30 EBIT R million 1,941 1,413 37 4,311 ROCE % 56 33 24 49 Attributable economic free cash flow R million 1,575 504 212 3,278 Attributable net cash flow R million 1,448 339 328 2,602 Costs and unit costs Cash operating costs R million 4,593 5,253 (13) 10,810 Cash on-mine cost per tonne milled R/tonne 2,376 1,369 74 1,455 Cash operating cost per PGM oz produced1 R/PGM oz 20,626 12,247 68 12,654 Cash operating cost per PGM oz produced1 $/PGM oz 1,238 862 43 873 Stay-in business capital R million 203 274 (26) 680 All-in sustaining costs net of metal revenue credits
$ million (49) 131 (137) 179 All-in sustaining costs per platinum ounce sold $/Pt oz (176) 672 (126) 390 Reconciling items for AISC and free cash flow Allocated marketing and market development costs $/Pt oz sold 55 22 144 23
1 H1 2019 restated to exclude chrome costs.
30 JUNE 2020 INTERIM RESULTS 56 Anglo American Platinum Limited Interim Results 2020
for the six months ended 30 June 2020 MOTOTOLO PLATINUM MINE (100% owned) Six months ended Year ended 30 June 30 June 31 December 2020 2019 % change 2019 Production Total development km 0.5 0.7 (27) 1.8 Immediately available ore reserves months 30.0 26.7 12 26.1 Square metres 000 m² 118 139 (15) 310 Tonnes milled 000 tonnes 782 1,045 (25) 2,320 Built-up head grade 4E g/tonne 3.23 3.19 1 3.23 Total mined production (M&C) PGMs 000 ounces 81.5 107.3 (24) 242.3 Platinum 000 ounces 37.7 49.8 (24) 112.0 Palladium 000 ounces 23.0 30.3 (24) 68.7 Rhodium 000 ounces 6.5 8.6 (25) 19.4 Iridium 000 ounces 2.5 3.3 (23) 7.5 Ruthenium 000 ounces 11.2 14.5 (23) 32.8 Gold 000 ounces 0.6 0.8 (24) 1.9 Nickel tonnes 141 195 (28) 449 Copper tonnes 59 77 (23) 180 Total PGM ounces refined 55.0 106.2 (48) 244.6 Platinum 000 ounces 22.0 50.0 (56) 115.9 Palladium 000 ounces 16.7 33.1 (50) 71.2 Other PGMs+Gold 000 ounces 16.3 23.1 (29) 57.5 Total PGM ounces sold – excluding trading 68.6 108.2 (37) 242.0 Platinum 000 ounces 23.8 50.3 (53) 115.5 Palladium 000 ounces 18.9 35.5 (47) 72.9 Other PGMs+Gold 000 ounces 25.8 22.4 15 53.6 Employees and efficiencies Own employees average 1,500 1,482 1 1,476 Contractor employees average 568 463 23 621 PGM ounces produced per employee per annum 78.9 110.3 (28) 115.5
Anglo American Platinum Limited Interim Results 2020 57 Six months ended Year ended 30 June 30 June 31 December 2020 2019 % change 2019 Financials – excluding trading Rand basket price per PGM oz sold R/PGM oz 31,703 16,907 88 18,621 Dollar basket price per PGM oz sold $/PGM oz 1,929 1,185 63 1,284 Rand basket price per Pt oz sold R/Pt oz 91,145 36,403 150 39,023 Dollar basket price per Pt oz sold $/Pt oz 5,545 2,552 117 2,691 Net sales revenue R million 2,173 1,830 19 4,506 from platinum R million 337 597 (43) 1,444 from palladium R million 679 706 (4) 1,613 from rhodium R million 959 374 156 1,078 from other PGMs and gold R million 188 109 72 267 from base and other metals R million 10 44 (76) 104 Total operating costs R million (1,350) (1,108) 22 (2,549) EBITDA R million 823 722 14 1,956 EBITDA margin % 38 40 (2) 43 EBIT R million 672 516 30 1,572 ROCE % 44 40 4 54 Attributable economic free cash flow R million 483 443 9 1,358 Attributable net cash flow R million 435 443 (2) 1,321 Costs and unit costs Cash operating costs R million 1,043 1,127 (8) 2,361 Cash on-mine cost per tonne milled R/tonne 1,163 940 24 879 Cash operating cost per PGM oz produced R/PGM oz 12,786 10,511 22 9,747 Cash operating cost per PGM oz produced $/PGM oz 767 740 4 672 Stay-in-business capital R million 199 155 29 474 All-in sustaining costs net of metal revenue credits
$ million (18) 12 (247) 8 All-in sustaining costs per platinum ounce sold $/Pt oz (320) 237 (235) 73 Reconciling items for AISC and free cash flow Allocated marketing and market development costs $/Pt oz sold 56 23 138 23
30 JUNE 2020 INTERIM RESULTS 58 Anglo American Platinum Limited Interim Results 2020
for the six months ended 30 June 2020 UNKI PLATINUM MINE (ZIMBABWE) (100% owned) Six months ended Year ended 30 June 30 June 31 December 2020 2019 % change 2019 Production Total development km 1.2 1.0 19 1.9 Immediately available ore reserves months 97.3 230.2 (58) 230.1 Square metres 000 m² 163 155 5 323 Tonnes milled 000 tonnes 894 992 (10) 2,092 Built-up head grade 4E g/tonne 3.51 3.47 1 3.45 Total mined production (M&C) PGMs 000 ounces 80.3 95.8 (16) 201.6 Platinum 000 ounces 35.7 42.4 (16) 89.4 Palladium 000 ounces 31.7 37.9 (16) 79.2 Rhodium 000 ounces 3.6 4.3 (18) 9.0 Iridium 000 ounces 1.5 1.8 (14) 3.8 Ruthenium 000 ounces 3.4 4.1 (16) 8.8 Gold 000 ounces 4.4 5.3 (16) 11.4 Nickel tonnes 1,055 1,330 (21) 2,777 Copper tonnes 914 1,110 (18) 2,317 Total PGM ounces refined 49.8 91.4 (45) 206.0 Platinum 000 ounces 18.4 39.9 (54) 92.0 Palladium 000 ounces 20.1 38.0 (47) 81.3 Other PGMs+Gold 000 ounces 11.3 13.5 (16) 32.7 Total PGM ounces sold – excluding trading 56.9 92.1 (38) 204.7 Platinum 000 ounces 20.0 39.7 (50) 91.6 Palladium 000 ounces 22.5 39.9 (44) 82.7 Other PGMs+Gold 000 ounces 14.3 12.5 15 30.4 Employees and efficiencies Own employees average 1,133 1,113 2 1,120 PGM ounces produced per employee per annum 113.5 172.2 (34) 180.1
Anglo American Platinum Limited Interim Results 2020 59 Six months ended Year ended 30 June 30 June 31 December 2020 2019 % change 2019 Financials – excluding trading Rand basket price per PGM oz sold R/PGM oz 34,766 19,646 77 21,511 Dollar basket price per PGM oz sold $/PGM oz 2,115 1,377 54 1,483 Rand basket price per Pt oz sold R/Pt oz 98,813 45,646 116 48,083 Dollar basket price per Pt oz sold $/Pt oz 6,012 3,200 88 3,316 Net sales revenue R million 1,977 1,810 9 4,403 from platinum R million 283 471 (40) 1,145 from palladium R million 807 796 1 1,830 from rhodium R million 511 169 202 502 from other PGMs and gold R million 203 123 65 330 from base and other metals R million 173 251 (31) 596 Total operating costs R million (1,415) (1,322) 7 (2,882) EBITDA R million 562 488 15 1,520 EBITDA margin % 28 27 2 35 EBIT R million 300 285 6 1,076 ROCE % 14 12 1 24 Attributable economic free cash flow R million 129 229 (45) 1,064 Attributable net cash flow R million 97 210 (55) 1,011 Costs and unit costs Cash operating costs R million 1,107 1,086 2 2,364 Cash on-mine cost per tonne milled R/tonne 995 872 14 893 Cash operating cost per PGM oz produced R/PGM oz 13,782 11,327 22 11,721 Cash operating cost per PGM oz produced $/PGM oz 827 798 4 808 Stay-in-business capital R million 54 103 (48) 313 All-in sustaining costs net of metal revenue credits
$ million 1 18 (93) 8 All-in sustaining costs per platinum ounce sold $/Pt oz 525 456 19 88 Reconciling items for AISC and free cash flow Allocated marketing and market development costs $/Pt oz sold 60 29 105 28
30 JUNE 2020 INTERIM RESULTS 60 Anglo American Platinum Limited Interim Results 2020
for the six months ended 30 June 2020 MODIKWA PLATINUM MINE (50:50 joint venture with ARM Mining Consortium Limited) (All statistics represent attributable contribution for mined production i.e. excluding POC) Six months ended Year ended 30 June 30 June 31 December 2020 2019 % change 2019 Production Total development km 2.4 2.6 (7) 5.9 Immediately available ore reserves months 19.6 13.4 47 13.5 Square metres 000 m² 56 77 (27) 174 Tonnes milled 000 tonnes 380 526 (28) 1,118 Built-up head grade 4E g/tonne 4.11 4.02 2 4.04 Total mined production (M&C) PGMs 000 ounces 51.8 67.6 (23) 145.5 Platinum 000 ounces 20.3 26.9 (25) 57.1 Palladium 000 ounces 19.6 25.2 (22) 54.5 Rhodium 000 ounces 4.1 5.4 (23) 11.6 Iridium 000 ounces 1.4 1.8 (23) 4.0 Ruthenium 000 ounces 5.9 7.7 (24) 16.9 Gold 000 ounces 0.5 0.7 (25) 1.4 Nickel tonnes 98 120 (18) 272 Copper tonnes 61 74 (18) 168 Total PGM ounces refined 35.0 68.5 (49) 151.9 Platinum 000 ounces 11.5 27.2 (58) 61.3 Palladium 000 ounces 13.6 27.9 (51) 58.6 Other PGMs+Gold 000 ounces 9.9 13.3 (26) 32.0 Total PGM ounces sold – excluding trading 41.8 70.8 (41) 152.9 Platinum 000 ounces 12.4 27.4 (55) 61.4 Palladium 000 ounces 15.1 30.0 (49) 60.3 Other PGMs+Gold 000 ounces 14.3 13.4 6 31.2 Employees and efficiencies Own employees average 2,018 2,046 (1) 2,054 Contractor employees average 309 193 60 187 PGM ounces produced per employee per annum 44.5 60.4 (26) 65.0
Anglo American Platinum Limited Interim Results 2020 61 Six months ended Year ended 30 June 30 June 31 December 2020 2019 % change 2019 Financials – excluding trading Rand basket price per PGM oz sold R/PGM oz 33,534 17,722 89 19,545 Dollar basket price per PGM oz sold $/PGM oz 2,040 1,242 64 1,348 Rand basket price per Pt oz sold R/Pt oz 113,150 45,755 147 48,646 Dollar basket price per Pt oz sold $/Pt oz 6,884 3,208 115 3,355 Net sales revenue R million 1,402 1,255 12 2,988 from platinum R million 175 326 (46) 767 from palladium R million 543 597 (9) 1,330 from rhodium R million 576 239 141 670 from other PGMs and gold R million 102 65 59 155 from base and other metals R million 5 28 (81) 66 Total operating costs R million (708) (852) (17) (1,908) EBITDA R million 695 403 72 1,080 EBITDA margin % 50 32 17 36 EBIT R million 606 320 89 907 ROCE % 85 40 45 61 Attributable economic free cash flow R million 429 321 33 869 Attributable net cash flow R million 414 309 34 832 Costs and unit costs Cash operating costs R million 793 817 (3) 1,781 Cash on-mine cost per tonne milled R/tonne 1,904 1,409 35 1,457 Cash operating cost per PGM oz produced R/PGM oz 15,309 12,085 27 12,239 Cash operating cost per PGM oz produced $/PGM oz 919 851 8 844 Stay-in-business capital R million 43 47 (8) 175 All-in sustaining costs net of metal revenue credits
$ million (21) 1 (1,960) (5) All-in sustaining costs per platinum ounce sold $/Pt oz (1,179) 39 (3,098) (89) Reconciling items for AISC and free cash flow Allocated marketing and market development costs $/Pt oz sold 69 29 135 29
30 JUNE 2020 INTERIM RESULTS 62 Anglo American Platinum Limited Interim Results 2020
for the six months ended 30 June 2020 KROONDAL PLATINUM MINE (50:50 pooling and sharing agreement with Sibanye – Stillwater) (All statistics represent attributable contribution for mined production i.e. excluding POC) Six months ended Year ended 30 June 30 June 31 December 2020 2019 % change 2019 Production Total development km 1.8 2.9 (39) 6.1 Square metres 000 m² 147 241 (39) 496 Tonnes milled 000 tonnes 811 1,267 (36) 2,636 Built-up head grade 4E g/tonne 3.66 3.59 2 3.60 Total mined production (M&C) PGMs 000 ounces 101.6 151.7 (33) 313.5 Platinum 000 ounces 47.7 72.2 (34) 148.6 Palladium 000 ounces 25.4 38.4 (34) 80.0 Rhodium 000 ounces 8.8 13.6 (35) 28.1 Iridium 000 ounces 4.6 5.0 (8) 10.4 Ruthenium 000 ounces 14.5 21.9 (34) 45.1 Gold 000 ounces 0.6 0.6 1.3 Nickel tonnes 113 132 (15) 278 Copper tonnes 53 61 (13) 126 Total PGM ounces refined 63.9 142.7 (55) 319.5 Platinum 000 ounces 26.1 68.8 (62) 156.5 Palladium 000 ounces 17.4 39.5 (56) 83.8 Other PGMs+Gold 000 ounces 20.4 34.4 (40) 79.2 Total PGM ounces sold – excluding trading 82.0 141.2 (42) 315.0 Platinum 000 ounces 28.7 68.5 (58) 156.1 Palladium 000 ounces 20.1 41.6 (52) 85.6 Other PGMs+Gold 000 ounces 33.2 31.1 7 73.3 Employees and efficiencies Own employees average 2,703 2,760 (2) 2,745 Contractor employees average 1,082 1,107 (2) 1,097 PGM ounces produced per employee per annum 53.7 78.5 (32) 81.6
Anglo American Platinum Limited Interim Results 2020 63 Six months ended Year ended 30 June 30 June 31 December 2020 2019 % change 2019 Financials – excluding trading Rand basket price per PGM oz sold R/PGM oz 36,077 16,771 115 18,486 Dollar basket price per PGM oz sold $/PGM oz 2,195 1,176 87 1,275 Rand basket price per Pt oz sold R/Pt oz 102,878 34,573 198 37,319 Dollar basket price per Pt oz sold $/Pt oz 6,259 2,424 158 2,573 Net sales revenue R million 2,957 2,368 25 5,824 from platinum R million 454 813 (44) 1,950 from palladium R million 830 831 (0) 1,893 from rhodium R million 1,429 548 161 1,568 from other PGMs and gold R million 245 146 69 342 from base and other metals R million (2) 30 (105) 71 Total operating costs R million (1,486) (1,401) 6 (3,325) EBITDA R million 1,471 967 52 2,499 EBITDA margin % 50 41 9 43 EBIT R million 1,330 825 61 2,210 ROCE % 198 108 90 151 Attributable economic free cash flow R million 1,211 690 75 2,174 Attributable net cash flow R million 1,210 690 75 2,173 Costs and unit costs Cash operating costs R million 1,283 1,394 (8) 3,029 Cash on-mine cost per tonne milled R/tonne 1,472 1,016 45 1,065 Cash operating cost per PGM oz produced R/PGM oz 13,731 9,187 49 9,663 Cash operating cost per PGM oz produced $/PGM oz 824 647 27 666 Stay-in-business capital R million 80 96 (17) 239 All-in sustaining costs net of metal revenue credits
$ million (56) 10 (656) (12) All-in sustaining costs per platinum ounce sold $/Pt oz (1,643) 147 (1,219) (77) Reconciling items for AISC and free cash flow Allocated marketing and market development costs $/Pt oz sold 63 22 182 22
30 JUNE 2020 INTERIM RESULTS 64 Anglo American Platinum Limited Interim Results 2020
for the six months ended 30 June 2020 ANALYSIS OF GROUP CAPITAL EXPENDITURE Six months ended Six months ended Year ended 30 June 2020 30 June 2019 31 December 2019 Stay-in- Stay-in- Stay-in- R millions business Projects Total business Projects Total business Projects Total Operations Mogalakwena Mine 1,878 110 1,988 1,677 19 1,696 3,515 180 3,695 Amandebult Mine 158 132 290 173 193 366 387 785 1,172 Mototolo Mine 180 47 227 124 — 124 394 39 433 Unki Mine 31 23 54 71 7 78 230 28 258 Modikwa Mine 34 52 86 33 23 56 144 71 215 Kroondal Mine 70 — 70 78 — 78 199 — 199 Mining and retreatment 2,351 364 2,715 2,156 242 2,398 4,869 1,103 5,972 Polokwane Smelter 185 — 185 407 — 407 834 9 843 Waterval Smelter 110 — 110 154 — 154 314 10 324 Acid Converting Plant (ACP) 92 1 93 25 — 25 89 11 100 Mortimer Smelter 11 1 12 11 — 11 41 6 47 Unki Smelter — 1 1 — 11 11 4 16 20 Rustenburg Base Metals Refiners 64 80 144 97 — 97 240 93 333 Precious Metals Refiners 21 — 21 37 — 37 79 — 79 Total smelting and refining 483 83 566 731 11 742 1,601 145 1,746 Other (32) (1) (33) 61 — 61 349 18 367 Total capital expenditure 2,802 446 3,248 2,948 253 3,201 6,819 1,266 8,085 Capitalised interest — — 89 — — 139 — — 216 Total capitalised costs 2,802 446 3,337 2,948 253 3,340 6,819 1,266 8,301
Stay-in-business capital for Mogalakwena includes R1.4 billion for waste stripping for the six months to June 2020 (R1.1 billion for the six months to June 2019 and R2.1 billion for the year ended 31 December 2019).
Anglo American Platinum Limited Interim Results 2020 65
for the six months ended 30 June 2020
2020 Interim Results Presentation
BUILDING THE BUSINESS FOR THE FUTURE, BEYOND CURRENT HEADWINDS
30 JUNE 2020 INTERIM RESULTS 66 Anglo American Platinum Limited Interim Results 2020
Interim Results July 2020
CAUTIONARY STATEMENT
2
Disclaimer: This presentation has been prepared by Anglo American Platinum Limited (“Anglo American Platinum”) and comprises the written materials/slides for a presentation concerning Anglo American Platinum. By attending this presentation and/or reviewing the slides you agree to be bound by the following conditions. This presentation is for information purposes only and does not constitute an offer to sell or the solicitation of an offer to buy shares in Anglo American Platinum. Further, it does not constitute a recommendation by Anglo American Platinum or any other party to sell or buy shares in Anglo American Platinum or any other
to Anglo American Platinum or persons acting on their behalf are qualified in their entirety by these cautionary statements. Forward-Looking Statements This presentation includes forward-looking statements. All statements, other than statements of historical facts included in this presentation, including, without limitation, those regarding Anglo American Platinum’s financial position, business, acquisition and divestment strategy, plans and objectives of management for future
Anglo American Platinum’s products, production forecasts and, reserve and resource positions), are forward-looking statements. By their nature, such forward-looking statements involve known and unknown risks, uncertainties and other factors which may cause the actual results, performance or achievements of Anglo American Platinum, or industry results, to be materially different from any future results, performance or achievements expressed or implied by such forward-looking statements. Such forward-looking statements are based on numerous assumptions regarding Anglo American Platinum’s present and future business strategies and the environment in which Anglo American Platinum will operate in the future. Important factors that could cause Anglo American Platinum’s actual results, performance or achievements to differ materially from those in the forward-looking statements include, among others, levels of actual production during any period, levels of global demand and commodity market prices, mineral resource exploration and development capabilities, recovery rates and other operational capabilities, the availability of mining and processing equipment, the ability to produce and transport products profitably, the impact of foreign currency exchange rates on market prices and operating costs, the availability of sufficient credit, the effects of inflation, political uncertainty and economic conditions in relevant areas of the world, the actions of competitors, activities by governmental authorities such as changes in taxation or safety, health, environmental or other types of regulations in the countries where Anglo American Platinum operates, conflicts over land and resource ownership rights and such other risk factors identified in Anglo American Platinum’s most recent Integrated Report. Forward-looking statements should, therefore, be construed in light of such risk factors and undue reliance should not be placed on forward-looking statements. These forward-looking statements speak
Anglo American Platinum expressly disclaims any obligation or undertaking (except as required by applicable law, the Listings Requirements of the securities exchange of the JSE Limited in South Africa and any other applicable regulations) to release publicly any updates or revisions to any forward-looking statement contained herein to reflect any change in Anglo American Platinum’s expectations with regard thereto or any change in events, conditions
Nothing in this presentation should be interpreted to mean that future earnings per share of Anglo American Platinum will necessarily match or exceed its historical published earnings per share. Certain statistical and other information about Anglo American Platinum included in this presentation is sourced from publicly available third party sources. As such it presents the views of those third parties, but may not necessarily correspond to the views held by Anglo American Platinum. No Investment Advice This presentation has been prepared without reference to your particular investment objectives, financial situation, taxation position and particular needs. It is important that you view this presentation in its entirety. If you are in any doubt in relation to these matters, you should consult your stockbroker, bank manager, solicitor, accountant, taxation adviser or other independent financial adviser (where applicable, as authorised in South Africa, under the Financial Advisory and Intermediary Services Act 37
Alternative performance measures Throughout this presentation a range of financial and non-financial measures are used to assess our performance, including a number
financial reporting standards (IFRS), which are termed ‘alternative performance measures’ (APMs). Management uses these measures to monitor Anglo American Platinum’s financial performance alongside IFRS measures because they help illustrate the underlying financial performance and position of Anglo American Platinum. These APMs should be considered in addition to, and not as a substitute for, or as superior to, measures of financial performance, financial position or cash flows reported in accordance with IFRS. APMs are not uniformly defined by all companies, including those in Anglo American Platinum’s industry. Accordingly, it may not be comparable with similarly titled measures and disclosures by other companies.
Anglo American Platinum Limited Interim Results 2020 67
Interim Results July 2020
2020 INTERIM RESULTS AGENDA
3
. Supporting stakeholders Natascha Viljoen Operational performance Natascha Viljoen . Financials Craig Miller . PGM market review Natascha Viljoen 1 Positioning the business for the future Natascha Viljoen . Outlook and guidance Natascha Viljoen
30 JUNE 2020 INTERIM RESULTS 68 Anglo American Platinum Limited Interim Results 2020
Interim Results July 2020
Fatalities
at managed operations
Protecting livelihoods
in unproductive labour costs to support employees
Investment in communities
USD basket price up
rand basket price up 80% per PGM ounce sold
Net cash position
after paying R11.1 billion in dividends
H1 2020 dividend
R10.23 per share
RESILIENT BUSINESS DESPITE HEADWINDS
4
Health and well-being Safety performance Community support - Covid-19 Strong balance sheet Robust PGM fundamentals Industry leading returns
Anglo American Platinum Limited Interim Results 2020 69
5
30 JUNE 2020 INTERIM RESULTS 70 Anglo American Platinum Limited Interim Results 2020
Interim Results July 2020
ELIMINATION OF FATALITIES REMAINS THE FOCUS
6
6 2 4.52 3.00 2.50 2.24
1.5 2 2.5 3 3.5 4 4.5 5 1 2 3 4 5 6 7 8 9
2017 2018 2019 H1 2020 zero
Fatalities in H1 2020
at own managed operations
Fatality free days
at own managed operations since 19 October 2018
Improved safety indicators
TRCFR(1) down 50% since 2017
Fatalities & total recordable case injury frequency rate (TRCFR)(1)
zero
Anglo American Platinum Limited Interim Results 2020 71
Interim Results July 2020
DEVELOPING OUR COVID-19 RESPONSE
7
SUPPORT WHERE IT IS NEEDED MOST
Operating protocols Physical & mental health Employee and community support Workforce & community testing Safe and healthy
Education, healthcare and livelihoods
Recover Respond Prevent
30 JUNE 2020 INTERIM RESULTS 72 Anglo American Platinum Limited Interim Results 2020
Interim Results July 2020
SUPPORTING COMMUNITIES THROUGH COVID-19
8
food parcels delivered
face masks donated
clinics supported
provided access to water
reach – through education awareness campaigns
Anglo American Platinum Limited Interim Results 2020 73
9
30 JUNE 2020 INTERIM RESULTS 74 Anglo American Platinum Limited Interim Results 2020
Interim Results July 2020
PGM production decreased
Impacted by
Due to Covid-19
PGM production decreased
Including tolling decreased 46%
Impacted by
AISC per platinum ounce sold
against a realised platinum price of $857
CHALLENGING H1 | COVID-19 & ACP HEADWINDS
H1 2020 production Operational performance Lost PGM production H1 2020 refined production Refined production (2) All-in-sustaining cost (3)
10
Anglo American Platinum Limited Interim Results 2020 75
Interim Results July 2020
307 282 303 278
H1 2019 H1 2020 Q1 Q2 Covid-19 losses
MOGALAKWENA | OPERATING AT 100%
11
PGM production decrease
impact from COVID-19
Production level
at the end of June
All-in-sustaining cost
per platinum ounce sold
Total PGM Production (’000 ounces) Impact of COVID-19 (‘000 ounces)
258 239 281 258 70 63
H1 2019 H1 2020 Platinum Palladium Other PGMs & Gold
560
â8%
610
COVID-19 losses
30 JUNE 2020 INTERIM RESULTS 76 Anglo American Platinum Limited Interim Results 2020
Interim Results July 2020
AMANDELBULT | OPERATING AT 50%, RAMP UP TO 85%
12
PGM production decrease
impact from COVID-19
Production level
at the end of June, increasing to 85% by the end of 2020
All-in-sustaining cost
per platinum ounce sold 215 111 99 51 108 56
H1 2019 H1 2020 Platinum Palladium Other PGMs & Gold
50% 75% 85%
June 2020 Q3 2020 Q4 2020
422
COVID-19 losses
â48%
218
Total PGM Production (’000 ounces) 2020 Ramp-up schedule (% vs 2019)
Anglo American Platinum Limited Interim Results 2020 77
Interim Results July 2020
58 61 50 20
H1 2019 H1 2020 Q1 Q2 Covid-19 losses
MOTOTOLO | OPERATING AT 90%
13
PGM production decrease
impact from COVID-19
Production level
at the end of June, increasing to 100% in July
All-in-sustaining cost
per platinum ounce sold
Total PGM Production (’000 ounces) Impact of COVID-19 (‘000 ounces)
50 38 30 23 27 21
H1 2019 H1 2020
Platinum Palladium Other PGMs & Gold
82
â24%
107
COVID-19 losses
30 JUNE 2020 INTERIM RESULTS 78 Anglo American Platinum Limited Interim Results 2020
Interim Results July 2020
43 49 53 31
H1 2019 H1 2020 Q1 Q2 Covid-19 losses
UNKI | OPERATING AT 100%
14
PGM production decrease
impact from COVID-19
Production level
at the end of June
All-in-sustaining cost
per platinum ounce sold
Total PGM Production (’000 ounces) Impact of COVID-19 (‘000 ounces)
42 36 38 32 16 13
H1 2019 H1 2020
Platinum Palladium Other PGMs & Gold
80
â16%
96
COVID-19 losses
Anglo American Platinum Limited Interim Results 2020 79
Interim Results July 2020
ACP PHASE B UNIT REPAIRS & SAFE RAMP-UP COMPLETE
15
Cross section of the Anglo American Platinum Converter Plant
Coal dust explosion during lance ignition (ACP Phase A explosion) High pressure coolers freeboard section (ACP Phase B water leak) Low pressure ‘waffle’ coolers (ACP Phase B water leak)
Increased monitoring Increased measurement Greater automation
No uncontrolled events
30 JUNE 2020 INTERIM RESULTS 80 Anglo American Platinum Limited Interim Results 2020
Interim Results July 2020 2 004 1 019 H1 2019 H1 2020
REFINED PRODUCTION IMPACTED BY ACP REPAIRS
16
Work-in-progress build at H1
Refined production(2) decrease
Including tolling down 46%
Sales volumes decrease
due to lower refined production, supplemented by drawdown in refined inventory
Build up in WIP inventories (3E ounces) Refined PGM production (PGM ounces)
c.500
Build due to power disruptions and ACP repairs
875 75 1 300 (800)
Opening WIP M&C Refined H1 WIP
1,450 950
Build up in WIP from 2019
Anglo American Platinum Limited Interim Results 2020 81
30 JUNE 2020 INTERIM RESULTS 82 Anglo American Platinum Limited Interim Results 2020
Interim Results July 2020
FINANCIAL PERFORMANCE
18
Headline earnings per share (R/share)
up 6% EBITDA Headline earnings
up from 45% ROCE (%) Net cash
dividend declared for H1 2020
H1 2019 H1 2020
28.15 26.27
Anglo American Platinum Limited Interim Results 2020 83
Interim Results July 2020
EBITDA IMPACTED BY OPERATIONAL HEADWINDS
19
EBITDA (R billion) H1 2020 vs. H1 2019
108
3.5 0.1 0.6
H1 2019
3.5 6.0
Costs Price
2.6
Currency
(0.9)
Inflation + Royalties
(11.2)
Operational headwinds
(0.3) (1.2) 2.0
H1 2020
12.4 9.6 23.7 13.1
Rh Pd Covid-19 costs Non-productive labour Other
30 JUNE 2020 INTERIM RESULTS 84 Anglo American Platinum Limited Interim Results 2020
Interim Results July 2020
UNIT COST IMPACTED BY LOWER PRODUCTION
20
Unit cost per PGM ounce produced (Rand per PGM ounce) Cost savings
All-in sustaining unit cost
per platinum ounce sold against an achieved price of $857
2020 unit cost guidance per PGM ounce
H2 guidance: R11,500- R12,000 2,008 CPI/Fx H1 2019 Lower production (1,024) Costs 1,057 Non- productive labour H1 2020 9,951 11,498 12,555 +16%
~Fx movement relates to Unki cost
563
Anglo American Platinum Limited Interim Results 2020 85
Interim Results July 2020
WORKING CAPITAL IMPACTED BY WORK IN PROGRESS BUILD
Working capital movement (R billion)
(0.5)
Inventory
8.6
Dec-19
2.1
Trade creditors
(6.7)
Trade Debtors Customer prepayment H1 2020
3.1 6.6
Working capital days
WIP balance
2019: R14.3bn
Customer prepayment
2019: R9.4bn 21
30 JUNE 2020 INTERIM RESULTS 86 Anglo American Platinum Limited Interim Results 2020
Interim Results July 2020
CAPITAL GUIDANCE LOWERED BUT ASSET INTEGRITY MAINTAINED
Capital expenditure (Rand billion) 2.1
0.3 1.8 H1 2019 1.4 0.4 H1 2020 2020 guidance
1.9 5.7 – 6.5
4.1 – 4.5
SIB Projects & Breakthrough (P101)
1.6 – 2.0
SIB capital expenditure
Capitalised waste stripping
FY 2020 Capex deferments
investment in SO2 abatement & Mogalakwena HME 22
Anglo American Platinum Limited Interim Results 2020 87
Interim Results July 2020
Net cash (Rand billion) 11.3 6.0
H1 2020 H1 2019 2019
17.3
after a dividend payment of R11.1bn
CASH FLOW IMPACTED BY WORKING CAPITAL BUILD
Cash utilised
Liquidity headroom
excluding customer prepayment
H1 2020 dividend declared
R10.23 /share
23
30 JUNE 2020 INTERIM RESULTS 88 Anglo American Platinum Limited Interim Results 2020
Interim Results July 2020
PALLADIUM & RHODIUM PROPEL BASKET PRICE HIGHER
Indexed market prices log scale (2 Jan 2019 = 100)
50 100 200 400 800 Jan 19 Apr 19 Jul 19 Oct 19 Jan 20 Apr 20 Pt Pd Rh ZAR basket USD Basket
USD basket price increase
realised prices H1 2020 average year-on-year
Rand weakened against USD
Rand basket price increase
realised prices H1 2020 average year-on-year
25
Anglo American Platinum Limited Interim Results 2020 89
Interim Results July 2020
2 3 4 5 6 7 8 Jan Feb Mar Apr May Jun Jul Aug Sep Oct Nov Dec
2019 2020 Sales return to 2019 levels FY 2020 = down 14% yoy Sale remain at current levels FY 2020 = down 22% yoy
Global light duty automotive sales (million vehicles per month)(5)
COVID IMPACTED AUTO SALES | BUT NOW RECOVERING
Automotive demand
Global LDV(4) sales down in H1
H1 2019 year on year
2020 forecast LDV(4) sales decline
Forecasts
26
30 JUNE 2020 INTERIM RESULTS 90 Anglo American Platinum Limited Interim Results 2020
Interim Results July 2020
LONG-TERM AUTOMOTIVE PGM DEMAND ROBUST
ICE(7)-based vehicle output increase
between 2019 and 2027
3E gross PGM auto demand
due to higher loadings as emissions legislation tightens
Fuel cell electric vehicle demand long term
as market share increases and costs fall
2019 2020 2021 2022 2023 2024 2025 2026 2027
Diesel
5 m
89 million 104 million Gasoline
22 m Pd Rh 12 m
Hybrid Electric Vehicles (contain ICE, require PGM)
67 m 61 m Pt Rh Pd 15 m 2 m 9 m
Battery Electric Vehicles (no PGMs)
10 k Pt 65 k Pt
Fuel Cell Electric Vehicles
PGMs in powertrain
Global light duty automotive production outlook (million vehicles)(6)
27
Anglo American Platinum Limited Interim Results 2020 91
Interim Results July 2020
OTHER DEMAND | POSITIVE STORY POST-COVID
Industrial demand Investment demand
Medium-term 3E demand outlook
education Medium-term 3E demand outlook
end-uses
“hydrogen economy” 2020 3E demand outlook
2020 demand 3E outlook
Jewellery demand
Medium-term 3E demand outlook
Changing consumer preferences
2020 3E demand outlook
3E PGM demand
platinum demand
3E PGM demand
28
30 JUNE 2020 INTERIM RESULTS 92 Anglo American Platinum Limited Interim Results 2020
Interim Results July 2020 187 225 (265) (754) (208) (950) 28 50 (26) 2017 2018 2019 2020f 2021f
Pd Rh Pt
3E METALS REMAIN IN FUNDAMENTAL DEFICIT
Market balance 2017- 2021 forecast (‘000 ounces)(8)
2020 palladium outlook
despite lower automotive demand
2020 platinum outlook
due to lower mine production
2020 rhodium outlook
29
Anglo American Platinum Limited Interim Results 2020 93
30 JUNE 2020 INTERIM RESULTS 94 Anglo American Platinum Limited Interim Results 2020
Interim Results July 2020
Developing new applications for PGMs Growing demand – jewellery & investment Supporting development of hydrogen economy Fast payback projects Mogalakwena expansion options Mototolo / Der Brochen life extension or expansion Achieve and beat world best practice - P101 Deployment of FutureSmartTM technology & innovation Digitalisation Modernisation and mechanisation of Amandelbult Development of FutureSmartTM technology innovation Bulk-ore sorting Coarse particle rejection Dry-stacking
BUILDING BLOCKS IN PLACE
Market development Breakthrough technology Operational efficiency Projects & growth options
Delivering industry-leading returns for shareholders and a sustainable future for all stakeholders
n tion De
Environment, Social & Governance and our People
31
Anglo American Platinum Limited Interim Results 2020 95
Interim Results July 2020
SHAPING THE FUTURE OF MOGALAKWENA
Shaping the mine for the future
Create trusting relationships and valued partnerships Optimise mine plan and
Optimise resource development including underground opportunities Utilise downstream processing to maximise value Design and build the concentrator of the future Develop and deploy technology
32
30 JUNE 2020 INTERIM RESULTS 96 Anglo American Platinum Limited Interim Results 2020
Interim Results July 2020
INVESTMENT INDUSTRIAL
LEADING THE PLATINUM INDUSTRY’S DEMAND CREATION EFFORTS
Developing the world’s largest fuel-cell mining truck JEWELLERY ‘Green hydrogen’ through electrolysis Mogalakwena solar PV plant Hydrogen powered fuel-cell truck fleet Green Electricity Hydrogen Developing the world’s largest fuel cell mining truck ‘Green hydrogen’ through electrolysis Mogalakwena solar PV plant Hydrogen powered cell truck fleet Green Electricity Hydrogen
33
Anglo American Platinum Limited Interim Results 2020 97
34
30 JUNE 2020 INTERIM RESULTS 98 Anglo American Platinum Limited Interim Results 2020
Interim Results July 2020
2020 GUIDANCE | COVID-19 HEADWINDS REMAIN
Pt: 1.45 – 1.65 Pd: 1.00 – 1.15 Other: 0.65 – 0.90
Excluding toll production
Pt: 1.45 – 1.65 Pd: 1.00 – 1.15 Other: 0.65 – 0.90
Excluding toll production
Pt: 1.45 – 1.65 Pd: 1.00 – 1.15 Other: 0.65 – 0.90
Excluding toll production
Refined production (million ounces) Production M&C (million ounces) Sales volumes (million ounces) Capitalised waste stripping Capital expenditure Unit cost per PGM ounce
35
Anglo American Platinum Limited Interim Results 2020 99
Interim Results July 2020
TO CONCLUDE…
…Stronger H2 expected but significant headwinds still exist Resilient business through significant headwinds Zero fatalities and best ever safety performance ESG strategy supporting stakeholders during COVID-19 pandemic Interim dividend declared – base dividend of 40% pay-out ratio Continuing to position the business for the future
Strong balance sheet – c.45% release of WIP in H2 2020
36
30 JUNE 2020 INTERIM RESULTS 100 Anglo American Platinum Limited Interim Results 2020
Anglo American Platinum Limited Interim Results 2020 101
Interim Results July 2020
OPERATIONAL EFFICIENCY | BENCHMARK & BEYOND (P101)
38
control
strip ratio
fragmentation
double side loading
hang time
increased
reef technology
enhancements
Rope shovel efficiency improvement Double benching at Mogalakwena Modernisation at Amandelbult
30 JUNE 2020 INTERIM RESULTS 102 Anglo American Platinum Limited Interim Results 2020
Interim Results July 2020
storage
dewatering at tailings facility
Benefits
safe
85%
purposing
North Concentrator
the primary flotation section Benefits
increased throughput
processing allowing waste material to be removed Benefits
rejecting waste early
BREAKTHROUGH | FUTURESMART MININGTM TECHNOLOGY
39
Coarse particle rejection – Q1 2021 Bulk-ore sorter – trial underway Hydraulic Dry Stacking – H2 2021
Anglo American Platinum Limited Interim Results 2020 103
Interim Results July 2020
FAST PAYBACK PROJECTS - HIGH RETURN, HIGH MARGIN
Base Metal Refinery - copper debottlenecking Amandelbult modernisation
Disciplined capital allocation framework drives project selection
Projects : Commission:
Modikwa chrome recovery plant R0.2bn +288ktpa H1 2021 ~2 year payback >50%IRR RBMR copper debottlenecking R0.7bn
~2 year payback >35%IRR Unki debottlenecking R0.7bn +31ktpm H2 2021 ~3 year payback >35%IRR Amandelbult modernisation R1.3bn
~3 year payback >60%IRR Tumela 15E R1.1bn +70ktpm H2 2022 ~5 year payback >20%IRR
A p p r
e d A p p r
e d A p p r
e d A p p r
e d A p p r
e d
Copper plates at the Rustenburg Base Metal Refinery (RBMR) Winder upgrades increase hoisting capacity from 160ktpm to 230ktpm
40
30 JUNE 2020 INTERIM RESULTS 104 Anglo American Platinum Limited Interim Results 2020
Interim Results July 2020
PROJECT STUDIES ON VALUE ACCRETIVE GROWTH OPTIONS
Mogalakwena expansion Der Brochen / Mototolo replacement and growth
‒ Construction of third concentrator with breakthrough technology ‒ Upgrading and debottlenecking existing concentrators ‒ Concurrently studying underground mining options
production
Lebowa shaft
‒ Breakthrough technology to increase throughput and improve grade into the concentrator ‒ Potential to increase production by c.33% Project studies for value-accretive growth underway
Project studies: Status
Der Brochen / Mototolo - replacement Replacement of Mototolo Mogalakwena expansion Significant expansion potential - studies under way Der Brochen / Mototolo – replacement & expansion Expansion potential - studies under way
F e a s i b i l i t y P r e
e a s i b i l i t y B F e a s i b i l i t y
41
Anglo American Platinum Limited Interim Results 2020 105
Interim Results July 2020
AUTOMOTIVE PGM DEMAND SUPPORTED BY HIGHER LOADINGS PER VEHICLE
Historic and forecast 3E light duty PGM loadings(9)
Pt Pd Rh
LDV gasoline loadings increase by
between 2015 and 2025 due to tighter emissions legislation in China and Europe
LDV diesel loadings increase by
between 2015 and 2025 from already high levels
Heavy duty diesel loadings increase by
Between 2015 and 2025 2015 2020 2025
Light duty gasoline vehicles
Rh Pt Pd
2015 2020 2025
Light duty diesel vehicles
2015 2020 2025
Heavy duty diesel vehicles
42
30 JUNE 2020 INTERIM RESULTS 106 Anglo American Platinum Limited Interim Results 2020
Interim Results July 2020
100 150 200 250 300 350
Q3 14 Q4 14 Q1 15 Q2 15 Q3 15 Q4 15 Q1 16 Q2 16 Q3 16 Q4 16 Q1 17 Q2 17 Q3 17 Q4 17 Q1 18 Q2 18 Q3 18 Q4 18 Q1 19 Q2 19 Q3 19 Q4 19 Q1 20
0.0 1.0 2.0 3.0 4.0
2015 2015 2015 2016 2016 2016 2017 2017 2017 2018 2018 2018 2019 2019 2019 2020 2020
Moz Platinum Palladium
PLATINUM PHYSICAL INVESTMENT FIRM
Platinum bar and coin gross demand (‘000 ounces per quarter)(10)
Platinum bar/coin demand
in Q1
Total Platinum ETF liquidation
withdrawn in H1 2020
Palladium ETF holding reduced to
ETF holdings (million ounces)(11)
43
Anglo American Platinum Limited Interim Results 2020 107
Interim Results July 2020
All Chinese heavy-duty trucks sold by
Will need platinum-based catalysts, with many manufacturers already implementing standard
Platinum loadings per vehicle
by 2022 than 2019
Demand supported by tighter
CHINESE TRUCK DEMAND A PLATINUM GROWTH AREA
50 100 150 200 250 300 2020 2021 2022 2023
Forecast platinum demand in Chinese heavy-duty trucks (‘000 ounces)(12)
44
30 JUNE 2020 INTERIM RESULTS 108 Anglo American Platinum Limited Interim Results 2020
Interim Results July 2020
Platinum Palladium & Rhodium Other PGMs
Substitution into gasoline autocatalysts Commercial vehicle demand grows Stricter emissions legislation Jewellery demand recovers Hydrogen economy Electrification through fuel cell vehicles Global ‘middle class’ increasing Industrial applications growing Stricter emissions legislation Decarbonisation through hybrid vehicles Chemical demand growing New applications Electronic demand increases Clean chemistry Higher technology future Hydrogen generation
Short to medium term… …longer term
OVERALL OUTLOOK FOR 3E PGM DEMAND FIRM
45
Anglo American Platinum Limited Interim Results 2020 109
Interim Results July 2020
3E PRIMARY SUPPLY DOWN C.21% IN 2020
3E Primary supply (’000 ounces)(13)
2019* 2020 2025 2030 Production Probable Projects Range of uncertainty
13,859
Current production outlook
between 2020 to 2030
Impact of Covid-19
Probable projects
46
30 JUNE 2020 INTERIM RESULTS 110 Anglo American Platinum Limited Interim Results 2020
Interim Results July 2020
EARNINGS SENSITIVITIES
Sensitivity analysis - 2020 Impact of 10% change in price/FX Commodity / Currency 30 June spot Average realized EBITDA (Rm) Platinum ($/oz) 815 857 504 Palladium ($/oz) 1 900 2 141 1 960 Rhodium ($/oz) 8 000 8 985 1 010 Gold ($/oz) 1 773 1 631 113 Nickel ($/ton) 12 642 13 145 93 Copper ($/ton) 5 953 5 573 38 Chrome ($/ton) 165 109 44 South African Rand 17.31 16.44 4 054
47
Anglo American Platinum Limited Interim Results 2020 111
Interim Results July 2020
DISCIPLINED AND VALUE FOCUSSED CAPITAL ALLOCATION
48
Capital allocation framework
Discretionary capital options
Portfolio upgrade Future project
Additional shareholder returns
5.5 11.1
0.4
H1 2020 (Rbn)
30 JUNE 2020 INTERIM RESULTS 112 Anglo American Platinum Limited Interim Results 2020
Interim Results July 2020
NET CASH FLOW BY MINE
Operation Net cash December 2019 Cash from
SIB and waste capital 100% Operating free cashflow Economic interest adjustment(14) Economic free cashflow(15) Project capital Cash tax and net interest paid Free cash flow Investment in associates, funding &
Customer prepayment Dividend Net cash June 2020
Mogalakwena 5 137 (2 114) 3 022
(159) 2 863) Amandelbult 1 811 (203) 1 608 (33) 1 575) (135) 1 474) Unki 183 (54) 129
(32) 97) Mototolo 682 (199) 483
(48) 435) (522) Joint Ventures 910 (142) 768
(55) 713) 3rd Parties (3 068) (85) (3 153)
(17) (3 170) Other(17) (4 603) (79) (4 683) (37) (4 720) (0) (1 286) (5 969) 2 443 6 716 (11 059)
1 052 (2 877) (1 825) (71) (1 896) (446) (1 286) (3 557) 1 920 6 716 (11 059) 11 298
(0.4) (1.3) 1.1 (2.9) (11.1) 17.3 6.7 1.9 11.3 13.7
(R3.5bn)
49
Anglo American Platinum Limited Interim Results 2020 113
Interim Results July 2020
COST BREAKDOWN
50
Costs reflective of AAP Own mined and Joint Venture share of production and costs at operations. Excludes all purchase of concentrate costs and volume, overhead and marketing expenses.
H1 2020 COST BASE (RBN) VOLUME % PGMS (KOZ) LABOUR CONTRACTORS MATERIALS UTILITIES SUNDRIES
Opencast Mining 2.7 45% 560 18% 4% 44% 2% 32% Conventional Mining 4.7 23% 290 61% 6% 14% 7% 12% Mechanised Mining 4.4 32% 396 41% 7% 30% 6% 15% Concentrating 2.9 18% 0% 35% 21% 26% Processing 3.6 27% 2% 22% 24% 24% Total 18.2 100% 1 246 34% 5% 30% 12% 20%
H1 2019 COST BASE (RBN) VOLUME % PGMS (KOZ) LABOUR CONTRACTORS MATERIALS UTILITIES SUNDRIES
Opencast Mining 2.4 36% 610 17% 5% 44% 2% 32% Conventional Mining 5.1 31% 516 52% 7% 20% 6% 15% Mechanised Mining 4.5 33% 547 43% 7% 33% 6% 15% Concentrating 3.0 15% 0% 39% 20% 27% Processing 3.7 25% 1% 24% 27% 22% Total 18.8 100% 1 673 34% 5% 30% 12% 20%
Non ZAR – 10% of total costs
30 JUNE 2020 INTERIM RESULTS 114 Anglo American Platinum Limited Interim Results 2020
Interim Results July 2020
Mogalakwena Amandebult Unki Mototolo JV mined AAP Total mined Costs (US$million) Cash operating costs 289 288 75 71 127 850 Other costs and marketing 57 55 26 12 16 170 Capitalised waste costs 85
Sustaining capital 44 12 3 12 7 79
a
Total Cost 474 356 104 94 150 1 184 Total revenue excluding platinum PGMs excluding platinum 530 379 93 111 227 1 339 Base metals, chrome and other 16 (8) 1 (9) (15) (14)
b
Total revenue ex. Platinum 547 371 94 102 212 1 325
c = a – b
All-in sustaining costs (72) (16) 11 (8) (62) (141)
d
Platinum ounces sold (000) 122 88 20 24 41 295
e = c ÷ d x 1,000
US$ AISC per platinum ounce sold (594) (176) 525 (320) (1 503) (480) Average Pt price achieved ($) 857 857 857 857 857 857 Marketing adjustment (57) (55) (60) (56) (65) (57) Realised $ cash margin/Pt ounce sold 1 508 1 089 392 1 233 2 425 1 394
~ Not consolidated in economic free cash flow
ALL-IN SUSTAINING COST (AISC)
51
Anglo American Platinum Limited Interim Results 2020 115
Interim Results July 2020
Mogalakwena Amandebult Unki Mototolo JV mined POC/Other Company (ex-trading) (18) Net sales revenue (US$million) from platinum 105 76 17 21 38 121 378 from palladium 358 115 49 41 84 196 843 from rhodium 121 227 31 58 122 286 845 base metals & other 109 64 23 12 21 133 362
a
Total Revenue 693 482 120 132 265 735 2 428 Sales volume (000 ounces)
b
Platinum ounces sold 122 88 20 24 41 141 436 Other PGMs sold 221 141 37 45 83 267 794
c
Total PGMs sold 343 229 57 69 124 408 1 229
d = a ÷ b x 1,000
US$ basket per platinum ounce 5 681 5 476 6 012 5 545 6 448 5 228 5 573
e = a ÷ c x 1,000
US$ basket per PGM ounce 2 018 2 103 2 115 1 929 2 143 1 804 1 975
f
US Dollar/ZAR exchange rate 16.44 16.44 16.44 16.44 16.44 16.44 16.44
g = d x f
Rand basket per platinum ounce 93 370 89 998 98 813 91 145 105 973 85 934 90 776
h = e x f
Rand basket per PGM ounce 33 164 34 565 34 766 31 703 35 218 29 653 32 460
~ Not consolidated in economic free cash flow
RAND BASKET PRICE
52
30 JUNE 2020 INTERIM RESULTS 116 Anglo American Platinum Limited Interim Results 2020
Interim Results July 2020
Mogalakwena Amandebult Unki Mototolo JV mined Mining POC Toll Trading Company
c = a x b
Net revenue 11 385 7 923 1 977 2 173 4 359 27 817 12 088 392 14 866 54 770
a
Rand basket per PGM ounce 33 164 34 565 34 766 31 703 35 218 33 853 29 653 32 437
b
PGM ounces sold (000 ounces) 343 229 57 69 124 822 408 459 1 689
f = d x e
Cash operating costs 5 106 4 492 1 107 1 043 2 075 13 722 15 036 28 859
d
Cash operating cost/PGM oz (M&C) 9 120 20 626 13 782 14 294 12 555
d
Purchase of concentrate/PGM oz (M&C) 27 798
e
PGM oz produced (M&C) (000 ounces) 560 218 80 82 145 1 093 541 1 634
g
Other costs (164) 1 150 308 307 118 1 911 (5 070) 349 14 380 12 849 Other cost (468) 887 193 236 (13) 1 855 (5 070) 349 14 380 11 556 Royalties 304 262 112 71 131 892 892 Marketing & Development 400
h = f + g
Total cost 4 942 5 642 1 415 1 350 2 194 15 632 9 967 349 14 380 41 707
i = c – h
EBITDA 6 443 2 281 532 823 2 165 12 185 2 121 44 486 13 063
j = i/c x 100 EBITDA margin
57% 29% 28% 38% 50% 44% 18% 31% 3% 24%
~ Unit cost excludes once off costs
SIMPLIFIED EBITDA PER PGM OUNCE
53
Anglo American Platinum Limited Interim Results 2020 117
Interim Results July 2020
Mogalakwena Amandebult Unki Mototolo JV mined Mining POC Toll Trading Company
c = a x b
Net revenue 11 385 7 923 1 977 2 173 4 359 27 817 12 088 392 14 866 54 770
a
Rand basket per platinum ounce 93 370 89 998 98 813 91 145 105 973 94 311 85 934 94 130
b
Rand basket ounces sold (000 ounces) 122 88 20 24 41 295 141 146 582
f = d x e
Cash operating costs 5 106 4 492 1 107 1 043 2 075 13 722 15 036 28 859
d
Cash operating cost/Pt oz (M&C) 21 347 40 515 31 017 27 624 32 094
d
Purchase of concentrate/Pt oz (M&C) 57 158
e
Pt oz produced (M&C) (000 ounces) 239 111 36 38 65 491 263 755
g
Other costs (164) 1 150 308 307 118 1 911 (5 070) 349 14 380 12 849 Other cost (468) 887 193 236 (13) 1 855 (5 070) 349 14 380 11 556 Royalties 304 262 112 71 131 892 892 Marketing & Development 400
h = f + g
Total cost 4 942 5 642 1 415 1 350 2 194 15 632 9 967 349 14 380 41 707
i = c – h
EBITDA 6 443 2 281 532 823 2 165 12 185 2 121 44 486 13 063
j = i/c x 100 EBITDA margin
57% 29% 28% 38% 50% 44% 18% 31% 3% 24%
~ Unit cost excludes once off costs
SIMPLIFIED EBITDA PER PLATINUM OUNCE
54
30 JUNE 2020 INTERIM RESULTS 118 Anglo American Platinum Limited Interim Results 2020
Interim Results July 2020
FOOT NOTES
(1) Total recordable case injury frequency rate (TRCFR) is a measure of the rate of all injuries requiring treatment above first aid per 1,000,000 hours worked (2) Refined production excluding tolling and 4E purchase of concentrate that is now tolled (3) AISC stands for all-in sustaining costs: defined as cash operating costs, overhead costs, other income and expenses, all sustaining capital expenditure, capitalised waste stripping and allocated marketing and market development costs net of revenue from all metals other than platinum (4) LDV stands for light-duty vehicles (5) Source: Company analysis (6) Source: LMC Automotive (7) ICE stands for internal combustion engine (8) Source: Johnson Matthey, Company analysis (9) Source: Johnson Matthey, Company analysis (10) Source: World Platinum Investment Council (11) Source: Company analysis (12) Source: Company analysis (13) Source: 2019 per Johnson Matthey view (May 2020) , Company analysis (14) Economic interest adjustment is an adjustment to exclude minority share of operating free cash flow for subsidiaries / joint operations and include associate’s share of profit or loss (15) Economic free cash flow represents AAP’s economic share of operating cash flow after adjusting for minority interests for subsidiaries / joint operations and includes associate’s share or profit and loss (16) Investment in associates, funding and other: includes Mototolo deferred consideration, Sibanye deferred consideration, Proceeds from BRPM and Bokoni funding (17) Other: includes market and market development costs, restructuring, working capital movements not allocated to each individual asset (18) Company excluding trading – does not include traded ounces
Images
55
Anglo American Platinum Limited Interim Results 2020 119
30 JUNE 2020 INTERIM RESULTS 120 Anglo American Platinum Limited Interim Results 2020
DISCLAIMER Certain elements made in this annual report constitute forward looking statements. Forward looking statements are typically identified by the use of forward looking terminology such as ‘believes’, ‘expects’, ‘may’, ‘will’, ‘could’, ‘should’, ‘intends’, ‘estimates’, ‘plans’, ‘assumes’, or ‘anticipates’ or the negative thereof or other variations thereon or comparable terminology, or by discussions
subject to a number of risks and uncertainties, many of which are beyond the Company’s control and all of which are based on the Company’s current beliefs and expectations about future events. Such statements are based on current expectations and, by their current nature, are subject to a number of risks and uncertainties that could cause actual results and performance to differ materially from any expected future results or performance, expressed or implied, by the forward looking statement. No assurance can be given that such future results will be achieved; actual events or results may differ materially as a result of risks and uncertainties facing the Company and its subsidiaries. DIRECTORS Executive directors N Viljoen (Chief executive officer) CW Miller (Finance director) Independent non-executive directors NP Mageza (Lead independent director) NT Moholi D Naidoo JM Vice Non-executive directors N Mbazima (Non-executive chairman) M Cutifani (Australian) ST Pearce (Australian) AM O’Neill (British) COMPANY SECRETARY Elizna Viljoen elizna.viljoen@angloamerican.com Telephone +27 (0) 11 638 3425 Facsimile +27 (0) 11 373 5111 FINANCIAL, ADMINISTRATIVE, TECHNICAL ADVISERS Anglo Operations Proprietary Limited CORPORATE AND DIVISIONAL OFFICE, REGISTERED OFFICE AND BUSINESS AND POSTAL ADDRESSES OF THE COMPANY SECRETARY AND ADMINISTRATIVE ADVISERS 55 Marshall Street, Johannesburg 2001 PO Box 62179, Marshalltown 2107 Telephone +27 (0) 11 373 6111 Facsimile +27 (0) 11 373 5111 +27 (0) 11 834 2379 SPONSOR Merrill Lynch South Africa (Pty) Ltd The Place, 1 Sandton Drive, Sandton 2196 REGISTRARS Computershare Investor Services Proprietary Limited Rosebank Towers, 15 Bierman Avenue Rosebank, 2196 PO Box 61051 Marshalltown 2107 Telephone +27 (0) 11 370 5000 Facsimile +27 (0) 11 688 5200 AUDITORS PricewaterhouseCoopers Inc 4 Lisbon Lane Waterfall City Jukskei View 2090 INVESTOR RELATIONS Emma Chapman emma.chapman@angloamerican.com Telephone +27 (0) 11 373 6239 LEAD COMPETENT PERSON Gordon Smith gordon.smith@angloamerican.com Telephone +27 (0) 11 373 6334 FRAUD LINE – SPEAKUP Anonymous whistleblower facility 0800 230 570 (South Africa) www.yourvoice.angloamerican.com HR-RELATED QUERIES Job opportunities: www.angloamericanplatinum.com/ careers/job-opportunities Bursaries, email: bursaries@angloplat.com Career information: www.angloamericanplatinum.com/ careers/working-at-anglo-american-platinum
Anglo American Platinum Limited Incorporated in the Republic of South Africa Date of incorporation: 13 July 1946 Registration number: 1946/022452/06 JSE code: AMS – ISIN: ZAE000013181 www.angloamericanplatinum.com A member of the Anglo American plc group www.angloamerican.com Find us on Facebook Follow us on Twitter