10:40am (US Central) up 9:40am (US Mountain) 8:40am (US Pacific) - - PowerPoint PPT Presentation

10 40am us central
SMART_READER_LITE
LIVE PREVIEW

10:40am (US Central) up 9:40am (US Mountain) 8:40am (US Pacific) - - PowerPoint PPT Presentation

Ask a question! Use the chat tool or tweet using #iiotvirtualconf Up next 11:40am (US Eastern) 10:40am (US Central) up 9:40am (US Mountain) 8:40am (US Pacific) Transform your data into strategic business value with predictive


slide-1
SLIDE 1

1

up

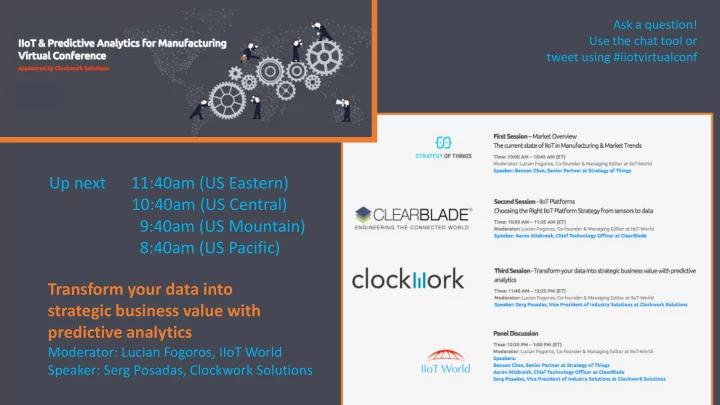
Up next 11:40am (US Eastern) 10:40am (US Central) 9:40am (US Mountain) 8:40am (US Pacific) Transform your data into strategic business value with predictive analytics

Moderator: Lucian Fogoros, IIoT World Speaker: Serg Posadas, Clockwork Solutions

Ask a question! Use the chat tool or tweet using #iiotvirtualconf

slide-2
SLIDE 2

2

slide-3
SLIDE 3

3

You’ve never had more data on your strategic assets

  • historical data on operations,

maintenance, and inspections

  • real-time and sensor data
  • digital and virtual asset models
slide-4
SLIDE 4

4

But data ALONE provides NO strategic VALUE

slide-5
SLIDE 5

5

gathering data + predictive modeling + actionable insights = Strategic Value

Transforming data into timely insights and relevant actions

slide-6
SLIDE 6

6

“million dollar” questions

  • How can I improve total effective equipment

performance?

  • How do I get the most valueout of my assets?
  • How do I avoid costs when operating and

maintaining my assets?

  • How do I best manage spare parts to keep my assets

running?

  • How do I best design my operation to employ my

assets?

  • How do I maintain optimal uptime and asset-

generated revenue?

…So you can answer these

slide-7
SLIDE 7

7

Rear- facing BI is not accurate

Historical business “intelligence” is looking back at historical data in attempt to react.

What Just Happened?

slide-8
SLIDE 8

8

…but how do you get the right answers?

traditional analytics predictive analytics

  • rear facing
  • helpful after

the fact

  • reactive
  • forward looking
  • provides warning and

actionable insight

  • supports well-developed

strategies

  • quantifies risk

traditional forecasting

  • tied to historical data
  • doesn’t account for
  • peration changes
  • can’t anticipate dynamic

environment, aging, etc.

Strategic value

?

  • What just happened?

What will happen? What should we do? Most solution providers Next gen predictive analytics

slide-9
SLIDE 9

9

Traditional forecasting analytics

  • Limited to historical view
  • Can’t include future events,

policy changes, evolution of business environment

  • Does not measure risk
  • Very likely to incur greater costs or

more down time

  • Lacks ability to support strategic

planning Traditional forecasting trades accuracy for ease of implementation

?

slide-10
SLIDE 10

10

Predictive analytics

  • Insights well beyond rear facing

analytics

  • Historical data only defines

starting point

  • Models future events for each

asset and its components

  • Simulates operations hour by

hour, including failures, repairs, shipments, part buys, refurbishment, retirement,

  • bsolescence, etc.
  • Provides a holistic view of

complex scenarios Predictive analytics provides a higher degree of accuracy

slide-11
SLIDE 11

11

Predictive

analytics is

determining

industry leaders

Within the next five years, advanced implementation of Industry 4.0 will become a ‘qualifier to compete’ and is also likely to be seen by investors as a ‘qualifier for funding’.

Industry 4.0: Building the digital enterprise, PwC 2016 Global Industrial Survey, April 2016

slide-12
SLIDE 12

12

IIoT predictive

analytics

Challenges

Data

  • Multiple sensors
  • High volume & velocity
  • Complex distribution of sources

Obstacles

  • Simple data but requires advanced techniques
  • Combine asset health monitoring with maintenance &
  • perations data
  • Need automation
slide-13
SLIDE 13

13

CBM challenge

Asset health monitoring for predictive maintenance analytics

Benefits

  • Leverage advances in predictive health maintenance
  • Reduced unplanned downtime
  • Control costs

Challenges

  • Data quality
  • Data structures
  • Volume & velocity of real-time and historical data sets
  • Prediction accuracy
  • False positives
slide-14
SLIDE 14

14

Data aggregation

  • Automate data aggregation & transformation
  • Leverage latest techniques for data conditioning
  • Combine data silos sources for complete, accurate prognostics
slide-15
SLIDE 15

15

Machine Learning & CBM

slide-16
SLIDE 16

16

  • 1. Separate data into training and test sets.
  • 2. Describe the data attributes in the training data set

Normal Pre-Failure Failure Normal Normal Normal

Machine Learning & CBM

Training

slide-17
SLIDE 17

17

Normal Pre-Failure Normal Pre-Failure Failure

Machine Learning & CBM

  • 1. Separate data into training and test sets.
  • 2. Describe the data attributes in the training data set.
  • 3. Apply a predictive technique
  • 4. Evaluate predictor with test data and measure error.
  • 5. If not satisfied, try another predictor.

Repeat while minimizing error.

Test Predictions

slide-18
SLIDE 18

18

Machine Learning & CBM

  • 1. Separate data into training and test sets.
  • 2. Describe the data attributes in the training data set.
  • 3. Apply a predictive technique
  • 4. Evaluate predictor with test data and measure error.
  • 5. If not satisfied, try another predictor.

Repeat while minimizing error.

  • 6. Select best prediction algorithm.

Predict based on new values.

  • 7. May have to re-train as conditions evolve.

Normal Pre-Failure Pre-Failure Failure Normal Normal

New Predictions

slide-19
SLIDE 19

19

CBM reality

Sensor data is noisy & inconclusive

sensor 1 sensor 2 sensor 3 sensor 4 sensor 5

not so fast…

slide-20
SLIDE 20

20

CBM condition indicators

train test

False Positive Rate 10% Anomaly Detection Rate 65%

slide-21
SLIDE 21

21

Complete predictive view

Sufficient data set

2 4 6 8 10

100 200 300 400

Minor maintenance actions Operational profile change Location of
  • perations

Operating Hours Operating Hours CI Value

Sufficient data set

Time series behavior of each CI

Ideal data set

Add maintenance and operational events

  • Maintenance Actions
  • Operational Profile Changes
  • Operation Locations

Goal: Develop accurate prognostic Requirement: Study Condition Indicator (CI) across lifetime of a component.

CI Value

slide-22
SLIDE 22

22

Super condition indicator

  • Individual CIs often may not have sufficient prognostic power
  • Leverage Super CI to increase predictive resolution
Sensitivity 0.00 0.10 0.20 0.30 0.40 0.50 0.60 0.70 0.80 0.90 1.00 0.00 0.20 0.40 0.60 0.80 1.00 1-Specificity Receiver Operating Characteristic

OBE

Sensitivity 0.00 0.10 0.20 0.30 0.40 0.50 0.60 0.70 0.80 0.90 1.00 0.00 0.20 0.40 0.60 0.80 1.00 1-Specificity Receiver Operating Characteristic Sensitivity 0.00 0.10 0.20 0.30 0.40 0.50 0.60 0.70 0.80 0.90 1.00 0.00 0.20 0.40 0.60 0.80 1.00 1-Specificity Receiver Operating Characteristic

MDR IDA3

Sensitivity 0.00 0.10 0.20 0.30 0.40 0.50 0.60 0.70 0.80 0.90 1.00 0.00 0.20 0.40 0.60 0.80 1.00 1-Specificity Receiver Operating Characteristic

ODA1

Sensitivity 0.00 0.10 0.20 0.30 0.40 0.50 0.60 0.70 0.80 0.90 1.00 0.00 0.20 0.40 0.60 0.80 1.00 1-Specificity Receiver Operating Characteristic

OFM0

Sensitivity 0.00 0.10 0.20 0.30 0.40 0.50 0.60 0.70 0.80 0.90 1.00 0.00 0.20 0.40 0.60 0.80 1.00 1-Specificity Receiver Operating Characteristic

IFM0

Individual CI’s COMBINED SUPER CI

slide-23
SLIDE 23

23

Determine the best fit

slide-24
SLIDE 24

24

  • Evaluate many prognostic algorithms to determine best fit

COMBINED SUPER CI

0.2 0.4 0.6 0.8 1 1.2 1.4

100 200 300 400 500

CI Value Hours to Removal

Degradation

Hours to Removal

200 175 150 125 100 75 50

LDA 35% 37% 57% 59% 71% 93% 100% Gaussian Naïve Bayes 39% 42% 46% 53% 68% 89% 100% K Neighbors 65% 57% 57% 58% 68% 82% 100% QDA 37% 39% 43% 51% 65% 84% 100% Linear Support Vectors 38% 38% 42% 47% 60% 77% 80% Non-linear Support Vectors 29% 30% 34% 43% 55% 77% 88% Logistic Regression 37% 37% 39% 43% 55% 70% 56% Stochastic Gradient Descent 21% 15% 24% 34% 35% 59% 4% Ridge Classifier 35% 34% 37% 43% 53% 73% 68%

Determine the best fit

slide-25
SLIDE 25

25

Anomaly detection

  • Identify distinct probability distributions for Super CI indications
  • Produce failure lead time

COMBINED SUPER CI Healthy Component Anomalous Component

Anomalous Component with >100 hours to causal removal

slide-26
SLIDE 26

26

Abating False positives

  • Analysis select wait time required to distinguish

between false positive and true anomaly

  • Reduces negative impact on maintenance and supply
  • Account for spikes and dips in the data
  • Manage data quality with cleansing and

transforation

  • Determine the optimal time for

maintenance

slide-27
SLIDE 27

27

CBM results

  • Provide repair lead time

– Reduce wait times for maintenance & parts – Optimize labor

  • Avoid catastrophic failures
  • Reduce logistics response time
  • Control impact of failures on operations
  • Extend asset life
  • Minimize unplanned downtime
slide-28
SLIDE 28

28

But What About…

  • Parts with no sensors
  • Long term strategies
  • Impact on costs
  • Inventory Optimization
  • Future Performance metrics
slide-29
SLIDE 29

29

But What About…

  • Parts with no sensors
  • Long term strategies
  • Impact on costs
  • Inventory Optimization
  • Future Performance metrics

Asset Life Cycle Management

slide-30
SLIDE 30

30

Life Cycle

Management

(LCM)

Benefits

  • Strategic approach to long-term asset planning
  • Accurately managing future costs and expenses
  • Maximizing uptime and revenue

Uses

  • Managing components and assets with and without sensors
  • Accounting for changes in operations, upgrades, …
  • Anticipating dynamic conditions & evolving environment
  • Evaluating alternate future scenarios

Asset Operations Maintenance Supply Logistics Sustainment

slide-31
SLIDE 31

31

CBM & LCM benefits

  • Evaluate impact of full asset BOM
  • Design maintenance strategies
  • Integrate operational changes with

maintenance planning

  • Optimize future enterprise inventory
  • Control Costs
  • Attain future business goals

– Maximize up time & readiness – Control risk

  • Budget
  • Operations

– Maximize Revenue

slide-32
SLIDE 32

32

About us

slide-33
SLIDE 33

33

Quick facts

  • Unique focus on capital

intensive physical assets

  • Experience across

multiple industries

  • Software built out of

service focus

  • Over 30 years of experience
  • Based in Austin, Texas;

deployed worldwide Predictive health management Condition-based maintenance Life Cycle Management Performance based logistics Data management

slide-34
SLIDE 34

34

…and trusted by

  • ur clients

(including but far from limited to…)

slide-35
SLIDE 35

35

Turning datainto information supporting decisions, processes and automation

Raw Data Aggregation Data Cleansing & Consolidation Predictive Model Design Operationalizing Predictive Output Automated Decision Making Optimization

slide-36
SLIDE 36

36

Platform

Studio Backbone

Life Cycle Management Sensor Prognostics Design Data Acquisition

Database access Flat file Big Data Streaming Data

Data Quality & Transformation

Productized Models

Analytics Libraries

Machine Learning Neural Networks NLP and more

Data Visualization

Viz Libraries Reports Dashboards

Discrete Event Simulation

Simulation Engine Asset models Metric Aggregation

Analytics Software Platform

slide-37
SLIDE 37

37 37

Studio:

data mgt and analytics

Supports data scientists and analysts with powerful tools for managing, analyzing and visualizing data

slide-38
SLIDE 38

38 38

LCM: modeling asset lifecycles

Represents

  • Aging of assets
  • Changes in operations
  • Retirements &

Acquisitions

  • Repair degradation
  • Risk and Uncertainty

Includes

  • Deep asset indentures
  • Asset age & condition

initialized from raw data

  • Detailed baseline and

alternative cases

  • Simulation output data that

would otherwise not exist

  • Future supply, sustainment

and maintenance changes

  • Best performance at least cost

Asset Operations Maintenance Supply Logistics Sustainment

slide-39
SLIDE 39

39

Business challenges

  • Equipment maintenance is an extensive expense
  • Multiple process control sensors with potential to detect

impending issues before failure

  • Long maintenance lead times lowering customer satisfaction

Solution

  • Smoothing algorithm to the raw sensor data

and maintenance history data

  • Baseline anomaly detection prognostic by

combining five sensor readings

  • One month historical data to train algorithm
  • Advance warning on impending failures

– 5 months for heater wire – 2 months gerotor

ROI

  • Predictive Heath Maintenance (PHM) prognostics
  • Advance scheduling of maintenance before issues arise

case study:

Industrial Packaging Machines

39

Global provider of high volume packing equipment for shipping

slide-40
SLIDE 40

40

Questions

slide-41
SLIDE 41

41

up

Up next 12:30pm (US Eastern) 11:30am (US Central) 10:30am (US Mountain) 9:30am (US Pacific) Panel discussion

Host: Lucian Fogoros, IIoT World Panel: Benson Chan, Strategy of Things Aaron Allsbrook, ClearBlade Serg Posadas, Clockwork Solutions

Ask a question! Use the chat tool or tweet using #iiotvirtualconf

slide-42
SLIDE 42

42

Ask a question! Use the chat tool or tweet using #iiotvirtualconf

aallsbrook@clearblade.com sposadas@clockwork-solutions.com benson@strategyofthings.io lucian.fogoros@iiot-world.com